
Live Cell Imaging Market based on Product (Equipment, Consumable and Software), Application (Cell Biology, Developmental Biology, Stem Cell & Drug Discovery and Others), Technology (Time-lapse Microscopy, Fluorescence recovery after photobleaching (FRAP), Fluorescence resonance energy transfer (FRET), High content screening (HCS) and Others) and Geography – Global Forecast up to 2027
- July, 2021
- Domain: Healthcare - Biotechnology
- Get Free 10% Customization in this Report
Live cell imaging is the method to study live cells with the help of images taken from imaging systems, including high content screening systems and microscopes. Scientists use this method to better understand the cell's biological function by examining the cellular dynamics. In recent years, various researchers have broadly accepted the technology of live cell imaging to gain better knowledge about cell biology. The increasing concern of cancer is one of the significant factors behind the rising demand for this technology. Furthermore, the government is prominently taking initiatives to invest in cell-based research. In addition, live cell imaging has a wide range of applications, and it can be used to understand dynamic processes and cellular structures. Moreover, it can also study cellular integrity, localization of molecules, enzyme activity, protein trafficking, exocytosis, and endocytosis. However, the cost of applying live cell imaging is huge, which is acting as a constraint for the market growth. The Live Cell Imaging Market is anticipated to grow at the rate of 8.9% CAGR by 2027.
Research Methodology:
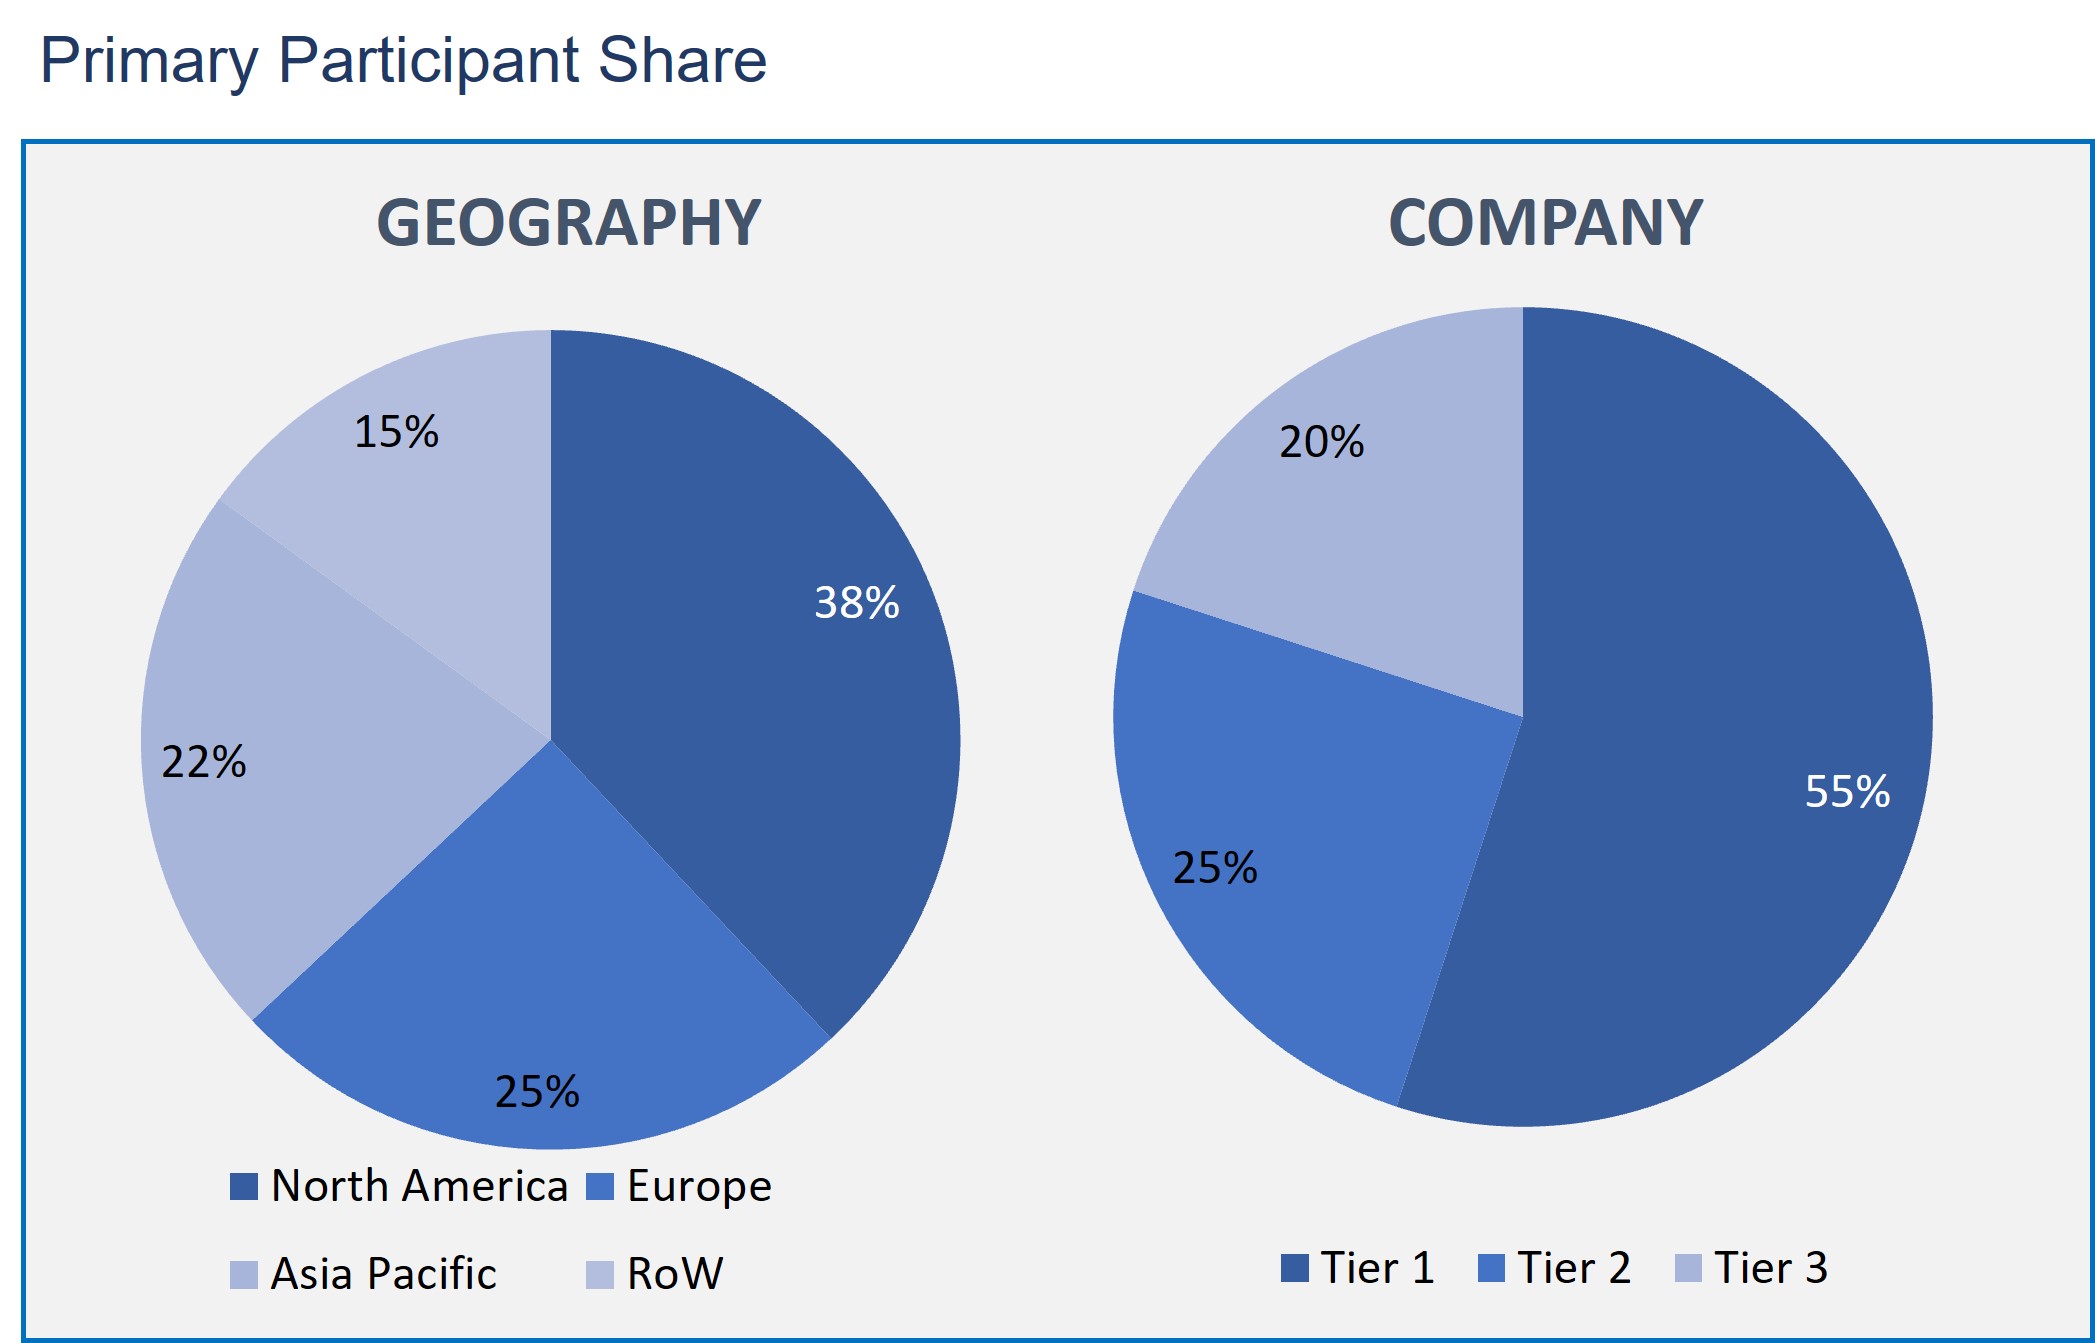
The Live Cell Imaging Market has been analyzed by utilizing the optimum combination of secondary sources and in-house methodology and a unique balance of primary insights. The real-time valuation of the market is an integral part of our forecasting and market sizing methodology. Industry experts and our primary participants have helped to compile related aspects with accurate parametric estimations for a complete study. The primary participants share is given below:
Live Cell Imaging Market based on Product
- Equipment
- Consumable
- Software
Live Cell Imaging Market based on Application
- Cell Biology
- Developmental Biology
- Stem Cell & Drug Discovery
- Others
Live Cell Imaging Market based on Technology
- Time-lapse Microscopy
- Fluorescence recovery after photobleaching (FRAP)
- Fluorescence resonance energy transfer (FRET)
- High content screening (HCS)
- Others
Live Cell Imaging Market based on Geography
- North America
- Europe
- Asia Pacific
- Rest of the World
Based on the product, the equipment segment has dominated the market. However, immense research being carried out to develop microscopes of higher resolution is likely to boost the segment growth. Advanced technologies such as inverted research-grade microscopes have allowed imaging of adherent cells and organelles and produce outcomes for tissue sections of less than 5 um thickness. Advanced developments are also enabling imaging of the cells in spatial resolutions within a time range.
The cell biology segment is leading the market on the basis of application. This is due to the increasing number of researchers working on molecular interaction networks. In addition, filter techniques and advanced illumination devices are innovations that further allow the procedure. Moreover, cell biologists use live cell imaging to understand the basic cellular structures and their interaction on the tissue level.
Further, the fluorescence resonance energy transfer segment is the significant segment based on the technology in the market. This is due to its advantage in ascertaining the spatial proximity at the protein level, which fluorescence microscopy cannot obtain. Furthermore, this technology has gained popularity in recent years due to its increasing application in genetic targeting peptides.
North America region is having a significant position in the market based on geography. The significant position is attributed to the rising demand for live cell imaging for drug discovery and increased products launched in this region. In drug discovery, the live cell imaging system helps understand the processes of cells, which offers an intensified picture of drug pharmacology.
Escalating demand of live cell imaging systems in drug discovery and government investments for evolution and advancements in live cell imaging systems are few major factors driving the growth of the global live cell imaging market. However, as knowing cellular structure and dynamic processes can be complicated in cell biology, the live cell imaging system solves this problem. Furthermore, as live cell usually offers more relevant information, it offers data about cell interaction, the behavior of single cells, and dynamics of cell organelles.
The leading vendors of the live cell imaging market are Thermo Fisher Scientific Inc., Nikon Instruments Inc., Molecular Devices, LLC, BioTek Instruments, Inc., PerkinElmer Inc., Bruker Corporation, General Electric, Olympus Corporation, CYTOSKELETON, INC. and Merck KGaA.
Henceforth, live cell imaging technology has changed the way biologists study cells, proteins, and various processes and molecular interactions. Moreover, live cell imaging technology is majorly helpful in cell biology, which is a key concept in understanding the functions of cells.
- This report identifies the regions and segments projected to witness the highest CAGR rate and lead the market.
- The report also provides the analysis of geography focusing on the consumption of the product/service in the region coupled with the factors impacting the market in each region.
- This report gives the competitive outlook, which consists of the market ranking of the key players.
- Further present the information of recent product launches, partnerships, business expansions, and acquisitions of the market vendors.
- Executive Summary
- Industry Outlook
- Industry Overview
- Industry Trends
- Market Snapshot
- Market Definition
- Market Outlook
- Porter Five Forces
- Related Markets
- Market characteristics
- Market Overview
- Market Segmentation
- Market Dynamics
- Drivers
- Restraints
- Opportunities
- DRO - Impact Analysis
- Product: Market Size & Analysis
- Overview
- Equipment
- Consumable
- Software
- Application: Market Size & Analysis
- Overview
- Cell Biology
- Developmental Biology
- Stem Cell & Drug Discovery
- Others
- Technology: Market Size & Analysis
- Overview
- Time-lapse Microscopy
- Fluorescence recovery after photobleaching (FRAP)
- Fluorescence resonance energy transfer (FRET)
- High content screening (HCS)
- Others
- Geography: Market Size & Analysis
- Overview
- North America
- Europe
- Asia Pacific
- Rest of the World
- Competitive Landscape
- Competitor Comparison Analysis
- Market Developments
- Mergers and Acquisitions, Legal, Awards, Partnerships
- Product Launches and execution
- Vendor Profiles
- Thermo Fisher Scientific Inc.
- Overview
- Financial Overview
- Product Offerings
- Developments
- Business Strategy
- Nikon Instruments Inc.
- Overview
- Financial Overview
- Product Offerings
- Developments
- Business Strategy
- Molecular Devices, LLC
- Overview
- Financial Overview
- Product Offerings
- Developments
- Business Strategy
- BioTek Instruments, Inc.
- Overview
- Financial Overview
- Product Offerings
- Developments
- Business Strategy
- PerkinElmer Inc.
- Overview
- Financial Overview
- Product Offerings
- Developments
- Business Strategy
- Bruker Corporation
- Overview
- Financial Overview
- Product Offerings
- Developments
- Business Strategy
- General Electric
- Overview
- Financial Overview
- Product Offerings
- Developments
- Business Strategy
- Olympus Corporation
- Overview
- Financial Overview
- Product Offerings
- Developments
- Business Strategy
- CYTOSKELETON, INC.
- Overview
- Financial Overview
- Product Offerings
- Developments
- Business Strategy
- Merck KGaA
- Overview
- Financial Overview
- Product Offerings
- Developments
- Business Strategy
- Thermo Fisher Scientific Inc.
- Annexure
- Report Scope
- Market Definitions
- Research Methodology
- Data Collation and In-house Estimation
- Market Triangulation
- Forecasting
- Report Assumptions
- Declarations
- Stakeholders
- Abbreviations
TABLE 1. GLOBAL LIVE CELL IMAGING MARKET VALUE, BY PRODUCT, 2021-2027 (USD BILLION)
TABLE 2. GLOBAL LIVE CELL IMAGING MARKET VALUE FOR EQUIPMENT, BY GEOGRAPHY, 2021-2027 (USD BILLION)
TABLE 3. GLOBAL LIVE CELL IMAGING MARKET VALUE FOR CONSUMABLE, BY GEOGRAPHY, 2021-2027 (USD BILLION)
TABLE 4. GLOBAL LIVE CELL IMAGING MARKET VALUE FOR SOFTWARE, BY GEOGRAPHY, 2021-2027 (USD BILLION)
TABLE 5. GLOBAL LIVE CELL IMAGING MARKET VALUE, BY APPLICATION, BY GEOGRAPHY, 2021-2027 (USD BILLION)
TABLE 6. GLOBAL LIVE CELL IMAGING MARKET VALUE FOR CELL BIOLOGY, BY GEOGRAPHY, 2021-2027 (USD BILLION)
TABLE 7. GLOBAL LIVE CELL IMAGING MARKET VALUE FOR DEVELOPMENTAL BIOLOGY, BY GEOGRAPHY, 2021-2027 (USD BILLION)
TABLE 8. GLOBAL LIVE CELL IMAGING MARKET VALUE FOR STEM CELL & DRUG DISCOVERY, BY GEOGRAPHY, 2021-2027 (USD BILLION)
TABLE 9. GLOBAL LIVE CELL IMAGING MARKET VALUE FOR OTHERS, BY GEOGRAPHY, 2021-2027 (USD BILLION)
TABLE 10. GLOBAL LIVE CELL IMAGING MARKET VALUE, BY TECHNOLOGY, 2021-2027 (USD BILLION)
TABLE 11. GLOBAL LIVE CELL IMAGING MARKET VALUE FOR TIME-LAPSE MICROSCOPY, BY GEOGRAPHY, 2021-2027 (USD BILLION)
TABLE 12. GLOBAL LIVE CELL IMAGING MARKET VALUE FOR FLUORESCENCE RECOVERY AFTER PHOTOBLEACHING (FRAP), BY GEOGRAPHY, 2021-2027 (USD BILLION)
TABLE 13. GLOBAL LIVE CELL IMAGING MARKET VALUE FOR FLUORESCENCE RESONANCE ENERGY TRANSFER (FRET), BY GEOGRAPHY, 2021-2027 (USD BILLION)
TABLE 14. GLOBAL LIVE CELL IMAGING MARKET VALUE FOR HIGH CONTENT SCREENING (HCS), BY GEOGRAPHY, 2021-2027 (USD BILLION)
TABLE 15. GLOBAL LIVE CELL IMAGING MARKET VALUE FOR OTHERS, BY GEOGRAPHY, 2021-2027 (USD BILLION)
TABLE 16. NORTH AMERICA LIVE CELL IMAGING MARKET VALUE, BY COUNTRY, 2021-2027 (USD BILLION)
TABLE 17. NORTH AMERICA LIVE CELL IMAGING MARKET VALUE, BY PRODUCT, 2021-2027 (USD BILLION)
TABLE 18. NORTH AMERICA LIVE CELL IMAGING MARKET VALUE, BY APPLICATION, 2021-2027 (USD BILLION)
TABLE 19. NORTH AMERICA LIVE CELL IMAGING MARKET VALUE, BY TECHNOLOGY, 2021-2027 (USD BILLION)
TABLE 20. U.S LIVE CELL IMAGING MARKET VALUE, BY PRODUCT, 2021-2027 (USD BILLION)
TABLE 21. U.S LIVE CELL IMAGING MARKET VALUE, BY APPLICATION, 2021-2027 (USD BILLION)
TABLE 22. U.S LIVE CELL IMAGING MARKET VALUE, BY TECHNOLOGY, 2021-2027 (USD BILLION)
TABLE 23. CANADA LIVE CELL IMAGING MARKET VALUE, BY PRODUCT, 2021-2027 (USD BILLION)
TABLE 24. CANADA LIVE CELL IMAGING MARKET VALUE, BY APPLICATION, 2021-2027 (USD BILLION)
TABLE 25. CANADA LIVE CELL IMAGING MARKET VALUE, BY TECHNOLOGY, 2021-2027 (USD BILLION)
TABLE 26. EUROPE LIVE CELL IMAGING MARKET VALUE, BY COUNTRY, 2021-2027 (USD BILLION)
TABLE 27. EUROPE LIVE CELL IMAGING MARKET VALUE, BY PRODUCT, 2021-2027 (USD BILLION)
TABLE 28. EUROPE LIVE CELL IMAGING MARKET VALUE, BY APPLICATION, 2021-2027 (USD BILLION)
TABLE 29. EUROPE LIVE CELL IMAGING MARKET VALUE, TECHNOLOGY, 2021-2027 (USD BILLION)
TABLE 30. GERMANY LIVE CELL IMAGING MARKET VALUE, BY PRODUCT, 2021-2027 (USD BILLION)
TABLE 31. GERMANY LIVE CELL IMAGING MARKET VALUE, BY APPLICATION, 2021-2027 (USD BILLION)
TABLE 32. GERMANY LIVE CELL IMAGING MARKET VALUE, BY TECHNOLOGY, 2021-2027 (USD BILLION)
TABLE 33. U.K LIVE CELL IMAGING MARKET VALUE, BY PRODUCT, 2021-2027 (USD BILLION)
TABLE 34. U.K LIVE CELL IMAGING MARKET VALUE, BY APPLICATION, 2021-2027 (USD BILLION)
TABLE 35. U.K LIVE CELL IMAGING MARKET VALUE, BY TECHNOLOGY, 2021-2027 (USD BILLION)
TABLE 36. FRANCE LIVE CELL IMAGING MARKET VALUE, BY PRODUCT, 2021-2027 (USD BILLION)
TABLE 37. FRANCE LIVE CELL IMAGING MARKET VALUE, BY APPLICATION, 2021-2027 (USD BILLION)
TABLE 38. FRANCE LIVE CELL IMAGING MARKET VALUE, BY TECHNOLOGY, 2021-2027 (USD BILLION)
TABLE 39. ITALY LIVE CELL IMAGING MARKET VALUE, BY PRODUCT, 2021-2027 (USD BILLION)
TABLE 40. ITALY LIVE CELL IMAGING MARKET VALUE, BY APPLICATION, 2021-2027 (USD BILLION)
TABLE 41. ITALY LIVE CELL IMAGING MARKET VALUE, BY TECHNOLOGY, 2021-2027 (USD BILLION)
TABLE 42. SPAIN LIVE CELL IMAGING MARKET VALUE, BY PRODUCT, 2021-2027 (USD BILLION)
TABLE 43. SPAIN LIVE CELL IMAGING MARKET VALUE, BY APPLICATION, 2021-2027 (USD BILLION)
TABLE 44. SPAIN LIVE CELL IMAGING MARKET VALUE, BY TECHNOLOGY, 2021-2027 (USD BILLION)
TABLE 45. ROE LIVE CELL IMAGING MARKET VALUE, BY PRODUCT, 2021-2027 (USD BILLION)
TABLE 46. ROE LIVE CELL IMAGING MARKET VALUE, BY APPLICATION, 2021-2027 (USD BILLION)
TABLE 47. ROE LIVE CELL IMAGING MARKET VALUE, BY TECHNOLOGY, 2021-2027 (USD BILLION)
TABLE 48. ASIA PACIFIC LIVE CELL IMAGING MARKET VALUE, BY COUNTRY, 2021-2027 (USD BILLION)
TABLE 49. ASIA PACIFIC LIVE CELL IMAGING MARKET VALUE, BY PRODUCT, 2021-2027 (USD BILLION)
TABLE 50. ASIA PACIFIC LIVE CELL IMAGING MARKET VALUE, BY APPLICATION, 2021-2027 (USD BILLION)
TABLE 51. ASIA PACIFIC LIVE CELL IMAGING MARKET VALUE, BY TECHNOLOGY, 2021-2027 (USD BILLION)
TABLE 52. CHINA LIVE CELL IMAGING MARKET VALUE, BY PRODUCT, 2021-2027 (USD BILLION)
TABLE 53. CHINA LIVE CELL IMAGING MARKET VALUE, BY APPLICATION, 2021-2027 (USD BILLION)
TABLE 54. CHINA LIVE CELL IMAGING MARKET VALUE, BY TECHNOLOGY, 2021-2027 (USD BILLION)
TABLE 55. INDIA LIVE CELL IMAGING MARKET VALUE, BY PRODUCT, 2021-2027 (USD BILLION)
TABLE 56. INDIA LIVE CELL IMAGING MARKET VALUE, BY APPLICATION, 2021-2027 (USD BILLION)
TABLE 57. INDIA LIVE CELL IMAGING MARKET VALUE, BY TECHNOLOGY, 2021-2027 (USD BILLION)
TABLE 58. JAPAN LIVE CELL IMAGING MARKET VALUE, BY PRODUCT, 2021-2027 (USD BILLION)
TABLE 59. JAPAN LIVE CELL IMAGING MARKET VALUE, BY APPLICATION, 2021-2027 (USD BILLION)
TABLE 60. JAPAN LIVE CELL IMAGING MARKET VALUE, BY TECHNOLOGY, 2021-2027 (USD BILLION)
TABLE 61. REST OF APAC LIVE CELL IMAGING MARKET VALUE, BY PRODUCT, 2021-2027 (USD BILLION)
TABLE 62. REST OF APAC LIVE CELL IMAGING MARKET VALUE, BY APPLICATION, 2021-2027 (USD BILLION)
TABLE 63. REST OF APAC LIVE CELL IMAGING MARKET VALUE, BY TECHNOLOGY, 2021-2027 (USD BILLION)
TABLE 64. REST OF WORLD LIVE CELL IMAGING MARKET VALUE, BY PRODUCT, 2021-2027 (USD BILLION)
TABLE 65. REST OF WORLD LIVE CELL IMAGING MARKET VALUE, BY APPLICATION, 2021-2027 (USD BILLION)
TABLE 66. REST OF WORLD LIVE CELL IMAGING MARKET VALUE, BY TECHNOLOGY, 2021-2027 (USD BILLION)
TABLE 67. THERMO FISHER SCIENTIFIC INC: FINANCIALS
TABLE 68. THERMO FISHER SCIENTIFIC INC: PRODUCTS & SERVICES
TABLE 69. THERMO FISHER SCIENTIFIC INC: RECENT DEVELOPMENTS
TABLE 70. NIKON INSTRUMENTS INC: FINANCIALS
TABLE 71. NIKON INSTRUMENTS INC: PRODUCTS & SERVICES
TABLE 72. NIKON INSTRUMENTS INC: RECENT DEVELOPMENTS
TABLE 73. MOLECULAR DEVICES, LLC: FINANCIALS
TABLE 74. MOLECULAR DEVICES, LLC: PRODUCTS & SERVICES
TABLE 75. MOLECULAR DEVICES, LLC: RECENT DEVELOPMENTS
TABLE 76. BIOTEK INSTRUMENTS, INC: FINANCIALS
TABLE 77. BIOTEK INSTRUMENTS, INC: PRODUCTS & SERVICES
TABLE 78. BIOTEK INSTRUMENTS, INC: RECENT DEVELOPMENTS
TABLE 79. PERKINELMER INC: FINANCIALS
TABLE 80. PERKINELMER INC: PRODUCTS & SERVICES
TABLE 81. PERKINELMER INC: RECENT DEVELOPMENTS
TABLE 82. BRUKER CORPORATION: FINANCIALS
TABLE 83. BRUKER CORPORATION: PRODUCTS & SERVICES
TABLE 84. BRUKER CORPORATION: RECENT DEVELOPMENTS
TABLE 85. GENERAL ELECTRIC: FINANCIALS
TABLE 86. GENERAL ELECTRIC: PRODUCTS & SERVICES
TABLE 87. GENERAL ELECTRIC: RECENT DEVELOPMENTS
TABLE 88. OLYMPUS CORPORATION: FINANCIALS
TABLE 89. OLYMPUS CORPORATION: PRODUCTS & SERVICES
TABLE 90. OLYMPUS CORPORATION: RECENT DEVELOPMENTS
TABLE 91. CYTOSKELETON, INC: FINANCIALS
TABLE 92. CYTOSKELETON, INC: PRODUCTS & SERVICES
TABLE 93. CYTOSKELETON, INC: RECENT DEVELOPMENTS
TABLE 94. MERCK KGAA: FINANCIALS
TABLE 95. MERCK KGAA: PRODUCTS & SERVICES
TABLE 96. MERCK KGAA: RECENT DEVELOPMENTS
Research Framework
Infoholic Research works on a holistic 360° approach in order to deliver high quality, validated and reliable information in our market reports. The Market estimation and forecasting involves following steps:
- Data Collation (Primary & Secondary)
- In-house Estimation (Based on proprietary data bases and Models)
- Market Triangulation
- Forecasting

Market related information is congregated from both primary and secondary sources.
Primary sources
Involved participants from all global stakeholders such as Solution providers, service providers, Industry associations, thought leaders etc. across levels such as CXOs, VPs and managers. Plus, our in-house industry experts having decades of industry experience contribute their consulting and advisory services.
Secondary sources
Include public sources such as regulatory frameworks, government IT spending, government demographic indicators, industry association statistics, and company publications along with paid sources such as Factiva, OneSource, Bloomberg among others.
![]()


