
Intelligent Process Automation Market by Component (Solutions and Services), Technology (Natural Language Processing, Machine & Deep Learning, Neural Networks, Virtual Agents, Mini Bots & RPA, Computer Vision and Others), Application (IT Operations, Business Process Automation, Application Management, Content Management, Security and Others), Vertical (BFSI, Telecom & IT, Transport & Logistics, Media & Entertainment, Retail & Ecommerce, Manufacturing, Healthcare & Life Sciences, and Others) and Geography (North America, Europe, APAC and RoW) - Global Forecast to 2026
- November, 2020
- Domain: ICT - digital technologies
- Get Free 10% Customization in this Report
Intelligent process automation (IPA) is an integration of technologies utilized to administer and automate digital processes. IPA can improve operational efficiency, employee performance, and efficiently respond to the consumers. This can also minimize the operational risk of building an effective operations environment. IPA is created to help human workers by performing manual, monotonous, and routine work, which was earlier done by humans. An increase in the adoption of automated processes to modify workplaces accelerates the intelligent process automation market's growth. However, huge implementation costs and compliments in penetration in underdeveloped and below literacy rate regions hinder the market's growth. The Intelligent Process Automation Market growth is projected to grow at a CAGR of 13.10%.
Research Methodology:
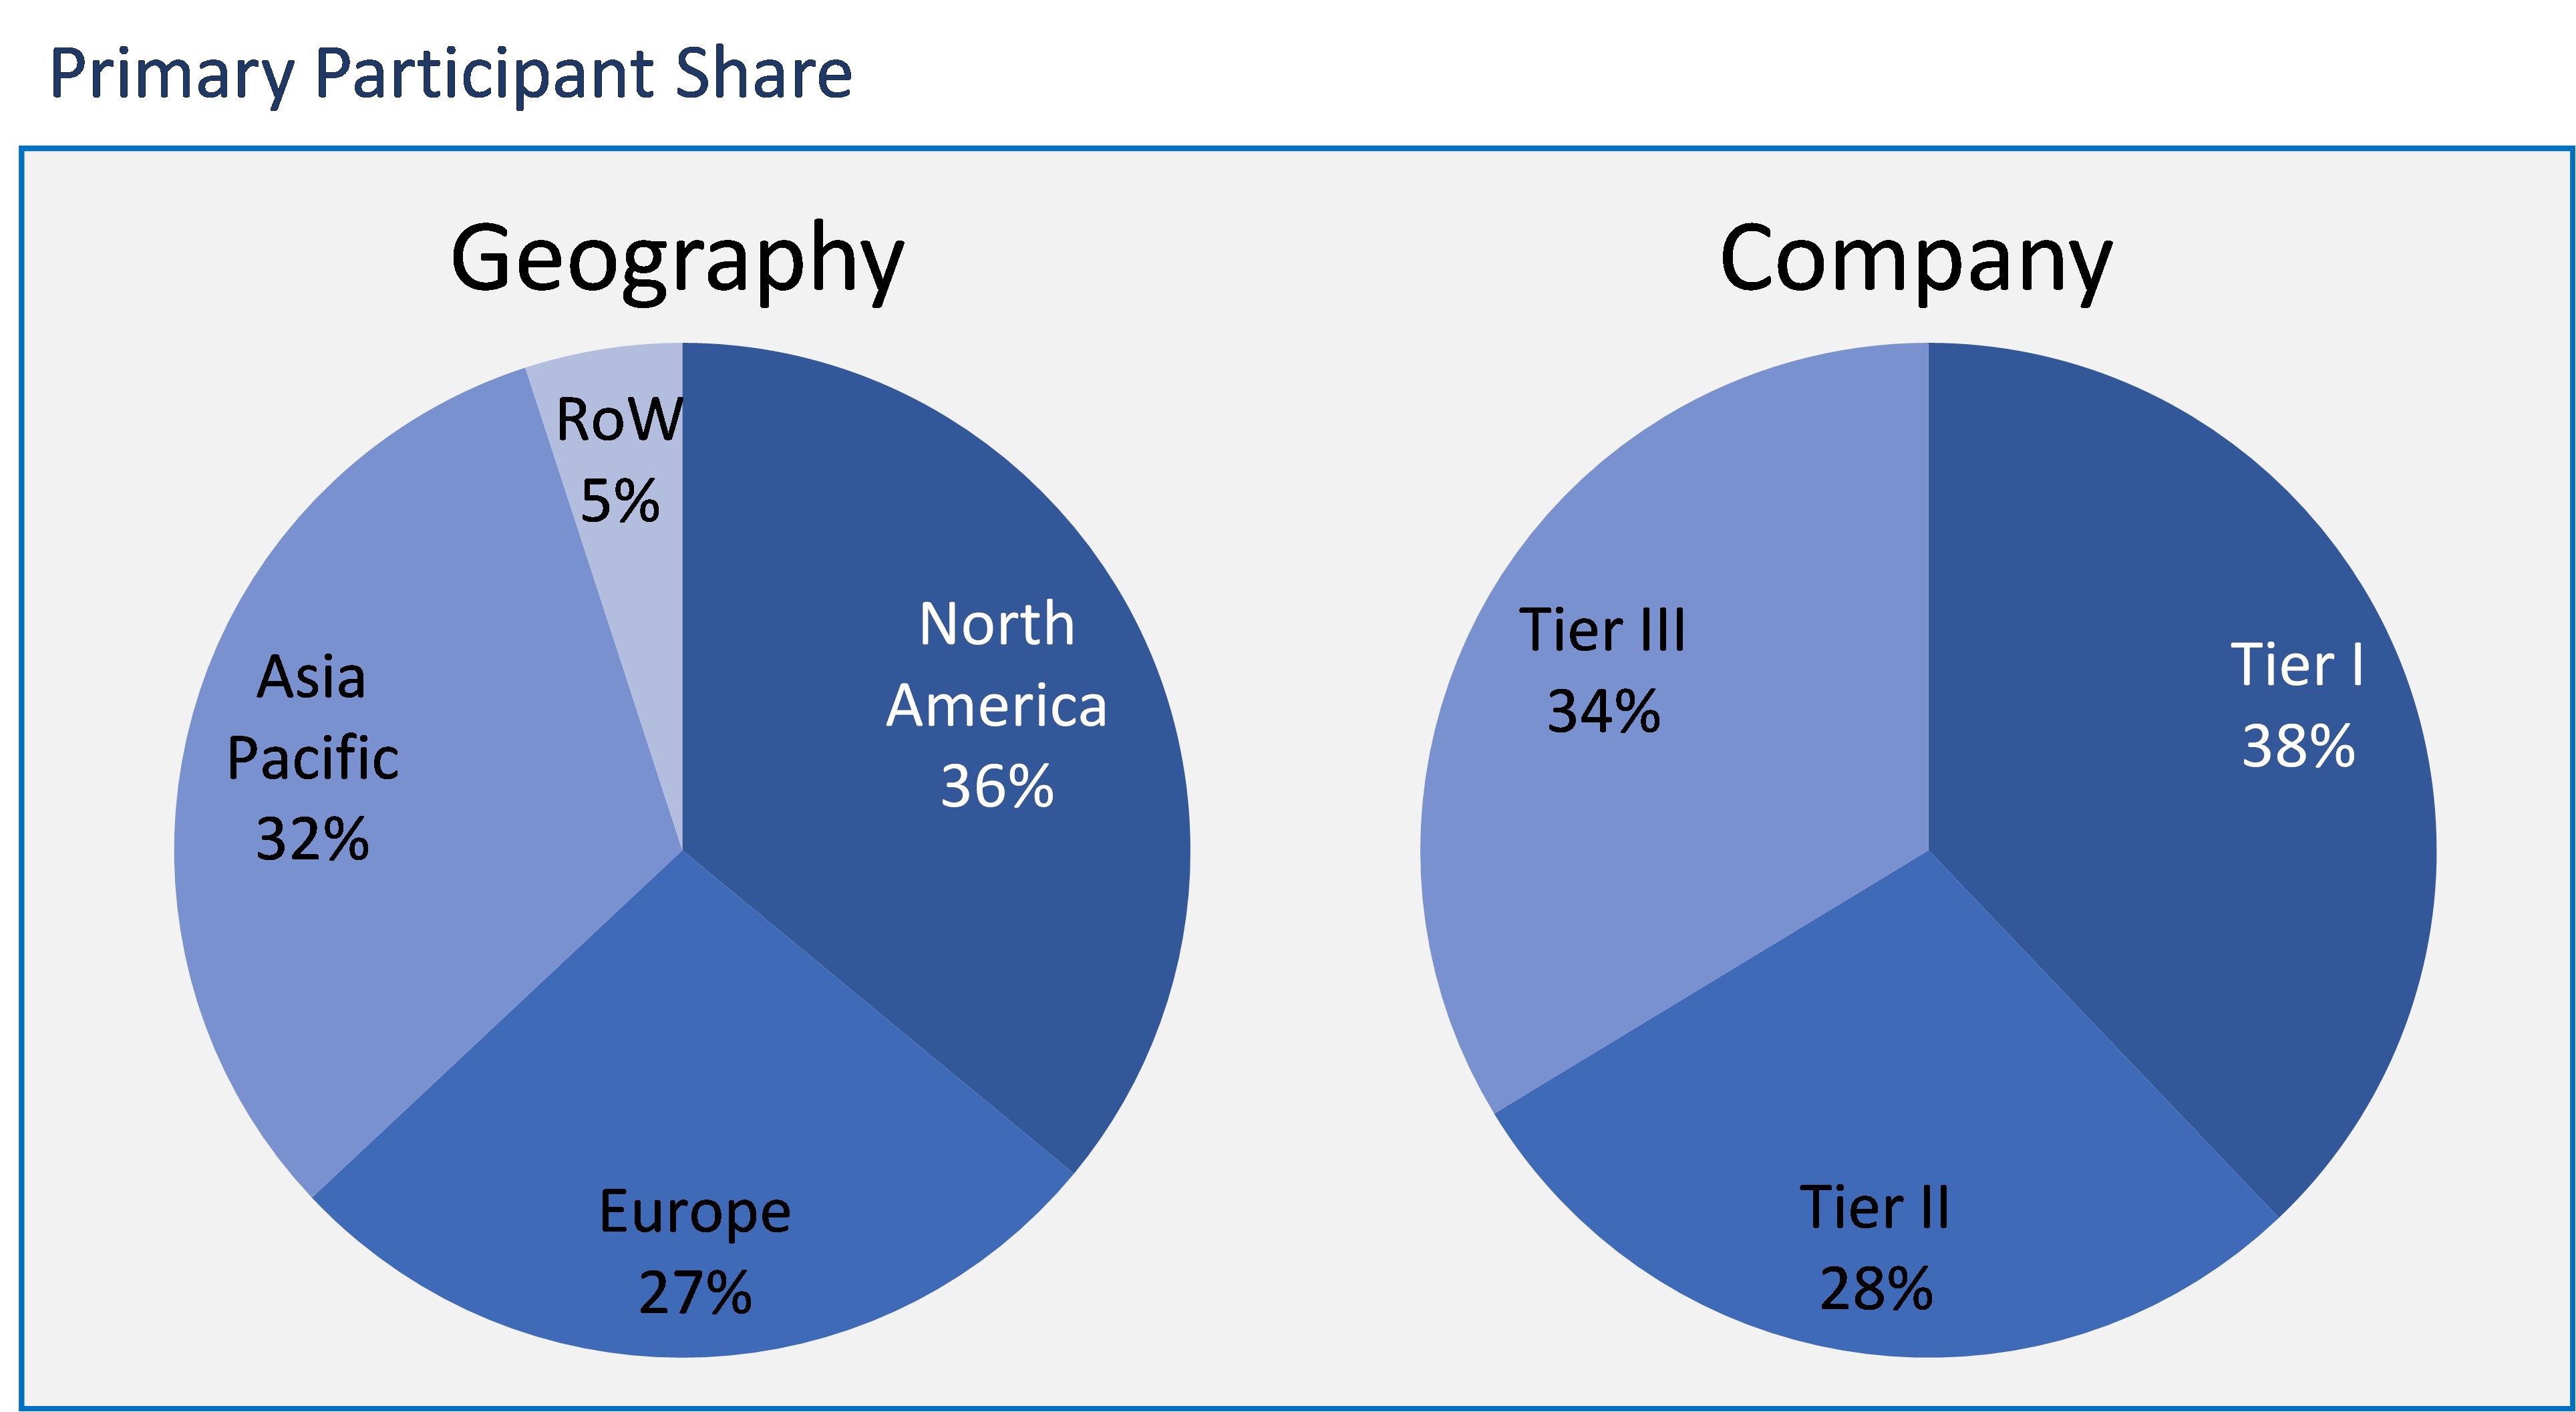
The Intelligent Process Automation market has been assessed by utilizing the optimum combination of secondary sources and in-house methodology, along with an irreplaceable blend of primary insights. The real-time assessment of the market is an integral part of our market sizing and forecasting methodology. Our industry experts and panel of primary participants have helped in compiling relevant aspects with realistic parametric estimations for a comprehensive study. The participation share of different categories of primary participants is given below
Market by Component
- Solutions
- Services
Market by Technology
- Natural Language Processing
- Machine & Deep Learning
- Neural Networks
- Virtual Agents
- Mini Bots & RPA
- Computer Vision
- Others
Market by Application
- IT Operations
- Business Process Automation
- Application Management
- Content Management
- Security
- Others
Market by Vertical
- BFSI
- Telecom & IT
- Transport & Logistics
- Media & Entertainment
- Retail & Ecommerce
- Manufacturing
- Healthcare & Life Sciences
- Others
Market by Geography
- North America
- Europe
- Asia Pacific
- Rest of the World
In the phase of component, the solutions segment is having the maximum share in the market. Since many of the organizations are deploying intelligent process automation solutions to implement automated workflow processes. These solutions allow organizations to remarkably minimize the time and cost involved in business processes.
The machine and deep learning segment have recorded for major share in the market. The major share is ascribed to the significant contribution of machine learning to increase efficiency and improve intelligent automation technologies. Moreover, this technology allows systems to study automatically, and the main intention is to develop computer programs that can access the data and utilize it to learn from it.
According to the application, the IT operations teams are majorly benefited from the deployment of intelligent process automation. These solutions help in IT operations, including teams monitoring and managing IT's lifecycle, enhancing user experience, and minimizing costs. The advantages provided by the intelligent process automation solutions are boosting the adoption of these solutions by the IT operations.
Many of the banks are rapidly deploying intelligent process automation solutions to increase productivity, enhance cost savings, and improve customer experience. Further, intelligent process automation solutions are also employed for better process efficiency and also allow employees to focus on significant projects. The BFSI segment is dominating the market on the basis of vertical segmentation.
Further, the regional market share is majorly acquired by North America. This is due to the increasing penetration of process management and automated solutions in the enterprise. Advanced technologies are being adopted exponentially, which include artificial intelligence, machine learning, and others in organizati0ns to improve business operations.
In the overall world, rapidly establishing industries among developed and developing countries, growing manufacturers preferring process automation for precision, and the need to compress the labor costs are major factors to accelerate market growth. Furthermore, increasing spending on healthcare sector infrastructure from the government in developed countries and increasing deployment of intelligent process automation by hospitals to stimulate cost-savings and avoid human error are some other factors to support the proliferation of the global market.
IBM, Cognizant, Atos, Infosys, HCL Technologies, Capgemini, Xerox Corporation, Pegasystems, Wipro, Accenture, Sutherland Global Services, Symphony Ventures, EXL Service, Thoughtonomy, Tata Consultancy Services, CGI Group, Avanade, Virtual Operations, KPMG, Tech Mahindra, Blue Prism and Syntel. These are the leading companies mentioned in the report.
Automation is transforming business procedures in terms of customer-facing and back-office. Hence, organizations are enormously implementing the IPA all over the world to operate their business cost-effectively. IPA offers several business benefits such as human-robot orchestration, automation of recurring and scheduled tasks, and business ability and propelling the rapidly changing business procedures.
- This report presents the region and segment, which is projected to witness rapid growth also to lead the market.
- The intelligent process automation market report provides a competitive landscape that includes the key players' market share, the introduction of the latest service, partnerships, and business diversification.
- The intelligent process automation market report also provides the leading vendor profiles, which include company overview, company value, and SWOT analysis.
- The present and future market insights into the market in terms of the latest developments and innovations.
- Executive Summary
- Industry Outlook
- Industry Overview
- Industry Trends
- Market Snapshot
- Total Addressable Market
- Segment Addressable Market
- PEST Analysis
- Porter Five Forces
- Related Markets
- Ecosystem
- Market Overview
- Overview
- Market Evolution
- Market Trends and Impact
- Pricing Analysis
- Market Segmentation
- Market Dynamics
- Drivers
- Restraints
- Opportunities
- DRO - Impact Analysis
- Overview
- Component: Market Size & Analysis
- Overview
- Solutions
- Services
- Technology: Market Size & Analysis
- Overview
- Natural Language Processing
- Machine & Deep Learning
- Neural Networks
- Virtual Agents
- Mini Bots & RPA
- Computer Vision
- Others
- Application: Market Size & Analysis
- Overview
- IT Operations
- Business Process Automation
- Application Management
- Content Management
- Security
- Others
- Verticals: Market Size & Analysis
- Overview
- BFSI
- Telecom & IT
- Transport & Logistics
- Media & Entertainment
- Retail & E-COMMERCE
- Manufacturing
- Healthcare & Life Sciences
- Others
- Geography: Market Size & Analysis
- Overview
- North America
- Europe
- Asia Pacific
- Rest of the World
- Competitive Landscape
- Competitor Comparison Analysis
- Market Developments
- Mergers and Acquisitions, Legal, Awards, Partnerships
- Product Launches and execution
- Vendor Profiles
- IBM
- Overview
- Financials
- Products & Services
- Recent Developments
- Cognizant
- Overview
- Financials
- Products & Services
- Recent Developments
- Atos
- Overview
- Financials
- Products & Services
- Recent Developments
- Infosys
- Overview
- Financials
- Products & Services
- Recent Developments
- HCL Technologies
- Overview
- Financials
- Products & Services
- Recent Developments
- Capgemini
- Overview
- Financials
- Products & Services
- Recent Developments
- Xerox Corporation
- Overview
- Financials
- Products & Services
- Recent Developments
- Pegasystems
- Overview
- Financials
- Products & Services
- Recent Developments
- Wipro
- Overview
- Financials
- Products & Services
- Recent Developments
- Accenture
- Overview
- Financials
- Products & Services
- Recent Developments
- IBM
- Companies to Watch
- Sutherland Global Services
- Overview
- Products & Services
- Business Strategy
- Symphony Ventures
- Overview
- Products & Services
- Business Strategy
- EXL Service
- Overview
- Products & Services
- Business Strategy
- Thoughtonomy
- Overview
- Products & Services
- Business Strategy
- Tata Consultancy Services
- Overview
- Products & Services
- Business Strategy
- CGI Group
- Overview
- Products & Services
- Business Strategy
- Avanade
- Overview
- Products & Services
- Business Strategy
- Virtual Operations
- Overview
- Products & Services
- Business Strategy
- KPMG
- Overview
- Products & Services
- Business Strategy
- Tech Mahindra
- Overview
- Products & Services
- Business Strategy
- Blue Prism
- Overview
- Products & Services
- Business Strategy
- Syntel
- Overview
- Products & Services
- Business Strategy
- Sutherland Global Services
- Analyst Opinion
- Annexure
- Report Scope
- Market Definitions
- Research Methodology
- Data Collation and In-house Estimation
- Market Triangulation
- Forecasting
- Report Assumptions
- Declarations
- Stakeholders
- Abbreviations
TABLE 1. GLOBAL INTELLIGENT PROCESS AUTOMATION MARKET VALUE, BY COMPONENT, 2020-2026 (USD BILLION)
TABLE 2. GLOBAL INTELLIGENT PROCESS AUTOMATION MARKET VALUE FOR SOLUTIONS, BY GEOGRAPHY, 2020-2026 (USD BILLION)
TABLE 3. GLOBAL INTELLIGENT PROCESS AUTOMATION MARKET VALUE FOR SERVICES, BY GEOGRAPHY, 2020-2026 (USD BILLION)
TABLE 4. GLOBAL INTELLIGENT PROCESS AUTOMATION MARKET VALUE, BY TECHNOLOGY, 2020-2026 (USD BILLION)
TABLE 5. GLOBAL INTELLIGENT PROCESS AUTOMATION MARKET VALUE FOR NATURAL LANGUAGE PROCESSING, BY GEOGRAPHY, 2020-2026 (USD BILLION)
TABLE 6. GLOBAL INTELLIGENT PROCESS AUTOMATION MARKET VALUE FOR MACHINE & DEEP LEARNING, BY GEOGRAPHY, 2020-2026 (USD BILLION)
TABLE 7. GLOBAL INTELLIGENT PROCESS AUTOMATION MARKET VALUE FOR NEURAL NETWORKS, BY GEOGRAPHY, 2020-2026 (USD BILLION)
TABLE 8. GLOBAL INTELLIGENT PROCESS AUTOMATION MARKET VALUE FOR VIRTUAL AGENTS, BY GEOGRAPHY, 2020-2026 (USD BILLION)
TABLE 9. GLOBAL INTELLIGENT PROCESS AUTOMATION MARKET VALUE FOR MINI BOTS & RPA, BY GEOGRAPHY, 2020-2026 (USD BILLION)
TABLE 10. GLOBAL INTELLIGENT PROCESS AUTOMATION MARKET VALUE FOR COMPUTER VISION, BY GEOGRAPHY, 2020-2026 (USD BILLION)
TABLE 11. GLOBAL INTELLIGENT PROCESS AUTOMATION MARKET VALUE FOR OTHERS, BY GEOGRAPHY, 2020-2026 (USD BILLION)
TABLE 12. GLOBAL INTELLIGENT PROCESS AUTOMATION MARKET VALUE, BY APPLICATION, 2020-2026 (USD BILLION)
TABLE 13. GLOBAL INTELLIGENT PROCESS AUTOMATION MARKET VALUE FOR IT OPERATIONS, 2020-2026 (USD BILLION)
TABLE 14. GLOBAL INTELLIGENT PROCESS AUTOMATION MARKET VALUE FOR BUSINESS PROCESS AUTOMATION, 2020-2026 (USD BILLION)
TABLE 15. GLOBAL INTELLIGENT PROCESS AUTOMATION MARKET VALUE FOR APPLICATION MANAGEMENT, 2020-2026 (USD BILLION)
TABLE 16. GLOBAL INTELLIGENT PROCESS AUTOMATION MARKET VALUE FOR CONTENT MANAGEMENT, 2020-2026 (USD BILLION)
TABLE 17. GLOBAL INTELLIGENT PROCESS AUTOMATION MARKET VALUE FOR SECURITY, 2020-2026 (USD BILLION)
TABLE 18. GLOBAL INTELLIGENT PROCESS AUTOMATION MARKET VALUE FOR OTHERS, 2020-2026 (USD BILLION)
TABLE 19. GLOBAL INTELLIGENT PROCESS AUTOMATION MARKET VALUE FOR VERTICALS, BY GEOGRAPHY, 2020-2026 (USD BILLION)
TABLE 20. GLOBAL INTELLIGENT PROCESS AUTOMATION MARKET VALUE FOR BFSI, BY GEOGRAPHY, 2020-2026 (USD BILLION)
TABLE 21. GLOBAL INTELLIGENT PROCESS AUTOMATION MARKET VALUE FOR TELECOM & IT, BY GEOGRAPHY, 2020-2026 (USD BILLION)
TABLE 22. GLOBAL INTELLIGENT PROCESS AUTOMATION MARKET VALUE FOR TRANSPORT & LOGISTICS, BY GEOGRAPHY, 2020-2026 (USD BILLION)
TABLE 23. GLOBAL INTELLIGENT PROCESS AUTOMATION MARKET VALUE FOR MEDIA & ENTERTAINMENT, BY GEOGRAPHY, 2020-2026 (USD BILLION)
TABLE 24. GLOBAL INTELLIGENT PROCESS AUTOMATION MARKET VALUE FOR RETAIL & E-COMMERCE, BY GEOGRAPHY, 2020-2026 (USD BILLION)
TABLE 25. GLOBAL INTELLIGENT PROCESS AUTOMATION MARKET VALUE FOR MANUFACTURING, BY GEOGRAPHY, 2020-2026 (USD BILLION)
TABLE 26. GLOBAL INTELLIGENT PROCESS AUTOMATION MARKET VALUE FOR HEALTHCARE & LIFE SCIENCES, BY GEOGRAPHY, 2020-2026 (USD BILLION)
TABLE 27. GLOBAL INTELLIGENT PROCESS AUTOMATION MARKET VALUE FOR OTHERS, BY GEOGRAPHY, 2020-2026 (USD BILLION)
TABLE 28. NORTH AMERICA INTELLIGENT PROCESS AUTOMATION MARKET VALUE, BY COUNTRY, 2020-2026 (USD BILLION)
TABLE 29. NORTH AMERICA INTELLIGENT PROCESS AUTOMATION MARKET VALUE, BY COMPONENT, 2020-2026 (USD BILLION)
TABLE 30. NORTH AMERICA INTELLIGENT PROCESS AUTOMATION MARKET VALUE, BY TECHNOLOGY, 2020-2026 (USD BILLION)
TABLE 31. NORTH AMERICA INTELLIGENT PROCESS AUTOMATION MARKET VALUE, BY APPLICATION, 2020-2026 (USD BILLION)
TABLE 32. NORTH AMERICA INTELLIGENT PROCESS AUTOMATION MARKET VALUE, BY VERTICALS, 2020-2026 (USD BILLION)
TABLE 33. U.S INTELLIGENT PROCESS AUTOMATION MARKET VALUE, BY APPLICATION, 2020-2026 (USD BILLION)
TABLE 34. U.S INTELLIGENT PROCESS AUTOMATION MARKET VALUE, BY VERTICALS, 2020-2026 (USD BILLION)
TABLE 35. CANADA INTELLIGENT PROCESS AUTOMATION MARKET VALUE, BY APPLICATION, 2020-2026 (USD BILLION)
TABLE 36. CANADA INTELLIGENT PROCESS AUTOMATION MARKET VALUE, BY VERTICALS, 2020-2026 (USD BILLION)
TABLE 37. EUROPE INTELLIGENT PROCESS AUTOMATION MARKET VALUE, BY COUNTRY, 2020-2026 (USD BILLION)
TABLE 38. EUROPE INTELLIGENT PROCESS AUTOMATION MARKET VALUE, BY COMPONENT, 2020-2026 (USD BILLION)
TABLE 39. EUROPE INTELLIGENT PROCESS AUTOMATION MARKET VALUE, BY TECHNOLOGY, 2020-2026 (USD BILLION)
TABLE 40. EUROPE INTELLIGENT PROCESS AUTOMATION MARKET VALUE, BY APPLICATION, 2020-2026 (USD BILLION)
TABLE 41. EUROPE INTELLIGENT PROCESS AUTOMATION MARKET VALUE, BY VERTICALS, 2020-2026 (USD BILLION)
TABLE 42. GERMANY INTELLIGENT PROCESS AUTOMATION MARKET VALUE, BY APPLICATION, 2020-2026 (USD BILLION)
TABLE 43. GERMANY INTELLIGENT PROCESS AUTOMATION MARKET VALUE, BY VERTICALS, 2020-2026 (USD BILLION)
TABLE 44. U.K INTELLIGENT PROCESS AUTOMATION MARKET VALUE, BY APPLICATION, 2020-2026 (USD BILLION)
TABLE 45. U.K INTELLIGENT PROCESS AUTOMATION MARKET VALUE, BY VERTICALS, 2020-2026 (USD BILLION)
TABLE 46. FRANCE INTELLIGENT PROCESS AUTOMATION MARKET VALUE, BY APPLICATION, 2020-2026 (USD BILLION)
TABLE 47. FRANCE INTELLIGENT PROCESS AUTOMATION MARKET VALUE, BY VERTICALS, 2020-2026 (USD BILLION)
TABLE 48. ITALY INTELLIGENT PROCESS AUTOMATION MARKET VALUE, BY APPLICATION, 2020-2026 (USD BILLION)
TABLE 49. ITALY INTELLIGENT PROCESS AUTOMATION MARKET VALUE, BY VERTICALS, 2020-2026 (USD BILLION)
TABLE 50. SPAIN INTELLIGENT PROCESS AUTOMATION MARKET VALUE, BY APPLICATION, 2020-2026 (USD BILLION)
TABLE 51. SPAIN INTELLIGENT PROCESS AUTOMATION MARKET VALUE, BY VERTICALS, 2020-2026 (USD BILLION)
TABLE 52. ROE INTELLIGENT PROCESS AUTOMATION MARKET VALUE, BY APPLICATION, 2020-2026 (USD BILLION)
TABLE 53. ROE INTELLIGENT PROCESS AUTOMATION MARKET VALUE, BY VERTICALS, 2020-2026 (USD BILLION)
TABLE 54. ASIA PACIFC INTELLIGENT PROCESS AUTOMATION MARKET VALUE, BY COUNTRY, 2020-2026 (USD BILLION)
TABLE 55. ASIA PACIFC INTELLIGENT PROCESS AUTOMATION MARKET VALUE, BY COMPONENT, 2020-2026 (USD BILLION)
TABLE 56. ASIA PACIFC INTELLIGENT PROCESS AUTOMATION MARKET VALUE, BY TECHNOLOGY, 2020-2026 (USD BILLION)
TABLE 57. ASIA PACIFC INTELLIGENT PROCESS AUTOMATION MARKET VALUE, BY APPLICATION, 2020-2026 (USD BILLION)
TABLE 58. ASIA PACIFC INTELLIGENT PROCESS AUTOMATION MARKET VALUE, BY VERTICALS, 2020-2026 (USD BILLION)
TABLE 59. CHINA INTELLIGENT PROCESS AUTOMATION MARKET VALUE, BY APPLICATION, 2020-2026 (USD BILLION)
TABLE 60. CHINA INTELLIGENT PROCESS AUTOMATION MARKET VALUE, BY VERTICALS, 2020-2026 (USD BILLION)
TABLE 61. INDIA INTELLIGENT PROCESS AUTOMATION MARKET VALUE, BY APPLICATION, 2020-2026 (USD BILLION)
TABLE 62. INDIA INTELLIGENT PROCESS AUTOMATION MARKET VALUE, BY VERTICALS, 2020-2026 (USD BILLION)
TABLE 63. JAPAN INTELLIGENT PROCESS AUTOMATION MARKET VALUE, BY APPLICATION, 2020-2026 (USD BILLION)
TABLE 64. JAPAN INTELLIGENT PROCESS AUTOMATION MARKET VALUE, BY VERTICALS, 2020-2026 (USD BILLION)
TABLE 65. REST OF APAC INTELLIGENT PROCESS AUTOMATION MARKET VALUE, BY APPLICATION, 2020-2026 (USD BILLION)
TABLE 66. REST OF APAC INTELLIGENT PROCESS AUTOMATION MARKET VALUE, BY VERTICALS, 2020-2026 (USD BILLION)
TABLE 67. REST OF WORLD INTELLIGENT PROCESS AUTOMATION MARKET VALUE, BY COMPONENT, 2020-2026 (USD BILLION)
TABLE 68. REST OF WORLD INTELLIGENT PROCESS AUTOMATION MARKET VALUE, BY TECHNOLOGY, 2020-2026 (USD BILLION)
TABLE 69. REST OF WORLD INTELLIGENT PROCESS AUTOMATION MARKET VALUE, BY APPLICATION, 2020-2026 (USD BILLION)
TABLE 70. REST OF WORLD INTELLIGENT PROCESS AUTOMATION MARKET VALUE, BY VERTICALS, 2020-2026 (USD BILLION)
TABLE 71. IBM: FINANCIALS
TABLE 72. IBM: PRODUCTS/SERVICES
TABLE 73. IBM: RECENT DEVELOPMENTS
TABLE 74. COGNIZANT: FINANCIALS
TABLE 75. COGNIZANT: PRODUCTS/SERVICES
TABLE 76. COGNIZANT: RECENT DEVELOPMENTS
TABLE 77. ATOS: FINANCIALS
TABLE 78. ATOS: PRODUCTS/SERVICES
TABLE 79. ATOS: RECENT DEVELOPMENTS
TABLE 80. INFOSYS: FINANCIALS
TABLE 81. INFOSYS: PRODUCTS/SERVICES
TABLE 82. INFOSYS: RECENT DEVELOPMENTS
TABLE 83. HCL TECHNOLOGIES: FINANCIALS
TABLE 84. HCL TECHNOLOGIES: PRODUCTS/SERVICES
TABLE 85. HCL TECHNOLOGIES: RECENT DEVELOPMENTS
TABLE 86. CAPGEMINI: FINANCIALS
TABLE 87. CAPGEMINI: PRODUCTS/SERVICES
TABLE 88. CAPGEMINI: RECENT DEVELOPMENTS
TABLE 89. XEROX CORPORATION: FINANCIALS
TABLE 90. XEROX CORPORATION: PRODUCTS/SERVICES
TABLE 91. XEROX CORPORATION: RECENT DEVELOPMENTS
TABLE 92. PEGASYSTEMS: FINANCIALS
TABLE 93. PEGASYSTEMS: PRODUCTS/SERVICES
TABLE 94. PEGASYSTEMS: RECENT DEVELOPMENTS
TABLE 95. WIPRO: FINANCIALS
TABLE 96. WIPRO: PRODUCTS/SERVICES
TABLE 97. WIPRO: RECENT DEVELOPMENTS
TABLE 98. ACCENTURE: FINANCIALS
TABLE 99. ACCENTURE: PRODUCTS/SERVICES
TABLE 100. ACCENTURE: RECENT DEVELOPMENTS
TABLE 101. SUTHERLAND GLOBAL SERVICES: FINANCIALS
TABLE 102. SUTHERLAND GLOBAL SERVICES: PRODUCTS/SERVICES
TABLE 103. SUTHERLAND GLOBAL SERVICES: RECENT DEVELOPMENTS
TABLE 104. SYMPHONY VENTURES: FINANCIALS
TABLE 105. SYMPHONY VENTURES: PRODUCTS/SERVICES
TABLE 106. SYMPHONY VENTURES: RECENT DEVELOPMENTS
TABLE 107. EXL SERVICE: FINANCIALS
TABLE 108. EXL SERVICE: PRODUCTS/SERVICES
TABLE 109. EXL SERVICE: RECENT DEVELOPMENTS
TABLE 110. THOUGHTONOMY: FINANCIALS
TABLE 111. THOUGHTONOMY: PRODUCTS/SERVICES
TABLE 112. THOUGHTONOMY: RECENT DEVELOPMENTS
TABLE 113. TATA CONSULTANCY SERVICES: FINANCIALS
TABLE 114. TATA CONSULTANCY SERVICES: PRODUCTS/SERVICES
TABLE 115. TATA CONSULTANCY SERVICES: RECENT DEVELOPMENTS
TABLE 116. CGI GROUP: FINANCIALS
TABLE 117. CGI GROUP: PRODUCTS/SERVICES
TABLE 118. CGI GROUP: RECENT DEVELOPMENTS
TABLE 119. AVANADE: FINANCIALS
TABLE 120. AVANADE: PRODUCTS/SERVICES
TABLE 121. AVANADE: RECENT DEVELOPMENTS
TABLE 122. VIRTUAL OPERATIONS: FINANCIALS
TABLE 123. VIRTUAL OPERATIONS: PRODUCTS/SERVICES
TABLE 124. VIRTUAL OPERATIONS: RECENT DEVELOPMENTS
TABLE 125. KPMG: FINANCIALS
TABLE 126. KPMG: PRODUCTS/SERVICES
TABLE 127. KPMG: RECENT DEVELOPMENTS
TABLE 128. TECH MAHINDRA: FINANCIALS
TABLE 129. TECH MAHINDRA: PRODUCTS/SERVICES
TABLE 130. TECH MAHINDRA: RECENT DEVELOPMENTS
TABLE 131. BLUE PRISM: FINANCIALS
TABLE 132. BLUE PRISM: PRODUCTS/SERVICES
TABLE 133. BLUE PRISM: RECENT DEVELOPMENTS
TABLE 134. SYNTEL: FINANCIALS
TABLE 135. SYNTEL: PRODUCTS/SERVICES
TABLE 136. SYNTEL: RECENT DEVELOPMENTS
Research Framework
Infoholic Research works on a holistic 360° approach in order to deliver high quality, validated and reliable information in our market reports. The Market estimation and forecasting involves following steps:
- Data Collation (Primary & Secondary)
- In-house Estimation (Based on proprietary data bases and Models)
- Market Triangulation
- Forecasting

Market related information is congregated from both primary and secondary sources.
Primary sources
Involved participants from all global stakeholders such as Solution providers, service providers, Industry associations, thought leaders etc. across levels such as CXOs, VPs and managers. Plus, our in-house industry experts having decades of industry experience contribute their consulting and advisory services.
Secondary sources
Include public sources such as regulatory frameworks, government IT spending, government demographic indicators, industry association statistics, and company publications along with paid sources such as Factiva, OneSource, Bloomberg among others.
![]()


