
In Vitro Diagnostic Quality Control Market By: Product (Quality Control Products, Serum/Plasma-Based Controls, Whole Blood-Based Controls, Urine-Based Controls, Other Source-Based IVD Quality Controls, Data Management Solutions, and Quality Assurance Services), Manufacturer (Third Party Controls, Independent Controls, Instrument-Specific Control and Original Equipment Manufacturer Controls), Application (Clinical chemistry, Immunochemistry, Hematology, Coagulation & Hemostasis, Microbiology, Molecular Diagnostics and Other Applications), End-User (Hospitals, Clinical Laboratories, Academic & Research Institutes, and Other End Users), Geography (North America, Europe, APAC, and RoW)– Forecast up to 2026
- July, 2020
- Domain: Healthcare - Diagnostics
- Get Free 10% Customization in this Report
In Vitro Diagnostic is the test done on the blood or tissue samples taken from the body. The in vitro diagnostic quality controls are samples used to check the reliability of the in vitro diagnostic testing system to validate the accuracy of the test results. These quality controls also evaluate the impact of the various factors including environmental conditions and operator’s performance on test results. As a result of this the In Vitro Diagnostic Quality Control market is attributed to control the accuracy of the test laboratories, clinical laboratories and pathology labs where the tests are done.
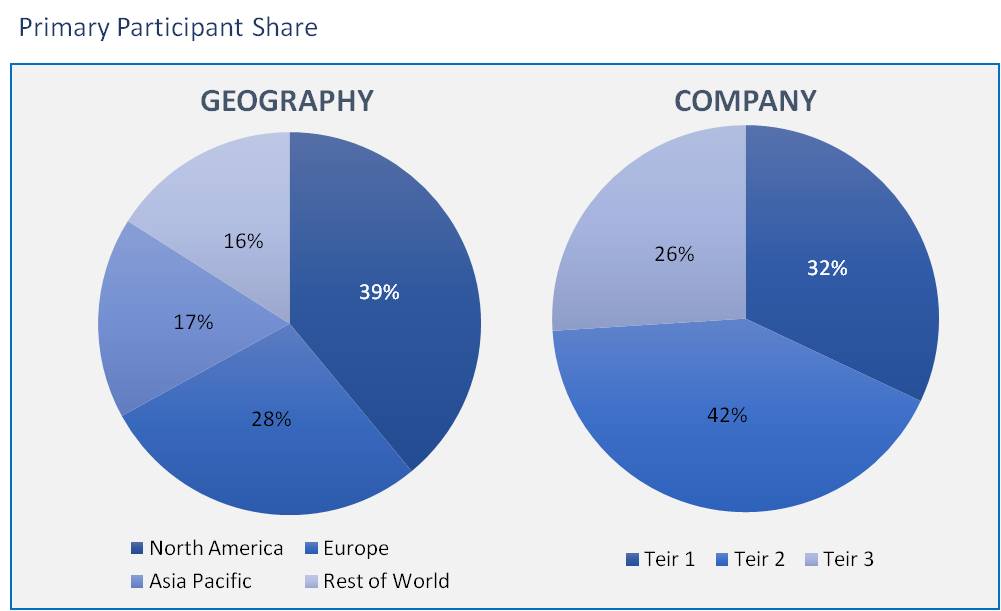
The in-vitro diagnostic quality control market has been analyzed by utilizing the optimum combination of secondary sources and in-house methodology, along with an irreplaceable blend of primary insights. The real-time assessment of the market is an integral part of our market sizing and forecasting methodology. Our industry experts and panel of primary participants have helped in compiling relevant aspects with realistic parametric estimations for a comprehensive study. The participation share of different categories of primary participants is given below:
The rise in these accredited clinical laboratories is driving the market growth. Further, the adoption of the third-party quality controls, rapid increase in the chronic and infectious diseases are other major drivers for the market. The increase in demand of multi analyte controls gives the opportunity the vendors to fulfil the end-user demand. The In Vitro Diagnostic Quality Control Market is expected to reach USD 1,220 million by 2026 from an estimated value of USD 999.44 million in 2020, growing at a CAGR of ~3.38% during the forecast period.
The In Vitro Diagnostic Quality Control market has segmented based on product and service, manufacturer, application, end user and region.
Product based segmentation:
- Quality Control Products
- Serum/Plasma-Based Controls
- Whole Blood-Based Controls
- Urine-Based Controls
- Other Controls
- Quality Assurance Services
- Data Management Solutions
Manufacturer based segmentation:
- Third-Party Controls
- Independent Controls
- Instrument-Specific Controls
- Original Equipment Manufacturer Controls
Application based segmentation:
- Clinical chemistry
- Immunochemistry
- Hematology
- Coagulation & Hemostasis
- Microbiology
- Molecular Diagnostics
- Other Applications
End-User based segmentation:
- Hospitals
- Clinical Laboratories
- Academic and Research Institutes
- Other End Users
Region based segmentation:
- North America
- Europe
- APAC
- RoW
In the application segmentation immunochemistry plays a major role in the growth of the market. The demand for this segment is attributed to the increased utilization of the multi-analyte controls to perform immunoassay tests in the labs. Thus, the immunochemistry has been taking the largest market share in the forecast period.
In product and services segment the Quality Assurance Services market growing at a highest growth rate due to increasing need of performance assessment in clinical laboratories. The quality control products segment accounted largest market share in In Vitro Diagnostic Quality Control market due to increasing demand for serum/plasma-based controls for stability and accuracy of test result.
Further, the market segmentation is based on manufacturer - it is divided into third party controls and original equipment manufacturer controls. The third-party controls segment accounted largest share in the market due to the unbiased test results. This results in the high rise in the demand of the third-party controls products in the market.
Based on the end-users the market is divided into hospitals, academic and research institutes and other end-users. The hospitals have the prominent role in the in vitro diagnostic quality control growth rate due to the increasing amount of IVD procedures in the hospitals. Clinical laboratories are also expected to increase the demand for In Vitro Diagnostic Quality Control products.
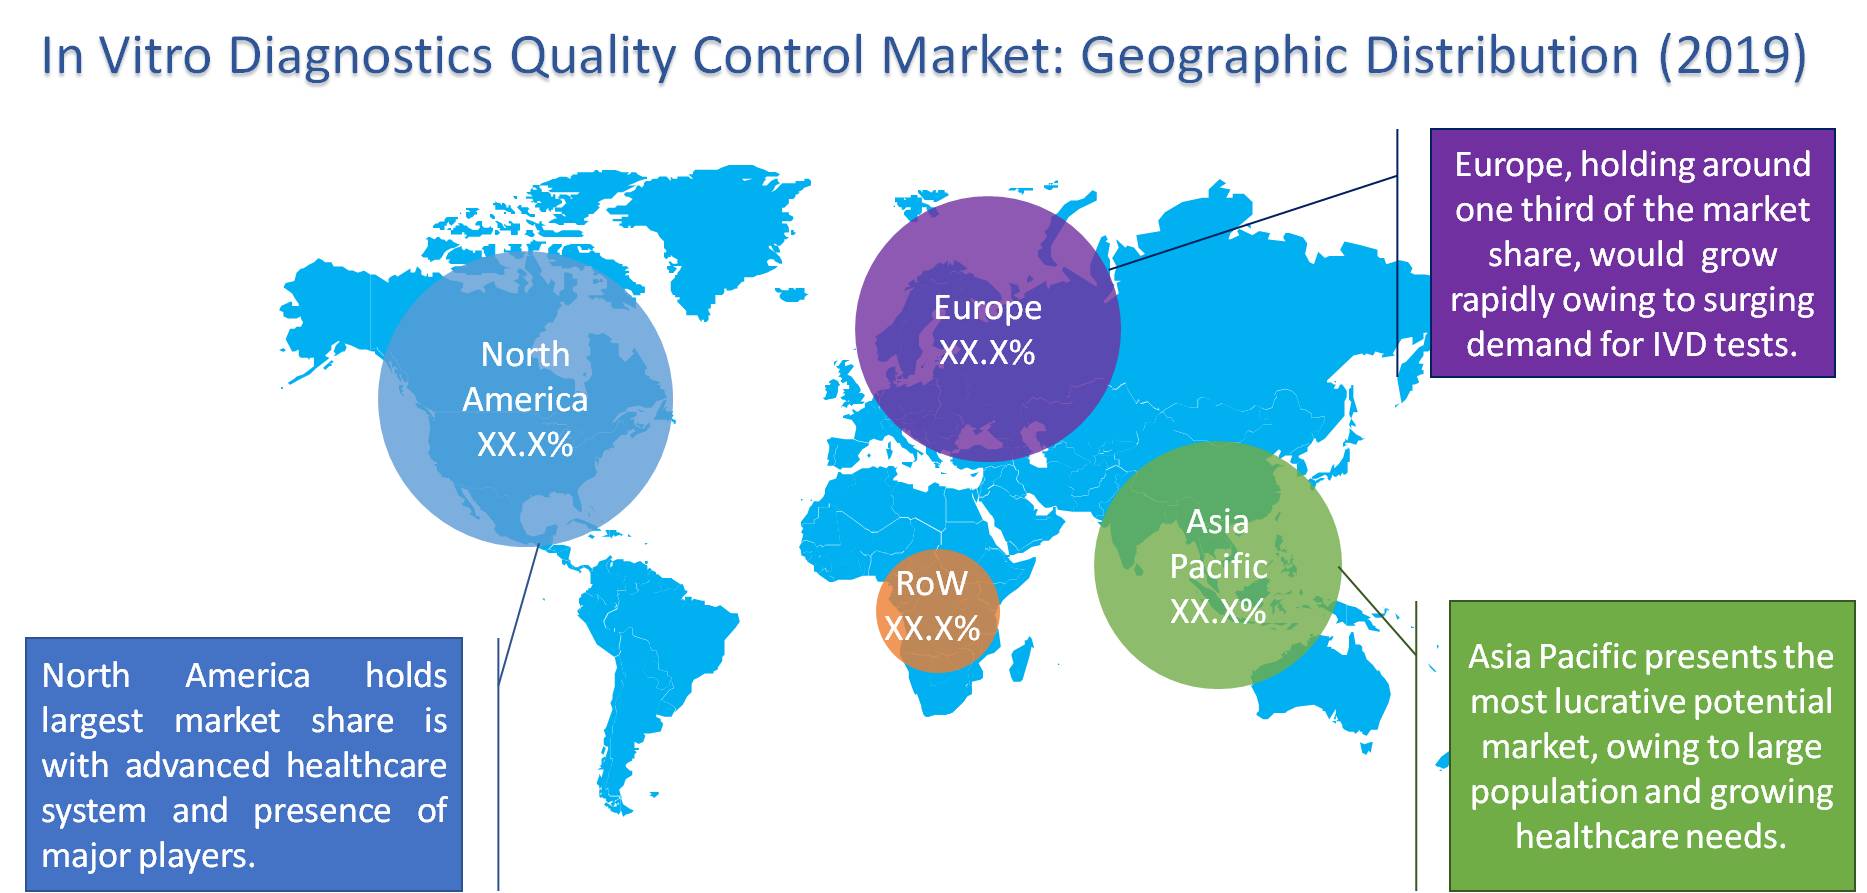
As per the regional analysis, North America has the largest share in the global In Vitro Diagnostic Quality Control due to the factors such as increasing IVD procedures, growing awareness of the ensured and accurate test results, in addition to these the increased adoption of the third-party controls also fuel the demand for In Vitro Diagnostic Quality Control products and services.
Globally the In Vitro Diagnostic Quality Control market has been expanding its growth – the factors which are driving this market are the increasing awareness of the ensured and accurate test results, scenario of the increased chronic and infectious diseases where the accurate test is needed to cure, treat and prevent the disease. The rise in the demand of the multi-analyte controls gives the opportunity to the in vitro diagnostic quality control.
The high cost of the quality control process hinders the demand for In Vitro Diagnostic Quality products and services. Strict rules for product approval procedure and the lack of regulations for clinical laboratory accreditation in developing countries are major challenges in the market.
The key competitors in the In Vitro Diagnostic Quality market are Thermo Fisher Scientific Inc., Bio-Rad Laboratories Inc., Technopath Clinical Diagnostics, Randox Laboratories Ltd., Bio-Techne Corporation, Danaher Corporation, SeraCare Life Sciences Inc., Roche Diagnostics, Sysmex Corporation, Fortress Diagnostics, Helena Laboratories, Siemens Healthineers, Abbott Laboratories Inc., Helena Laboratories, and Diagnostics, Inc.
This report analysis helps the vendors in the market to know the current trends, dynamics and opportunities of the market and needs of the end-users. The qualitative and quantitative analysis enhances the user experience of the report.
- The competitive analysis of the major players enables users to understand the dynamic strategies such as product innovation, partnerships, merger & acquisitions and joint ventures of the key players
- This report also provides the SWOT analysis, portfolio analysis, capability analysis of the leading players
- The report will also help the research organization of In Vitro Diagnostic Quality to support their development activities
- Quantitative analysis of the market enables users to understand the actual facts of the market across four major regions
1. Executive Summary
2. Industry Outlook
2.1. Industry Overview
2.2. Industry Trends
3. Market Snapshot
3.1. Market Definition
3.2. Market Outlook
3.3. PEST Analysis
3.4. Porter Five Forces
3.5. Related Markets
4. Market characteristics
4.1. Market Evolution
4.2. Market Trends and Impact
4.3. Advantages/Disadvantages of Market
4.4. Regulatory Impact
4.5. Market Offerings
4.6. Market Segmentation
4.7. Market Dynamics
4.7.1. Drivers
4.7.2. Restraints
4.7.3. Opportunities
4.8. DRO - Impact Analysis
5. Product: Market Size & Analysis
5.1. Overview
5.2. Quality Control Products
5.3. Serum/Plasma-Based Controls
5.4. Whole Blood-Based Controls
5.5. Urine-Based Controls
5.6. Other Source-Based IVD Quality Controls
5.7. Data Management Solutions
5.8. Quality Assurance Services
6. Application: Market Size & Analysis
6.1. Overview
6.2. Immunochemistry/Immunoassay
6.3. Clinical Chemistry
6.4. Hematology
6.5. Molecular Diagnostics
6.6. Coagulation & Hemostasis
6.7. Microbiology
6.8. Other Applications
7. Manufacturer: Market Size & Analysis
7.1. Overview
7.2. Third-Party Control Manufacturers
7.3. Independent Controls
7.4. Instrument-Specific Controls
7.5. Original Equipment Manufacturers
8. End User: Market Size & Analysis
8.1. Overview
8.2. Hospitals
8.3. Clinical Laboratories
8.4. Academic & Research Institutes
8.5. Other End Users
9. Geography: Market Size & Analysis
9.1. Overview
9.2. North America
9.3. Europe
9.4. Asia Pacific
9.5. Rest of the World
10. Competitive Landscape
10.1. Competitor Comparison Analysis
10.2. Market Developments
10.3. Mergers and Acquisitions, Legal, Awards, Partnerships
10.4. Product Launches and execution
11. Vendor Profiles
11.1. Sun Diagnostics
11.1.1. Overview
11.1.2. Product Offerings
11.1.3. Geographic Revenue
11.1.4. Business Units
11.1.5. Developments
11.1.6. SWOT Analysis
11.1.7. Business Strategy
11.2. Quidel Corporation
11.2.1. Overview
11.2.2. Product Offerings
11.2.3. Geographic Revenue
11.2.4. Business Units
11.2.5. Developments
11.2.6. SWOT Analysis
11.2.7. Business Strategy
11.3. Technopath Clinical Diagnostics
11.3.1. Overview
11.3.2. Product Offerings
11.3.3. Geographic Revenue
11.3.4. Business Units
11.3.5. Developments
11.3.6. SWOT Analysis
11.3.7. Business Strategy
11.4. Danaher Corporation
11.4.1. Overview
11.4.2. Product Offerings
11.4.3. Geographic Revenue
11.4.4. Business Units
11.4.5. Developments
11.4.6. SWOT Analysis
11.4.7. Business Strategy
11.5. Abbott Laboratories Inc
11.5.1. Overview
11.5.2. Product Offerings
11.5.3. Geographic Revenue
11.5.4. Business Units
11.5.5. Developments
11.5.6. SWOT Analysis
11.5.7. Business Strategy
11.6. Sysmex Corporation
11.6.1. Overview
11.6.2. Product Offerings
11.6.3. Geographic Revenue
11.6.4. Business Units
11.6.5. Developments
11.6.6. SWOT Analysis
11.6.7. Business Strategy
11.7. Siemens Healthineers
11.7.1. Overview
11.7.2. Product Offerings
11.7.3. Geographic Revenue
11.7.4. Business Units
11.7.5. Developments
11.7.6. SWOT Analysis
11.7.7. Business Strategy
11.8. Fortress Diagnostics
11.8.1. Overview
11.8.2. Product Offerings
11.8.3. Geographic Revenue
11.8.4. Business Units
11.8.5. Developments
11.8.6. SWOT Analysis
11.8.7. Business Strategy
11.9. Zeptometrix Corporation
11.9.1. Overview
11.9.2. Product Offerings
11.9.3. Geographic Revenue
11.9.4. Business Units
11.9.5. Developments
11.9.6. SWOT Analysis
11.9.7. Business Strategy
11.10. Qnostics
11.10.1. Overview
11.10.2. Product Offerings
11.10.3. Geographic Revenue
11.10.4. Business Units
11.10.5. Developments
11.10.6. SWOT Analysis
11.10.7. Business Strategy
12. Companies to Watch
12.1. Bio-Techne Corporation
12.1.1. Overview
12.1.2. Market
12.1.3. Business Strategy
12.2. Microbiologics
12.2.1. Overview
12.2.2. Market
12.2.3. Business Strategy
12.3. Bio-Rad Laboratories
12.3.1. Overview
12.3.2. Market
12.3.3. Business Strategy
12.4. Randox Laboratories
12.4.1. Overview
12.4.2. Market
12.4.3. Business Strategy
12.5. Thermo Fisher Scientific
12.5.1. Overview
12.5.2. Market
12.5.3. Business Strategy
12.6. Roche Diagnostics
12.6.1. Overview
12.6.2. Market
12.6.3. Business Strategy
12.7. Helena Laboratories
12.7.1. Overview
12.7.2. Market
12.7.3. Business Strategy
12.8. SeraCare Life Sciences
12.8.1. Overview
12.8.2. Market
12.8.3. Business Strategy
12.9. SERO AS
12.9.1. Overview
12.9.2. Market
12.9.3. Business Strategy
12.10. Ortho Clinical Diagnostics
12.10.1. Overview
12.10.2. Market
12.10.3. Business Strategy
13. Analyst Opinion
14. Annexure
14.1. Report Scope
14.2. Market Definitions
14.3. Research Methodology
14.3.1. Data Collation and In-house Estimation
14.3.2. Market Triangulation
14.3.3. Forecasting
14.4. Report Assumptions
14.5. Declarations
14.6. Stakeholders
14.7. Abbreviations
TABLE 1. GLOBAL IN VITRO DIAGNOSTICS QUALITY CONTROL MARKET VALUE, BY PRODUCT, 2020-2026 (USD MILLION)
TABLE 2. GLOBAL IN VITRO DIAGNOSTICS QUALITY CONTROL MARKET VALUE FOR QUALITY CONTROL PRODUCTS MARKET, BY GEOGRAPHY, 2020-2026 (USD MILLION)
TABLE 3. GLOBAL IN VITRO DIAGNOSTICS QUALITY CONTROL MARKET VALUE FOR SERUM/PLASMA-BASED CONTROLS, BY GEOGRAPHY, 2020-2026 (USD MILLION)
TABLE 4. GLOBAL IN VITRO DIAGNOSTICS QUALITY CONTROL MARKET VALUE FOR WHOLE BLOOD-BASED CONTROLS, BY GEOGRAPHY, 2020-2026 (USD MILLION)
TABLE 5. GLOBAL IN VITRO DIAGNOSTICS QUALITY CONTROL MARKET VALUE FOR URINE-BASED CONTROLS, BY GEOGRAPHY, 2020-2026 (USD MILLION)
TABLE 6. GLOBAL IN VITRO DIAGNOSTICS QUALITY CONTROL MARKET VALUE FOR OTHER SOURCE-BASED IVD QUALITY CONTROLS, BY GEOGRAPHY, 2020-2026 (USD MILLION)
TABLE 7. GLOBAL IN VITRO DIAGNOSTICS QUALITY CONTROL MARKET VALUE FOR DATA MANAGEMENT SOLUTIONS, BY GEOGRAPHY, 2020-2026 (USD MILLION)
TABLE 8. GLOBAL IN VITRO DIAGNOSTICS QUALITY CONTROL MARKET VALUE FOR QUALITY ASSURANCE SERVICES, BY GEOGRAPHY, 2020-2026 (USD MILLION)
TABLE 9. GLOBAL IN VITRO DIAGNOSTICS QUALITY CONTROL MARKET VALUE, BY APPLICATION, 2020-2026 (USD MILLION)
TABLE 10. GLOBAL IN VITRO DIAGNOSTICS QUALITY CONTROL MARKET VALUE FOR IMMUNOCHEMISTRY/IMMUNOASSAY, BY GEOGRAPHY, 2020-2026 (USD MILLION)
TABLE 11. GLOBAL IN VITRO DIAGNOSTICS QUALITY CONTROL MARKET VALUE FOR CLINICAL CHEMISTRY, BY GEOGRAPHY, 2020-2026 (USD MILLION)
TABLE 12. GLOBAL IN VITRO DIAGNOSTICS QUALITY CONTROL MARKET VALUE FOR HEMATOLOGY, BY GEOGRAPHY, 2020-2026 (USD MILLION)
TABLE 13. GLOBAL IN VITRO DIAGNOSTICS QUALITY CONTROL MARKET VALUE FOR MOLECULAR DIAGNOSTICS, BY GEOGRAPHY, 2020-2026 (USD MILLION)
TABLE 14. GLOBAL IN VITRO DIAGNOSTICS QUALITY CONTROL MARKET VALUE FOR COAGULATION & HEMOSTASIS, BY GEOGRAPHY, 2020-2026 (USD MILLION)
TABLE 15. GLOBAL IN VITRO DIAGNOSTICS QUALITY CONTROL MARKET VALUE FOR MICROBIOLOGY, BY GEOGRAPHY, 2020-2026 (USD MILLION)
TABLE 16. GLOBAL IN VITRO DIAGNOSTICS QUALITY CONTROL MARKET VALUE FOR OTHER, BY GEOGRAPHY, 2020-2026 (USD MILLION)
TABLE 17. GLOBAL IN VITRO DIAGNOSTICS QUALITY CONTROL MARKET VALUE, BY END USER, 2020-2026 (USD MILLION)
TABLE 18. GLOBAL IN VITRO DIAGNOSTICS QUALITY CONTROL MARKET VALUE FOR HOSPITALS MARKET, BY GEOGRAPHY, 2020-2026 (USD MILLION)
TABLE 19. GLOBAL IN VITRO DIAGNOSTICS QUALITY CONTROL MARKET VALUE FOR CLINICAL LABORATORIES MARKET, BY GEOGRAPHY, 2020-2026 (USD MILLION)
TABLE 20. GLOBAL IN VITRO DIAGNOSTICS QUALITY CONTROL MARKET VALUE FOR ACADEMIC & RESEARCH INSTITUTES, BY GEOGRAPHY, 2020-2026 (USD MILLION)
TABLE 21. GLOBAL IN VITRO DIAGNOSTICS QUALITY CONTROL MARKET VALUE FOR OTHER MARKET, BY GEOGRAPHY, 2020-2026 (USD MILLION)
TABLE 22. NORTH AMERICA IN VITRO DIAGNOSTICS QUALITY CONTROL MARKET VALUE, BY COUNTRY, 2020-2026 (USD MILLION)
TABLE 23. NORTH AMERICA IN VITRO DIAGNOSTICS QUALITY CONTROL MARKET VALUE, BY PRODUCT, 2020-2026 (USD MILLION)
TABLE 24. NORTH AMERICA IN VITRO DIAGNOSTICS QUALITY CONTROL MARKET VALUE, BY APPLICATION, 2020-2026 (USD MILLION)
TABLE 25. NORTH AMERICA IN VITRO DIAGNOSTICS QUALITY CONTROL MARKET VALUE, BY END USER, 2020-2026 (USD MILLION)
TABLE 26. NORTH AMERICA IN VITRO DIAGNOSTICS QUALITY CONTROL MARKET VALUE, BY MANUFACTURER, 2020-2026 (USD MILLION)
TABLE 27. EUROPE IN VITRO DIAGNOSTICS QUALITY CONTROL MARKET VALUE, BY COUNTRY, 2020-2026 (USD MILLION)
TABLE 28. EUROPE IN VITRO DIAGNOSTICS QUALITY CONTROL MARKET VALUE, BY PRODUCT, 2020-2026 (USD MILLION)
TABLE 29. EUROPE IN VITRO DIAGNOSTICS QUALITY CONTROL MARKET VALUE, BY APPLICATION, 2020-2026 (USD MILLION)
TABLE 30. EUROPE IN VITRO DIAGNOSTICS QUALITY CONTROL MARKET VALUE, BY END USER, 2020-2026 (USD MILLION)
TABLE 31. EUROPE IN VITRO DIAGNOSTICS QUALITY CONTROL MARKET VALUE, BY MANUFACTURER, 2020-2026 (USD MILLION)
TABLE 32. ASIA PACIFIC IN VITRO DIAGNOSTICS QUALITY CONTROL MARKET VALUE, BY COUNTRY, 2020-2026 (USD MILLION)
TABLE 33. ASIA PACIFIC IN VITRO DIAGNOSTICS QUALITY CONTROL MARKET VALUE, BY PRODUCT, 2020-2026 (USD MILLION)
TABLE 34. ASIA PACIFIC IN VITRO DIAGNOSTICS QUALITY CONTROL MARKET VALUE, BY APPLICATION, 2020-2026 (USD MILLION)
TABLE 35. ASIA PACIFIC IN VITRO DIAGNOSTICS QUALITY CONTROL MARKET VALUE, BY END USER, 2020-2026 (USD MILLION)
TABLE 36. ASIA PACIFIC IN VITRO DIAGNOSTICS QUALITY CONTROL MARKET VALUE, BY MANUFACTURER, 2020-2026 (USD MILLION)
TABLE 37. REST OF WORLD IN VITRO DIAGNOSTICS QUALITY CONTROL MARKET VALUE, BY PRODUCT, 2020-2026 (USD MILLION)
TABLE 38. REST OF WORLD IN VITRO DIAGNOSTICS QUALITY CONTROL MARKET VALUE, BY APPLICATION, 2020-2026 (USD MILLION)
TABLE 39. REST OF WORLD IN VITRO DIAGNOSTICS QUALITY CONTROL MARKET VALUE, BY END USER, 2020-2026 (USD MILLION)
TABLE 40. REST OF WORLD IN VITRO DIAGNOSTICS QUALITY CONTROL MARKET VALUE, BY MANUFACTURER, 2020-2026 (USD MILLION)
TABLE 41. SUN DIAGNOSTICS: OVERVIEW
TABLE 42. SUN DIAGNOSTICS: STRATEGIC SNAPSHOT
TABLE 43. SUN DIAGNOSTICS: BUSINESS FOCUS
TABLE 44. SUN DIAGNOSTICS: TECHNOLOGY/SERVICE PORTFOLIO
TABLE 45. QUIDEL CORPORATION: OVERVIEW
TABLE 46. QUIDEL CORPORATION: STRATEGIC SNAPSHOT
TABLE 47. QUIDEL CORPORATION: BUSINESS FOCUS
TABLE 48. QUIDEL CORPORATION: TECHNOLOGY/SERVICE PORTFOLIO
TABLE 49. TECHNOPATH CLINICAL DIAGNOSTICS: OVERVIEW
TABLE 50. TECHNOPATH CLINICAL DIAGNOSTICS: STRATEGIC SNAPSHOT
TABLE 51. TECHNOPATH CLINICAL DIAGNOSTICS: BUSINESS FOCUS
TABLE 52. TECHNOPATH CLINICAL DIAGNOSTICS: TECHNOLOGY/SERVICE PORTFOLIO
TABLE 53. DANAHER CORPORATION: OVERVIEW
TABLE 54. DANAHER CORPORATION: STRATEGIC SNAPSHOT
TABLE 55. DANAHER CORPORATION: BUSINESS FOCUS
TABLE 56. DANAHER CORPORATION: TECHNOLOGY/SERVICE PORTFOLIO
TABLE 57. ABBOTT LABORATORIES INC: OVERVIEW
TABLE 58. ABBOTT LABORATORIES INC: STRATEGIC SNAPSHOT
TABLE 59. ABBOTT LABORATORIES INC: BUSINESS FOCUS
TABLE 60. ABBOTT LABORATORIES INC: TECHNOLOGY/SERVICE PORTFOLIO
TABLE 61. CHOICESPINE: OVERVIEW
TABLE 62. CHOICESPINE: STRATEGIC SNAPSHOT
TABLE 63. CHOICESPINE: BUSINESS FOCUS
TABLE 64. CHOICESPINE: TECHNOLOGY/SERVICE PORTFOLIO
TABLE 65. SIEMENS HEALTHINEERS: OVERVIEW
TABLE 66. SIEMENS HEALTHINEERS: STRATEGIC SNAPSHOT
TABLE 67. SIEMENS HEALTHINEERS: BUSINESS FOCUS
TABLE 68. SIEMENS HEALTHINEERS: TECHNOLOGY/SERVICE PORTFOLIO
TABLE 69. FORTRESS DIAGNOSTICS: OVERVIEW
TABLE 70. FORTRESS DIAGNOSTICS: STRATEGIC SNAPSHOT
TABLE 71. FORTRESS DIAGNOSTICS: BUSINESS FOCUS
TABLE 72. FORTRESS DIAGNOSTICS: TECHNOLOGY/SERVICE PORTFOLIO
TABLE 73. CREATIVE BIOLABS: OVERVIEW
TABLE 74. CREATIVE BIOLABS: STRATEGIC SNAPSHOT
TABLE 75. CREATIVE BIOLABS: BUSINESS FOCUS
TABLE 76. CREATIVE BIOLABS: TECHNOLOGY/SERVICE PORTFOLIO
TABLE 77. QNOSTICS: OVERVIEW
TABLE 78. QNOSTICS: STRATEGIC SNAPSHOT
TABLE 79. QNOSTICS: BUSINESS FOCUS
TABLE 80. QNOSTICS: TECHNOLOGY/SERVICE PORTFOLIO
Research Framework
Infoholic Research works on a holistic 360° approach in order to deliver high quality, validated and reliable information in our market reports. The Market estimation and forecasting involves following steps:
- Data Collation (Primary & Secondary)
- In-house Estimation (Based on proprietary data bases and Models)
- Market Triangulation
- Forecasting

Market related information is congregated from both primary and secondary sources.
Primary sources
Involved participants from all global stakeholders such as Solution providers, service providers, Industry associations, thought leaders etc. across levels such as CXOs, VPs and managers. Plus, our in-house industry experts having decades of industry experience contribute their consulting and advisory services.
Secondary sources
Include public sources such as regulatory frameworks, government IT spending, government demographic indicators, industry association statistics, and company publications along with paid sources such as Factiva, OneSource, Bloomberg among others.
![]()


