
Permanent Rare Earth Magnets Market, By Types (Neodymium Magnets and Samarium Magnets), By Application (Industrial, Consumer Electronics, Home Appliances, Automotive, Wind Turbines and others) and Geography – Drivers, Opportunities, Trends, and Forecasts up to 2022
- October, 2016
- Domain: Chemicals, Materials & Food - Inorganic Chemicals
- Get Free 10% Customization in this Report
Overview
Permanent magnets are those which retain their magnetic properties even in the absence of an inductive field. Permanent rare earth magnets are the strongest available magnets and are broadly based on two rare earth elements – neodymium and samarium. The rare earth here is a misnomer and these elements are abundantly available in the earth crust. However, due to the difficulty of extraction and high-cost involved in the refining and purification process, these metals are costly. Thus, the application areas for permanent rare earth magnets is limited.
Research Methodology
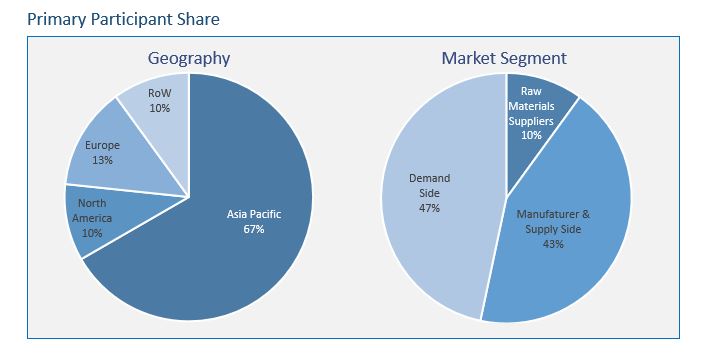
The permanent rare earth magnets market has been analyzed by utilizing the optimum combination of secondary sources and in-house methodology along with an irreplaceable blend of primary insights. The real-time assessment of the market is an integral part of our market sizing and forecasting methodology, wherein our industry experts and panel of primary participants helped in compiling the best quality with realistic parametric estimations. Further, the participation share of different categories of primary participants is given below:
Key Market Insights
According to Infoholic Research, the global permanent rare earth magnets market is expected to grow at a CAGR of 13.2% during the forecast period to reach $41.41 billion by 2022. Industrial applications segment is expected to maintain global dominance in application segments, whereas China and Japan drive the Asia Pacific market which is expected to increase its dominance in global permanent rare earth magnets market.
The global supply of rare earth metals is expected to remain stable after WTO intervention and international agreements providing opportunities for sustainable market growth. The international players are also looking for other ways to reduce the dependencies, such as options of heavy rare earth free magnets, but the overall market is expected to remain stable in terms of price during the forecast period.
Geographical segmentation
The market is segmented by the following key geographies – Asia-Pacific, Europe, North America and Rest of the World.
China is the global leader in rare earth oxide supply covering more than 90% of the global market. This has translated to China’s dominance in rare earth magnets market. After China, Japan is the major market for rare earth magnets. Although a significant portion of products end-up being utilized in the developed countries of the US and Western Europe; these products are largely sourced from developing countries in South Asian region. The increasing demand for efficient products across diverse industries will drive the demand for rare earth magnets with highest expected growth rate from wind turbine market.
Neodymium Magnets and Samarium Magnets are the two magnet types studied in the report.
The market is studied and analyzed in terms of the following application industries – Industrial, Consumer Electronics, Home Appliances, Automotive, Wind Turbines and Others.
Some of the prominent players in the global permanent rare earth magnets market are Hitachi Metals, Vacuumschmelze GmBH & Co. KG, Shin-Etsu Rare Earth Magnet and TDK. The report includes watchlist companies such as Vacuumschmelze Inc., Seimens AG and Toyota.
Current and predicted business strategies for the leading companies of the market.
The report includes a detailed competitive benchmarking of the leading industry players based on metrics such as company profile, financial health, business objectives, business strategy and SWOT analysis.
The study of the global permanent rare earth magnets market provides the market size information and market trends along with the factors and parameters impacting it in both short and long-term perspective. The study also covers the competitive scenario of the market with respect to the raw material availability, major players with their branding strategies and differentiating factors. The report discusses Samarium and Neodymium magnet uses.
The study ensures a 360° view, bringing out the complete key insights of the industry. These insights help the business decision makers to make better business plans, strategize and make informed decisions for future growth of the business. In addition, the study helps the venture capitalist in understanding the companies better and take informed decisions.
1 Report Outline
1.1 Introduction
1.2 Report Scope
1.3 Market Definitions
1.4 Research Methodology
1.4.1 Data Collation & In-House Estimation
1.4.2 Market Triangulation
1.4.3 Forecasting
1.5 Study Declarations
1.6 Report Assumptions
1.7 Stakeholders
2 Executive Summary
2.1 China is expected to further increase its dominance with extension to application markets
2.2 Wind turbine would lead the rare earth magnet demand growth while Industrial motor would maintain lead contribution position
3 Market Positioning
3.1 Total Addressable Market (TAM): Permanent Magnets
3.1.1 Market Overview
3.1.2 Major Trends
3.2 Segmented Addressable Market (SAM)
3.3 Related Markets
4 Market Outlook
4.1 Overview
4.2 Value Chain Analysis
4.3 PESTLE Analysis
4.4 Porter 5 (Five) Forces
4.5 Patent Analysis
5 Market Characteristics
5.1 Market Segmentation
5.2 Market Dynamics
5.2.1 Drivers
5.2.1.1 Increasing demand for efficiency and performance with smaller volume
5.2.1.2 Decreased Chinese Supply Control
5.2.2 Restraints
5.2.2.1 Illegal Mining in China Distorting Level Playing Field
5.2.2.2 Price Fluctuation Due to Controlled Supply and Political Issues
5.2.3 Opportunities
5.2.3.1 High Growth in EV/HEV and Wind Turbines
5.2.3.2 Innovation Reducing Dependencies on Heavier Rare Earths
5.2.4 DRO – Impact Analysis
6 Types: Market Size & Analysis
6.1 Overview
6.2 Neodymium Permanent Magnets
6.3 Samarium-Cobalt Magnets
6.4 Vendor Profiles
6.4.1 Hitachi Metals, Ltd.
6.4.2 Neo Performance Materials
6.4.3 Shin-Etsu Chemical Co., Ltd.
6.4.4 Sumitomo Metal Mining Co., Ltd.
6.4.5 TDK
6.4.6 Vaccumschmelze GmbH & Co. KG (VAC)
(Overview, Business Unit, Geographic Revenue, Recent Developments, SWOT Analysis, Business Strategy have been covered for all vendors)
7 Applications: Market Size & Analysis
7.1 Overview
7.2 Industrial Applications
7.3 Consumer Electronics Applications
7.4 Home Appliances Applications
7.5 Automotive Applications
7.6 Wind Turbines Applications
7.7 Customer Profile
7.7.1 Ford Motor Company
7.7.2 Honda Motor Co., Ltd.
7.7.3 Hyundai Motor Company
7.7.4 Siemens
7.7.5 Toyota Motor Company
(Overview, Business Unit, Geographic Revenue, Recent Developments, SWOT Analysis, Business Strategy have been covered for all vendors)
8 Regions: Market Size & Analysis
8.1 Overview
8.2 Asia-Pacific
8.2.1 Asia-Pacific Market, By Countries
8.2.2 Asia-Pacific Market, By Type
8.2.3 Asia-Pacific Market, By Application
8.3 Europe
8.3.1 Europe Market, By Countries
8.3.2 Europe Market, By Type
8.3.3 Europe Market, By Application
8.4 North America
8.4.1 North America Market, By Countries
8.4.2 North America Market, By Type
8.4.3 North America Market, By Application
8.5 Rest of the World
8.5.1 Rest of the World Market, By Regions
8.5.2 Rest of the World Market, By Type
8.5.3 Rest of the World Market, By Application
9 Companies to Watch for
9.1 Vacuumschmelze Inc
9.2 Seimens AG
9.3 Toyota
10 Competitive Landscape
10.1 Competitor Comparison Analysis
10.2 Market Landscape
10.2.1 Mergers, acquisitions & joint ventures
10.2.2 Agreements & Collaborations
10.2.3 Expansion
10.2.4 Exhibition & product launch
10.2.5 Innovation & product development
10.2.6 Legal 141
10.2.7 Restructuring & Repositioning
10.2.8 Divestment & divestiture
11 Expert’s Views
Annexure
Acronyms
TABLE 1 GLOBAL PERMANENT RARE MAGNET MARKET VALUE, BY TYPE, 2015-2022 ($MILLION) 30
TABLE 2 GLOBAL PERMANENT RARE MAGNET MARKET VOLUME, BY TYPE, 2015-2022 (KILOTONS) 31
TABLE 3 GLOBAL NEODYMIUM PERMANENT MAGNET MARKET VALUE,
BY GEOGRAPHY, 2015-2022 ($MILLION) 32
TABLE 4 GLOBAL NEODYMIUM PERMANENT MAGNET MARKET VOLUME,
BY GEOGRAPHY, 2015-2022 (KILOTONS) 32
TABLE 5 GLOBAL SAMARIUM-COBALT PERMANENT MAGNET MARKET VALUE,
BY GEOGRAPHY, 2015–2022 ($MILLION) 33
TABLE 6 GLOBAL SAMARIUM PERMANENT MAGNET MARKET VOLUME,
BY GEOGRAPHY, 2015-2022 (KILOTONS) 34
TABLE 7 HITACHI METALS, LTD.: RECENT DEVELOPMENTS 36
TABLE 8 NEO PERFORMANCE MATERIALS: RECENT DEVELOPMENTS 42
TABLE 9 SHIN-ETSU CHEMICAL CO., LTD.: RECENT DEVELOPMENTS 46
TABLE 10 SUMITOMO METAL MINING CO., LTD.: RECENT DEVELOPMENTS 51
TABLE 11 TDK: RECENT DEVELOPMENTS 55
TABLE 12 VAC: RECENT DEVELOPMENTS 59
TABLE 13 GLOBAL PERMANENT RARE MAGNET MARKET VALUE,
BY APPLICATION, 2015–2022 ($MILLION) 63
TABLE 14 GLOBAL PERMANENT RARE MAGNET MARKET VOLUME,
BY APPLICATION, 2015-2022 (KILOTON) 64
TABLE 15 GLOBAL PERMANENT RARE MAGNET MARKET VALUE IN INDUSTRIAL APPLICATION,
BY GEOGRAPHY, 2015-2022 ($MILLION) 65
TABLE 16 GLOBAL PERMANENT RARE MAGNET MARKET VOLUME IN INDUSTRIAL APPLICATION,
BY GEOGRAPHY, 2015-2022 (KILOTON) 65
TABLE 17 GLOBAL PERMANENT RARE MAGNET MARKET VALUE IN CONSUMER ELECTRONICS APPLIACTION,
BY GEOGRAPHY, 2015-2022 ($MILLION) 66
TABLE 18 GLOBAL PERMANENT RARE MAGNET MARKET VOLUME IN CONSUMER ELECTRONICS APPLICATION,
BY GEOGRAPHY, 2015-2022 (KILOTON) 67
TABLE 19 GLOBAL PERMANENT RARE MAGNET MARKET VALUE IN HOME APPLIANCES APPLICATION,
BY GEOGRAPHY, 2015-2022 ($MILLION) 68
TABLE 20 GLOBAL PERMANENT RARE MAGNET MARKET VOLUME IN HOME APPLIANCES APPLICATION,
BY GEOGRAPHY, 2015-2022 (KILOTON) 69
TABLE 21 GLOBAL PERMANENT RARE MAGNET MARKET VALUE IN AUTOMOTIVE APPLICATION,
BY GEOGRAPHY, 2015-2022 ($MILLION) 70
TABLE 22 GLOBAL PERMANENT RARE MAGNET MARKET VOLUME IN AUTOMOTIVE APPLICATION,
BY GEOGRAPHY, 2015-2022 (KILOTON) 71
TABLE 23 GLOBAL PERMANENT RARE MAGNET MARKET VALUE IN WIND TURBINES APPLICATION,
BY GEOGRAPHY, 2015-2022 ($MILLION) 72
TABLE 24 GLOBAL PERMANENT RARE MAGNET MARKET VOLUME IN WIND TURBINES APPLICATION,
BY GEOGRAPHY, 2015-2022 (KILOTON) 73
TABLE 25 FORD MOTOR COMPANY: RECENT DEVELOPMENTS 76
TABLE 26 HYUNDAI MOTOR COMPANY: RECENT DEVELOPMENTS 86
TABLE 27 SIEMENS: RECENT DEVELOPMENTS 91
TABLE 28 TOYOTA MOTOR COMPANY: RECENT DEVELOPMENTS 97
TABLE 29 GLOBAL PERMANENT RARE EARTH MAGNETS MARKET VALUE,
BY GEOGRAPHY, 2015-2022 ($MILLION) 100
TABLE 30 GLOBAL PERMANENT RARE EARTH MAGNETS MARKET VOLUME,
BY GEOGRAPHY, 2015-2022 (KILOTON) 101
TABLE 31 ASIA PACIFIC PERMANENT RARE EARTH MAGNET MARKET VALUE,
BY COUNTRY, 2015-2022 ($MILLION) 102
TABLE 32 ASIA PACIFIC PERMANENT RARE EARTH MAGNET MARKET VOLUME,
BY COUNTRY, 2015-2022 (KILOTON) 103
TABLE 33 ASIA PACIFIC PERMANENT RARE EARTH MAGNET MARKET VALUE,
BY TYPE, 2015-2022 ($MILLION) 104
TABLE 34 ASIA PACIFIC PERMANENT RARE EARTH MAGNET MARKET VOLUME,
BY TYPE, 2015-2022 (KILOTON) 104
TABLE 35 ASIA PACIFIC PERMANENT RARE EARTH MAGNET MARKET VALUE,
BY APPLICATION, 2015-2022 ($MILLION) 105
TABLE 36 ASIA-PACIFIC PERMANENT RARE EARTH MAGNET MARKET VOLUME,
BY APPLICATION, 2015-2022 (KILOTON) 106
TABLE 37 EUROPE PERMANENT RARE EARTH MAGNET MARKET VALUE,
BY COUNTRY, 2015-2022 ($MILLION) 107
TABLE 38 EUROPE PERMANENT RARE EARTH MAGNET MARKET VOLUME,
BY COUNTRY, 2015-2022 (KILOTON) 108
TABLE 39 EUROPE PERMANENT RARE EARTH MAGNET MARKET VALUE,
BY TYPE, 2015-2022 ($MILLION) 109
TABLE 40 EUROPE PERMANENT RARE EARTH MAGNET MARKET VOLUME,
BY TYPE, 2015-2022 (KILOTON) 109
TABLE 41 EUROPE PERMANENT RARE EARTH MAGNET MARKET VALUE,
BY APPLICATION, 2015-2022 ($MILLION) 110
TABLE 42 EUROPE PERMANENT RARE EARTH MAGNET MARKET VOLUME,
BY APPLICATION, 2015-2022 (KILOTON) 110
TABLE 43 NORTH AMERICA PERMANENT RARE EARTH MAGNET MARKET VALUE,
BY COUNTRY, 2015-2022 ($MILLION) 112
TABLE 44 NORTH AMERICA PERMANENT RARE EARTH MAGNET MARKET VOLUME,
BY COUNTRY, 2015-2022 (KILOTON) 112
TABLE 45 NORTH AMERICA PERMANENT RARE EARTH MAGNET MARKET VALUE,
BY TYPE, 2015-2022 ($MILLION) 113
TABLE 46 NORTH AMERICA PERMANENT RARE EARTH MAGNET MARKET VOLUME,
BY TYPE, 2015-2022 (KILOTON) 114
TABLE 47 NORTH AMERICA PERMANENT RARE EARTH MAGNET MARKET VALUE,
BY APPLICATION, 2015-2022 ($MILLION) 115
TABLE 48 NORTH AMERICA PERMANENT RARE EARTH MAGNET MARKET VOLUME,
BY APPLICATION, 2015-2022 (KILOTON) 115
TABLE 49 REST OF THE WORLD PERMANENT RARE EARTH MAGNET MARKET VALUE,
BY COUNTRY, 2015-2022 ($MILLION) 116
TABLE 50 REST OF THE WORLD PERMANENT RARE EARTH MAGNET MARKET VOLUME,
BY COUNTRY, 2015-2022 (KILOTON) 117
TABLE 51 REST OF THE WORLD PERMANENT RARE EARTH MAGNET MARKET VALUE,
BY TYPE, 2015-2022 ($MILLION) 118
TABLE 52 REST OF THE WORLD PERMANENT RARE EARTH MAGNET MARKET VOLUME,
BY TYPE, 2015-2022 (KILOTON) 118
TABLE 53 REST OF THE WORLD PERMANENT RARE EARTH MAGNET MARKET VALUE,
BY APPLICATION, 2015-2022 ($MILLION) 119
TABLE 54 REST OF THE WORLD PERMANENT RARE EARTH MAGNET MARKET VOLUME,
BY APPLICATION, 2015-2022 (KILOTON) 120
TABLE 55 MERGER, ACQUISITION & JOINT VENTURE, 2011–2016 123
TABLE 56 AGREEMENTS & COLLABORATIONS, 2014–2015 124
TABLE 57 EXPANSION, 2014–2015 125
TABLE 58 EXHIBITION & PRODUCT LAUNCH, 2014–2015 126
TABLE 59 INNOVATION & PRODUCT DEVELOPMENT, 2014–2015 127
TABLE 60 LEGAL, 2014–2015 127
TABLE 61 RESTRUCTURING & REPOSITIONING, 2014–2015 127
TABLE 62 DIVESTMENT & DIVESTITURE, 2014–2015 128
Research Framework
Infoholic Research works on a holistic 360° approach in order to deliver high quality, validated and reliable information in our market reports. The Market estimation and forecasting involves following steps:
- Data Collation (Primary & Secondary)
- In-house Estimation (Based on proprietary data bases and Models)
- Market Triangulation
- Forecasting

Market related information is congregated from both primary and secondary sources.
Primary sources
Involved participants from all global stakeholders such as Solution providers, service providers, Industry associations, thought leaders etc. across levels such as CXOs, VPs and managers. Plus, our in-house industry experts having decades of industry experience contribute their consulting and advisory services.
Secondary sources
Include public sources such as regulatory frameworks, government IT spending, government demographic indicators, industry association statistics, and company publications along with paid sources such as Factiva, OneSource, Bloomberg among others.
![]()
