
Digital Transaction Management Market Based on Component (Hardware, Software, Services), End-User (BFSI, Healthcare, Retail, Government), Solution (E-Signature, Authentication, Document Archival, Workflow Automation), and Geography – Global Forecast to 2026
- April, 2021
- Domain: ICT - Software & Services
- Get Free 10% Customization in this Report
The use of a digital transaction management system increases the quality and speed of work processes while also making them more convenient. Increased internet penetration and the increasing popularity of digital payment modes, especially in fast-developing countries with dense populations, are significant market growth drivers. Simultaneously, rapid adoption of cloud-based services and the implementation of more rigorous IT protection frameworks improve digital transaction management's prospects. The banking industry is starting to gravitate toward cloud services, which will likely present opportunities for market participants in the coming years. However, the imminent threat of a cyber-attack and digital fraud are two of the market's most daunting challenges. The Digital Transaction Management Market is assumed to grow at the rate of 20.8% CAGR by 2026.
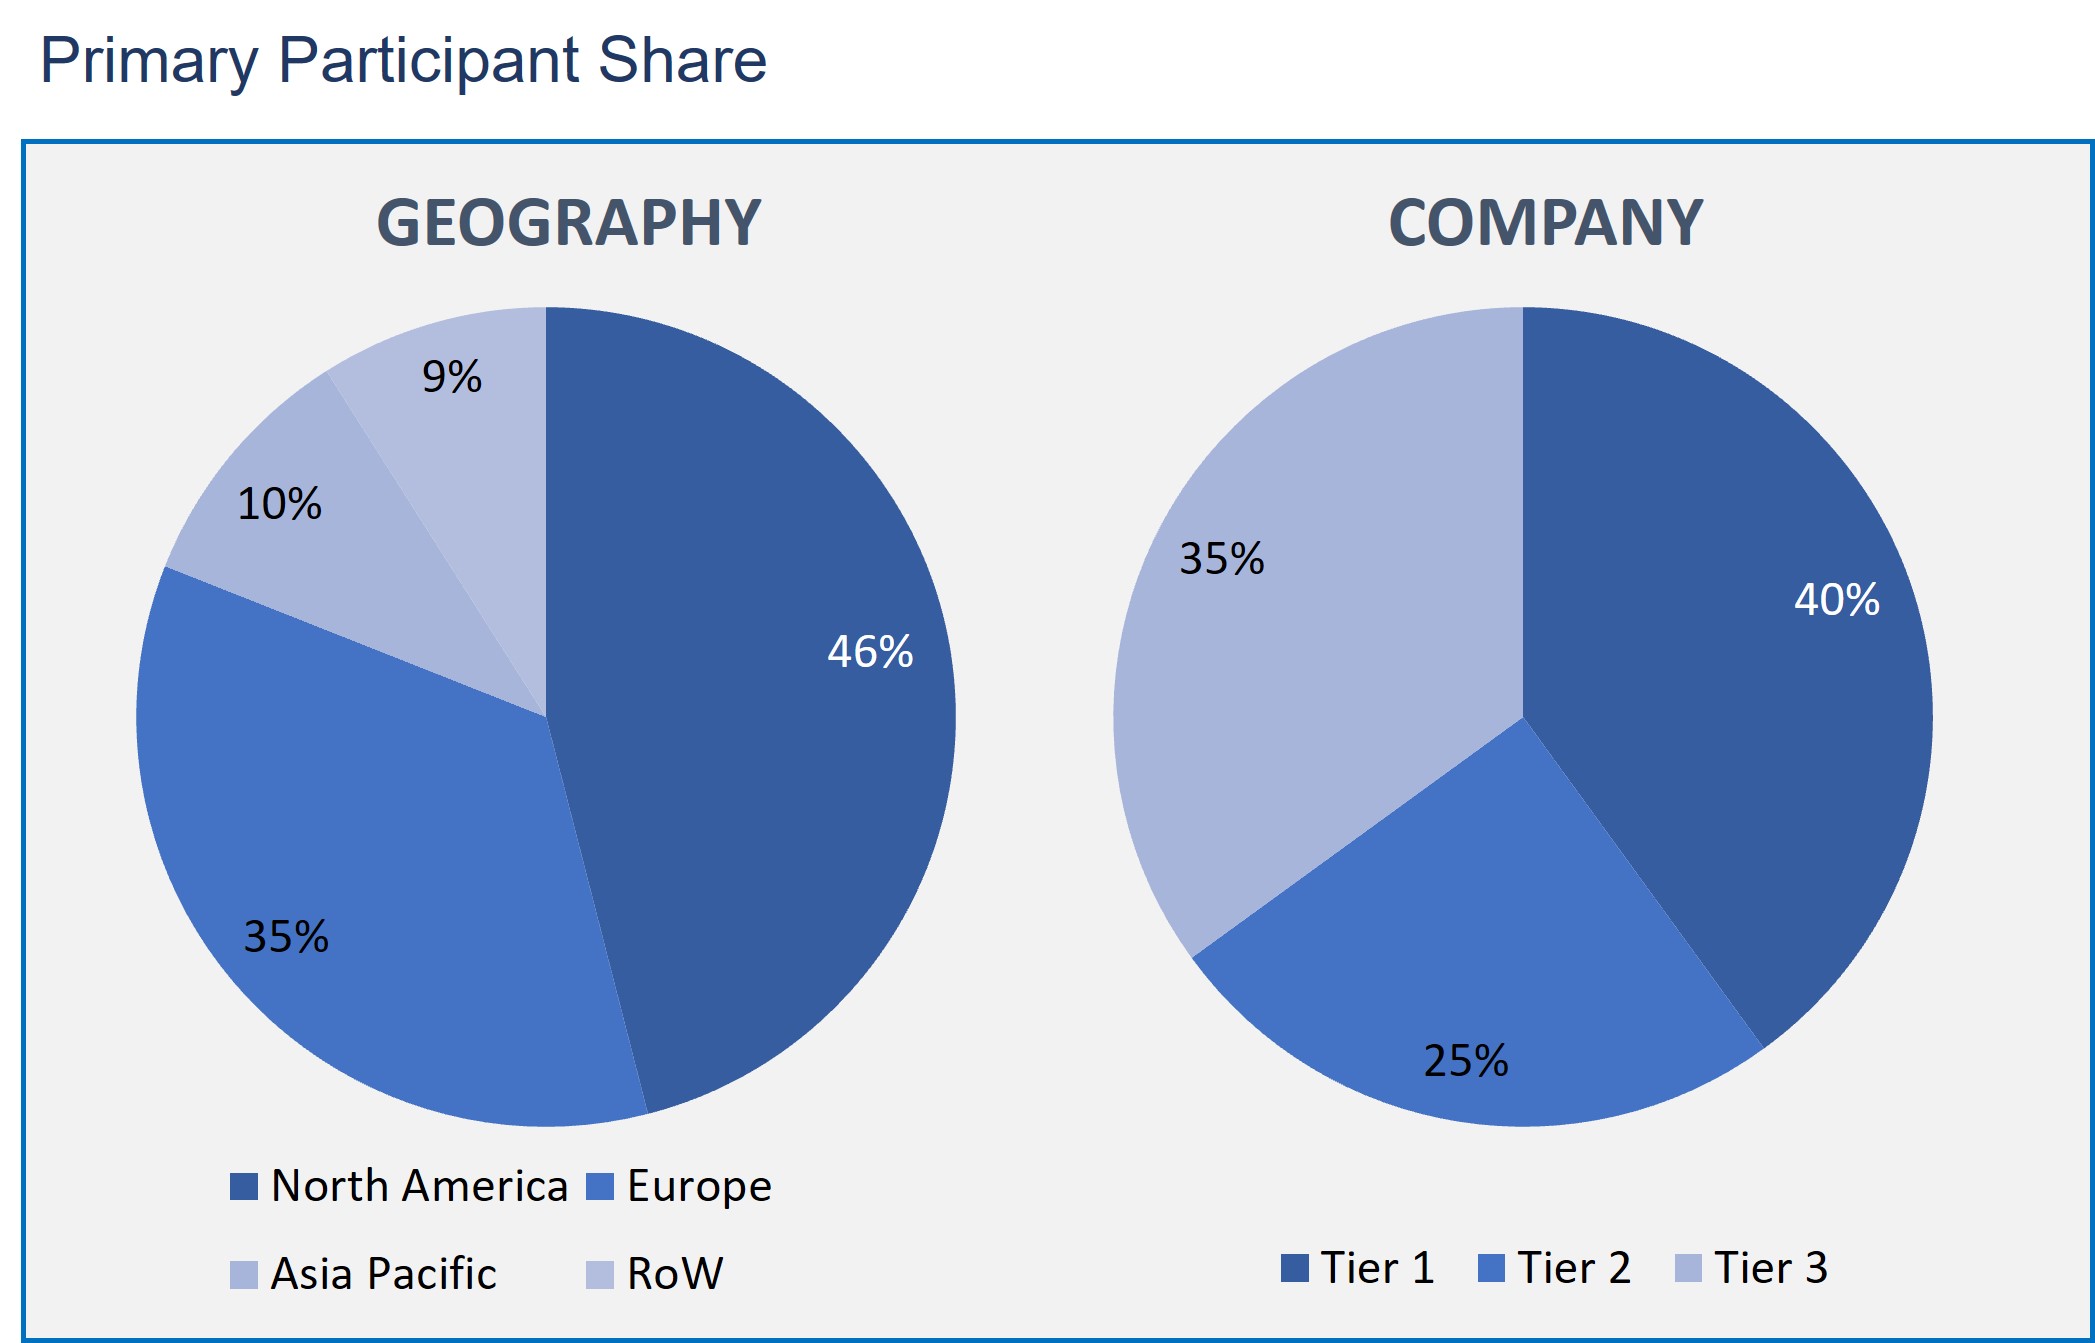
Research Methodology:
The Digital Transaction Management Market has been analyzed by utilizing the optimum combination of secondary sources and in-house methodology and a unique balance of primary insights. The real-time valuation of the market is an integral part of our forecasting and market sizing methodology. Industry experts and our primary participants have helped to compile related aspects with accurate parametric estimations for a complete study. The primary participants share is given below:
Digital Transaction Management Market, by Component
- Software
- Services
- Hardware
Digital Transaction Management Market, by End-user
- Retail
- IT & Telecom
- Healthcare
- Government
- Commercial
- BFSI
Digital Transaction Management Market, by Solution
- Document Archival
- Workflow Automation
- E-Signature
- Authentication
Digital Transaction Management Market, by Geography
- North America
- Europe
- Asia-Pacific
- Rest of the World
Technological advancements are paving the means for more secure and stable DTM solutions. Each transaction can be measured as proof of consent specified by the end-user who started the transaction using digital signatures. DTM solutions built on blockchain technology operate a decentralized network for transaction management to thwart malicious attacks.
As per the component segment, digital transaction management has been segmented into hardware, services, and software. The hardware segment conquered the market in 2018 and is projected to preserve its dominance over the estimated period. The increasing demand for Point of Sale machines for digital transaction management from incumbents of the hospitality, retail, and healthcare industries primarily drives the hardware segment's development. Electronic signature pads and contactless cards for digital transaction management are also expected to contribute to the hardware segment's growth.
Based on the solution of the digital transaction management market has been further segmented into workflow automation, authentication, electronic signatures, document archival, and others. The plethora of digital transaction management services offered by various DTM solution vendors agrees on the segment to dominate the market. The authentication segment also accounted for a substantial market share due to the huge demand for digital transaction authentication solutions, particularly from government agencies and incumbents of the BFSI industry.
In the regional market, digital transaction management has been further segmented into North America, Asia Pacific, Europe, and the rest of the world. The presence of several key market players and developing companies providing DTM solutions in North America drives the market growth. Furthermore, the region is also known for adopting the latest digital solutions for transaction management. Such features allow the North American regional market to account for a substantial share of the global market.
Adobe, DocuSign Inc, OneSpan, Kofax Inc, and Entrust Datacard Corporation. Other market incumbents like Nintex Global Ltd, Ascertia, DocuFirst, eOriginal, Inc. are key players covered in the report.
- This Digital Transaction Management market report presents the geographical region and sub-segments expected to have the fastest growth and share.
- This report describes the factors driving and restricting the market growth and the challenges and opportunities of the market.
- This report gives information on the market-leading players and their position in the market.
- This report also provides continuous market developments and innovations taking place in the Digital Transaction Management market.
- Executive Summary
- Industry Outlook
- Industry Overview
- Industry Trends
- Market Snapshot
- Market Definition
- Market Outlook
- Porter Five Forces
- Related Markets
- Market characteristics
- Market Overview
- Market Segmentation
- Market Dynamics
- Drivers
- Restraints
- Opportunities
- DRO - Impact Analysis
- Component: Market Size & Analysis
- Overview
- Software
- Services
- Hardware
- End-user: Market Size & Analysis
- Overview
- Retail
- IT & Telecom
- Healthcare
- Government
- Commercial
- BFSI
- Solution: Market Size & Analysis
- Overview
- Document Archival
- Workflow Automation
- E-Signature
- Authentication
- Geography: Market Size & Analysis
- Overview
- North America
- Europe
- Asia Pacific
- Rest of the World
- Competitive Landscape
- Competitor Comparison Analysis
- Market Developments
- Mergers and Acquisitions, Legal, Awards, Partnerships
- Product Launches and execution
- Vendor Profiles
- Adobe
- Overview
- Financial Overview
- Product Offerings
- Developments
- Business Strategy
- DocuSign Inc.
- Overview
- Financial Overview
- Product Offerings
- Developments
- Business Strategy
- Entrust Datacard Corporation
- Overview
- Financial Overview
- Product Offerings
- Developments
- Business Strategy
- Nintex Global Ltd.
- Overview
- Financial Overview
- Product Offerings
- Developments
- Business Strategy
- Ascertia
- Overview
- Financial Overview
- Product Offerings
- Developments
- Business Strategy
- DocuFirst
- Overview
- Financial Overview
- Product Offerings
- Developments
- Business Strategy
- eOriginal Inc
- Overview
- Financial Overview
- Product Offerings
- Developments
- Business Strategy
- Insight Enterprise Inc.
- Overview
- Financial Overview
- Product Offerings
- Developments
- Business Strategy
- Namirial Spa
- Overview
- Financial Overview
- Product Offerings
- Developments
- Business Strategy
- ThinkSmart
- Overview
- Financial Overview
- Product Offerings
- Developments
- Business Strategy
- Adobe
- Analyst Opinion
- Annexure
- Report Scope
- Market Definitions
- Research Methodology
- Data Collation and In-house Estimation
- Market Triangulation
- Forecasting
- Report Assumptions
- Declarations
- Stakeholders
- Abbreviations
TABLE 1. GLOBAL DIGITAL TRANSACTION MANAGEMENT MARKET VALUE, BY COMPONENT, 2020-2026 (USD BILLION)
TABLE 2. GLOBAL DIGITAL TRANSACTION MANAGEMENT MARKET VALUE FOR HARDWARE, BY GEOGRAPHY, 2020-2026 (USD BILLION)
TABLE 3. GLOBAL DIGITAL TRANSACTION MANAGEMENT MARKET VALUE FOR SOFTWARE, BY GEOGRAPHY, 2020-2026 (USD BILLION)
TABLE 4. GLOBAL DIGITAL TRANSACTION MANAGEMENT MARKET VALUE FOR SERVICES, BY GEOGRAPHY, 2020-2026 (USD BILLION)
TABLE 5. GLOBAL DIGITAL TRANSACTION MANAGEMENT MARKET VALUE, BY END-USER, 2020-2026 (USD BILLION)
TABLE 6. GLOBAL DIGITAL TRANSACTION MANAGEMENT MARKET VALUE FOR RETAIL, BY GEOGRAPHY, 2020-2026 (USD BILLION)
TABLE 7. GLOBAL DIGITAL TRANSACTION MANAGEMENT MARKET VALUE FOR IT AND TELECOM, BY GEOGRAPHY, 2020-2026 (USD BILLION)
TABLE 8. GLOBAL DIGITAL TRANSACTION MANAGEMENT MARKET VALUE FOR HEALTHCARE, BY GEOGRAPHY, 2020-2026 (USD BILLION)
TABLE 9. GLOBAL DIGITAL TRANSACTION MANAGEMENT MARKET VALUE FOR GOVERNMENT, BY GEOGRAPHY, 2020-2026 (USD BILLION)
TABLE 10. GLOBAL DIGITAL TRANSACTION MANAGEMENT MARKET VALUE FOR COMMERCIAL, BY GEOGRAPHY, 2020-2026 (USD BILLION)
TABLE 11. GLOBAL DIGITAL TRANSACTION MANAGEMENT MARKET VALUE FOR BFSI, BY GEOGRAPHY, 2020-2026 (USD BILLION)
TABLE 12. GLOBAL DIGITAL TRANSACTION MANAGEMENT MARKET VALUE, BY SOLUTION, 2020-2026 (USD BILLION)
TABLE 13. GLOBAL DIGITAL TRANSACTION MANAGEMENT MARKET VALUE FOR DOCUMENT ARCHIVAL, 2020-2026 (USD BILLION)
TABLE 14. GLOBAL DIGITAL TRANSACTION MANAGEMENT MARKET VALUE FOR WORKFLOW AUTOMATION, BY GEOGRAPHY, 2020-2026 (USD BILLION)
TABLE 15. GLOBAL DIGITAL TRANSACTION MANAGEMENT MARKET VALUE FOR E-SIGNATURE, BY GEOGRAPHY, 2020-2026 (USD BILLION)
TABLE 16. GLOBAL DIGITAL TRANSACTION MANAGEMENT MARKET VALUE FOR AUTHENTICATION, BY GEOGRAPHY, 2020-2026 (USD BILLION)
TABLE 17. NORTH AMERICA DIGITAL TRANSACTION MANAGEMENT MARKET VALUE, BY COUNTRY, 2020-2026 (USD BILLION)
TABLE 18. NORTH AMERICA DIGITAL TRANSACTION MANAGEMENT MARKET VALUE, BY COMPONENT, 2020-2026 (USD BILLION)
TABLE 19. NORTH AMERICA DIGITAL TRANSACTION MANAGEMENT MARKET VALUE, BY END-USER, 2020-2026 (USD BILLION)
TABLE 20. NORTH AMERICA DIGITAL TRANSACTION MANAGEMENT MARKET VALUE, BY SOLUTION, 2020-2026 (USD BILLION)
TABLE 21. U.S DIGITAL TRANSACTION MANAGEMENT MARKET VALUE, BY COMPONENT, 2020-2026 (USD BILLION)
TABLE 22. U.S DIGITAL TRANSACTION MANAGEMENT MARKET VALUE, BY END-USER, 2020-2026 (USD BILLION)
TABLE 23. U.S DIGITAL TRANSACTION MANAGEMENT MARKET VALUE, BY SOLUTION, 2020-2026 (USD BILLION)
TABLE 24. CANADA DIGITAL TRANSACTION MANAGEMENT MARKET VALUE, BY COMPONENT, 2020-2026 (USD BILLION)
TABLE 25. CANADA DIGITAL TRANSACTION MANAGEMENT MARKET VALUE, BY END-USER, 2020-2026 (USD BILLION)
TABLE 26. CANADA DIGITAL TRANSACTION MANAGEMENT MARKET VALUE, BY SOLUTION, 2020-2026 (USD BILLION)
TABLE 27. EUROPE DIGITAL TRANSACTION MANAGEMENT MARKET VALUE, BY COUNTRY, 2020-2026 (USD BILLION)
TABLE 28. EUROPE DIGITAL TRANSACTION MANAGEMENT MARKET VALUE, BY COMPONENT, 2020-2026 (USD BILLION)
TABLE 29. EUROPE DIGITAL TRANSACTION MANAGEMENT MARKET VALUE, BY END-USER, 2020-2026 (USD BILLION)
TABLE 30. EUROPE DIGITAL TRANSACTION MANAGEMENT MARKET VALUE, SOLUTION, 2020-2026 (USD BILLION)
TABLE 31. GERMANY DIGITAL TRANSACTION MANAGEMENT MARKET VALUE, BY COMPONENT, 2020-2026 (USD BILLION)
TABLE 32. GERMANY DIGITAL TRANSACTION MANAGEMENT MARKET VALUE, BY END-USER, 2020-2026 (USD BILLION)
TABLE 33. GERMANY DIGITAL TRANSACTION MANAGEMENT MARKET VALUE, BY SOLUTION, 2020-2026 (USD BILLION)
TABLE 34. U.K DIGITAL TRANSACTION MANAGEMENT MARKET VALUE, BY COMPONENT, 2020-2026 (USD BILLION)
TABLE 35. U.K DIGITAL TRANSACTION MANAGEMENT MARKET VALUE, BY END-USER, 2020-2026 (USD BILLION)
TABLE 36. U.K DIGITAL TRANSACTION MANAGEMENT MARKET VALUE, BY SOLUTION, 2020-2026 (USD BILLION)
TABLE 37. FRANCE DIGITAL TRANSACTION MANAGEMENT MARKET VALUE, BY COMPONENT, 2020-2026 (USD BILLION)
TABLE 38. FRANCE DIGITAL TRANSACTION MANAGEMENT MARKET VALUE, BY END-USER, 2020-2026 (USD BILLION)
TABLE 39. FRANCE DIGITAL TRANSACTION MANAGEMENT MARKET VALUE, BY SOLUTION, 2020-2026 (USD BILLION)
TABLE 40. ITALY DIGITAL TRANSACTION MANAGEMENT MARKET VALUE, BY COMPONENT, 2020-2026 (USD BILLION)
TABLE 41. ITALY DIGITAL TRANSACTION MANAGEMENT MARKET VALUE, BY END-USER, 2020-2026 (USD BILLION)
TABLE 42. ITALY DIGITAL TRANSACTION MANAGEMENT MARKET VALUE, BY SOLUTION, 2020-2026 (USD BILLION)
TABLE 43. SPAIN DIGITAL TRANSACTION MANAGEMENT MARKET VALUE, BY COMPONENT, 2020-2026 (USD BILLION)
TABLE 44. SPAIN DIGITAL TRANSACTION MANAGEMENT MARKET VALUE, BY END-USER, 2020-2026 (USD BILLION)
TABLE 45. SPAIN DIGITAL TRANSACTION MANAGEMENT MARKET VALUE, BY SOLUTION, 2020-2026 (USD BILLION)
TABLE 46. ROE DIGITAL TRANSACTION MANAGEMENT MARKET VALUE, BY COMPONENT, 2020-2026 (USD BILLION)
TABLE 47. ROE DIGITAL TRANSACTION MANAGEMENT MARKET VALUE, BY END-USER, 2020-2026 (USD BILLION)
TABLE 48. ROE DIGITAL TRANSACTION MANAGEMENT MARKET VALUE, BY SOLUTION, 2020-2026 (USD BILLION)
TABLE 49. ASIA PACIFIC DIGITAL TRANSACTION MANAGEMENT MARKET VALUE, BY COUNTRY, 2020-2026 (USD BILLION)
TABLE 50. ASIA PACIFIC DIGITAL TRANSACTION MANAGEMENT MARKET VALUE, BY COMPONENT, 2020-2026 (USD BILLION)
TABLE 51. ASIA PACIFIC DIGITAL TRANSACTION MANAGEMENT MARKET VALUE, BY END-USER, 2020-2026 (USD BILLION)
TABLE 52. ASIA PACIFIC DIGITAL TRANSACTION MANAGEMENT MARKET VALUE, BY SOLUTION, 2020-2026 (USD BILLION)
TABLE 53. CHINA DIGITAL TRANSACTION MANAGEMENT MARKET VALUE, BY COMPONENT, 2020-2026 (USD BILLION)
TABLE 54. CHINA DIGITAL TRANSACTION MANAGEMENT MARKET VALUE, BY END-USER, 2020-2026 (USD BILLION)
TABLE 55. CHINA DIGITAL TRANSACTION MANAGEMENT MARKET VALUE, BY SOLUTION, 2020-2026 (USD BILLION)
TABLE 56. INDIA DIGITAL TRANSACTION MANAGEMENT MARKET VALUE, BY COMPONENT, 2020-2026 (USD BILLION)
TABLE 57. INDIA DIGITAL TRANSACTION MANAGEMENT MARKET VALUE, BY END-USER, 2020-2026 (USD BILLION)
TABLE 58. INDIA DIGITAL TRANSACTION MANAGEMENT MARKET VALUE, BY SOLUTION, 2020-2026 (USD BILLION)
TABLE 59. JAPAN DIGITAL TRANSACTION MANAGEMENT MARKET VALUE, BY COMPONENT, 2020-2026 (USD BILLION)
TABLE 60. JAPAN DIGITAL TRANSACTION MANAGEMENT MARKET VALUE, BY END-USER, 2020-2026 (USD BILLION)
TABLE 61. JAPAN DIGITAL TRANSACTION MANAGEMENT MARKET VALUE, BY SOLUTION, 2020-2026 (USD BILLION)
TABLE 62. REST OF APAC DIGITAL TRANSACTION MANAGEMENT MARKET VALUE, BY COMPONENT, 2020-2026 (USD BILLION)
TABLE 63. REST OF APAC DIGITAL TRANSACTION MANAGEMENT MARKET VALUE, BY END-USER, 2020-2026 (USD BILLION)
TABLE 64. REST OF APAC DIGITAL TRANSACTION MANAGEMENT MARKET VALUE, BY SOLUTION, 2020-2026 (USD BILLION)
TABLE 65. REST OF WORLD DIGITAL TRANSACTION MANAGEMENT MARKET VALUE, BY COMPONENT, 2020-2026 (USD BILLION)
TABLE 66. REST OF WORLD DIGITAL TRANSACTION MANAGEMENT MARKET VALUE, BY END-USER, 2020-2026 (USD BILLION)
TABLE 67. REST OF WORLD DIGITAL TRANSACTION MANAGEMENT MARKET VALUE, BY SOLUTION, 2020-2026 (USD BILLION)
TABLE 68. ADOBE: FINANCIALS
TABLE 69. ADOBE: PRODUCTS & SERVICES
TABLE 70. ADOBE: RECENT DEVELOPMENTS
TABLE 71. DOCUSIGN INC.: FINANCIALS
TABLE 72. DOCUSIGN INC.: PRODUCTS & SERVICES
TABLE 73. DOCUSIGN INC.: RECENT DEVELOPMENTS
TABLE 74. ENTRUST DATACARD CORPORATION.: FINANCIALS
TABLE 75. ENTRUST DATACARD CORPORATION.: PRODUCTS & SERVICES
TABLE 76. ENTRUST DATACARD CORPORATION.: RECENT DEVELOPMENTS
TABLE 77. NINTEX GLOBAL LTD.: FINANCIALS
TABLE 78. NINTEX GLOBAL LTD.: PRODUCTS & SERVICES
TABLE 79. NINTEX GLOBAL LTD.: RECENT DEVELOPMENTS
TABLE 80. ASCERTIA: FINANCIALS
TABLE 81. ASCERTIA: PRODUCTS & SERVICES
TABLE 82. ASCERTIA: RECENT DEVELOPMENTS
TABLE 83. DOCUFIRST: FINANCIALS
TABLE 84. DOCUFIRST: PRODUCTS & SERVICES
TABLE 85. DOCUFIRST: RECENT DEVELOPMENTS
TABLE 86. EORIGINAL INC: FINANCIALS
TABLE 87. EORIGINAL INC: PRODUCTS & SERVICES
TABLE 88. EORIGINAL INC: RECENT DEVELOPMENTS
TABLE 89. THINKSMART: FINANCIALS
TABLE 90. THINKSMART: PRODUCTS & SERVICES
TABLE 91. THINKSMART: RECENT DEVELOPMENTS
TABLE 92. NAMIRIAL SPA: FINANCIALS
TABLE 93. NAMIRIAL SPA: PRODUCTS & SERVICES
TABLE 94. NAMIRIAL SPA: RECENT DEVELOPMENTS
Research Framework
Infoholic Research works on a holistic 360° approach in order to deliver high quality, validated and reliable information in our market reports. The Market estimation and forecasting involves following steps:
- Data Collation (Primary & Secondary)
- In-house Estimation (Based on proprietary data bases and Models)
- Market Triangulation
- Forecasting

Market related information is congregated from both primary and secondary sources.
Primary sources
Involved participants from all global stakeholders such as Solution providers, service providers, Industry associations, thought leaders etc. across levels such as CXOs, VPs and managers. Plus, our in-house industry experts having decades of industry experience contribute their consulting and advisory services.
Secondary sources
Include public sources such as regulatory frameworks, government IT spending, government demographic indicators, industry association statistics, and company publications along with paid sources such as Factiva, OneSource, Bloomberg among others.
![]()


