
Dental Imaging Market By Product (Extraoral Imaging Systems, and Intraoral Imaging Systems), By Application (Implantology, Endodontics, Oral & Maxillofacial Surgery, Orthodontics, and Other Applications), By End User (Dental Hospitals & Clinics, Dental Diagnostic Centers, and Dental Academic & Research Institute), By Geography (North America, Europe, APAC, and RoW) Global Opportunity Analysis and Industry Forecast up to 2026
- August, 2020
- Domain: Healthcare - Diagnostics
- Get Free 10% Customization in this Report
Dental imaging is a sophisticated procedure that entirely depends on the extent of radiation penetrating through the dental structures. Radiation hits the film and strikes a picture that helps our medical practitioner study the reason behind the matter or pain, including early tooth decay, gum disease, abscesses, and abnormal growths. The dental imaging market also includes intraoral & extraoral X-ray systems along with digital technology, and these are swiftly penetrating the market and taking the place of analog systems. Therefore, which are the main driving forces of its demand.
Research Methodology:
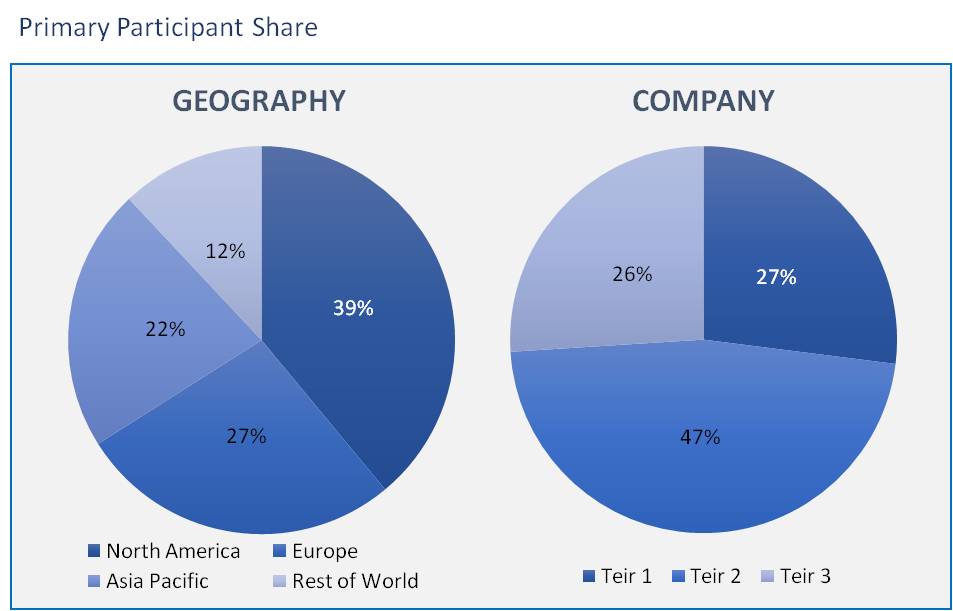
The dental imaging market has been analyzed by utilizing the optimum combination of secondary sources and in-house methodology, along with an irreplaceable blend of primary insights. The real-time assessment of the market is an integral part of our market sizing and forecasting methodology. Our industry experts and panel of primary participants have helped in compiling relevant aspects with realistic parametric estimations for a comprehensive study. The participation share of different categories of primary participants is given below:
In the current world scenario-where, the main focus on technological advancements has risen-it is anticipated that the advantages of advanced dental imaging can guarantee its larger adoption within the years to come back. The rising demand for dentistry, the growing affordability of imaging systems, and also the want for fast and accurate diagnosis are the major factors driving the expansion of this market
Some of the major players in the domain of Dental Imaging are Envista Holdings Corporation, DENTSPLY Sirona, Inc., PLANMECA OY, Carestream Dental, LLC, VATECH Co., Ltd, General Co., Ltd, Inc, Apteryx Imaging, Inc, ACTEON Group, Owandy Radiology, J. MORITA CORP, Align Technology, and Midmark Corporation.
On the bases of types of products, the market is segmented into:
- Extraoral
- Intraoral
The intraoral scanner segment is expected to rise at the highest growth rate during the forecast period, propelled by the advantages of capturing direct dental impressions, reducing the cost of restoration remakes, and providing overall advanced clinical workflows. The intraoral imaging systems segment is further categorized into intraoral X-ray systems, intraoral PSP systems, intraoral sensors, intraoral scanners, and intraoral cameras.
Considering the market segments based on the application, the market is divided into:
- Implantology
- Endodontics
- Oral & maxillofacial surgery
- Orthodontics
The implantology segment managed the largest share of the market in 2019. The Driving force of this segment can be attributed to the growing adoption of dental implants, increasing number of bone-graft assessments, and rising focus on the evaluation of post-treatment cases.
Focusing on the end-users based market segmentation the market is broadly classified into:
- Dental hospitals & Clinics
- Dental diagnostic institutes
- Dental academic & Research centers
Dental hospitals & clinics are assumed to own the highest growth rate during the estimated period. The high growth rate of this end-user segment can be accredited to the inexpensive advanced dental imaging systems, growing consciousness among patients and increasing demand for quick and precise patient diagnosis and treatment planning.
The geographical spread of this market can be classified into:
- North America,
- Europe,
- The Asia Pacific, and
- The rest of the world.
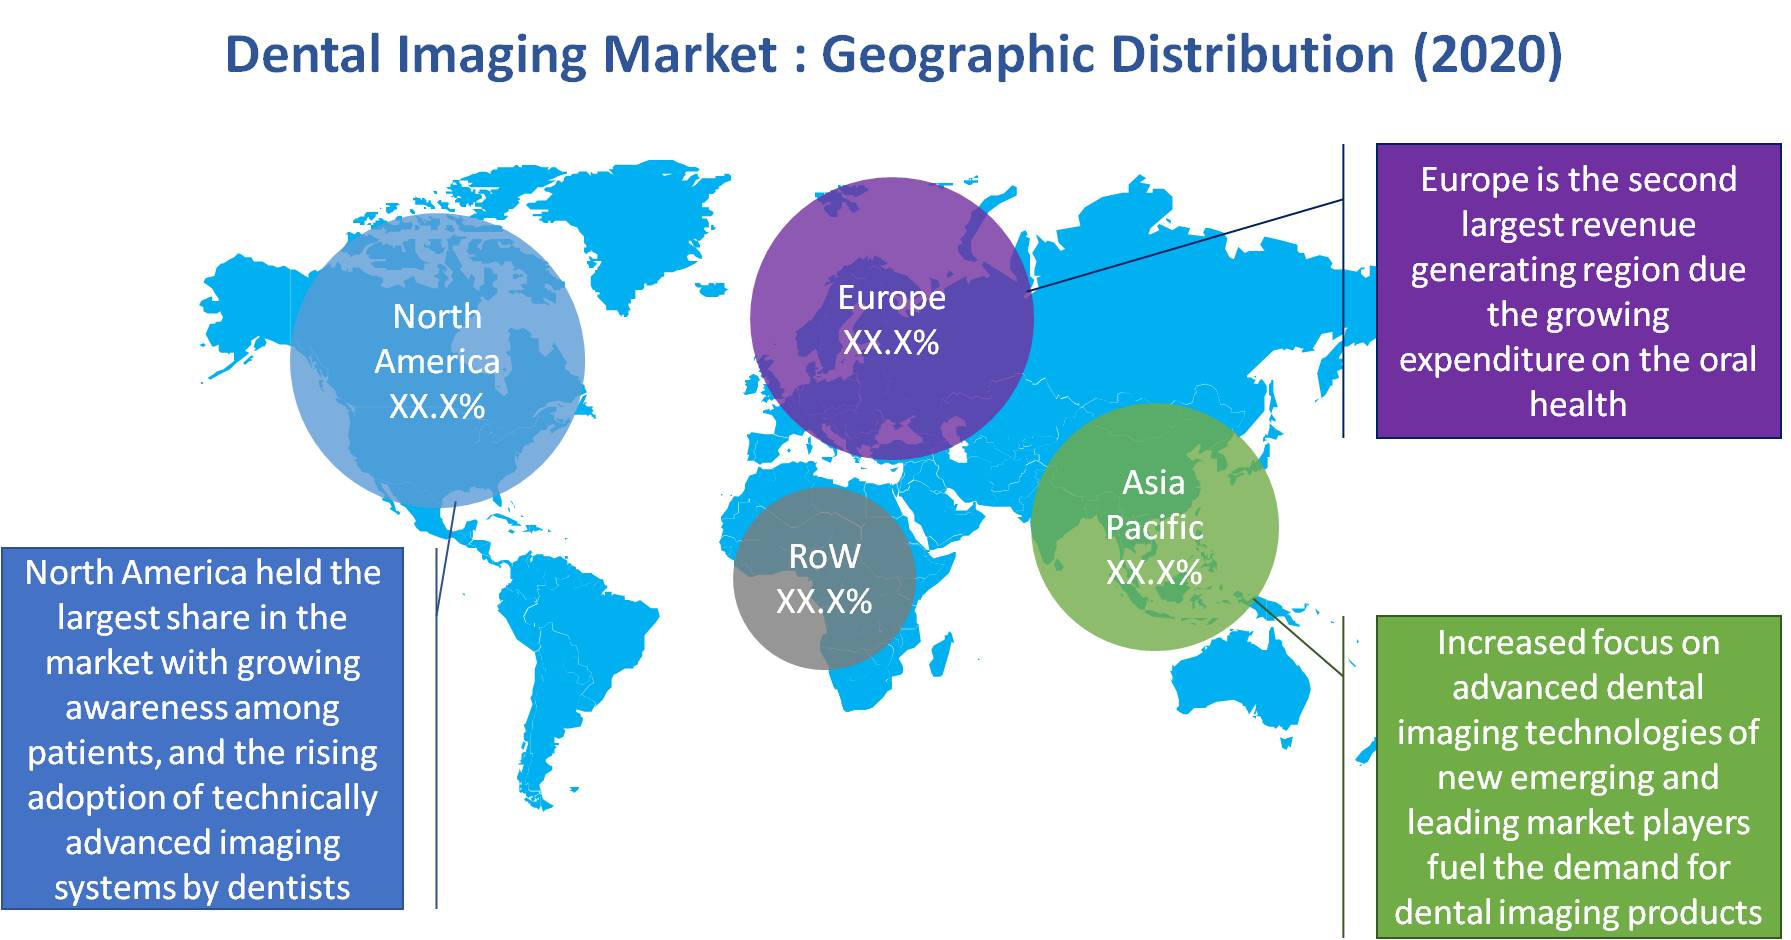 Among all the regions, North America held the largest share of the market in 2019. Many factors are responsible for their leadership in the market as the existing number of players in the dental imaging market, increasing awareness among patients, and the rising adoption of technically advanced imaging systems by dentists. On the other hand, the Asia Pacific region witnessed the highest growth, which is due to factors such as the increased focus of new emerging and leading market players on developing Asian markets, a rise in cash flows, more relaxed regulatory policies, and growing dental tourism market.
The estimated market value of Dental Imaging in 2020 is $2.81 billion, and it is projected to grow at a CAGR of 8.2% in the coming years and predicted to reach a value of $4.51 billion in 2026. There are many important factors which are the driving forces behind the growth of Dental Imaging market:
- Advanced technological tools
- Growing demand for Dental Practices and Rising Dental Expenditure
- Rising need for Cosmetic Dentistry
- The drastic increase in Dental Caries and Other Periodontal Diseases
There are a lot of opportunities from emerging countries, and this report will help in understanding the present market dynamics, changing requirements, and innovations that might be needed to make the user experience enriching.
- This report would be the foundation for any research on the Dental Imaging, vendor capabilities, SWOT of the sensors, and organized framework for data analysis for further advanced innovation.
- This piece of the report would be the chief support for extensive research and a tool for the forthcoming innovations and technologies. This provides an analysis of the major players in the market, their competition, and the survivability, with which a player can compete in the market.
- The report contains insights regarding upcoming technological innovations and advanced solutions for the Dental Imaging.
1. Executive Summary
2. Industry Outlook
2.1. Industry Overview
2.2. Industry Trends
3. Market Snapshot
3.1. Market Defination
3.2. Market Outlook
3.2.1. PEST Analysis
3.2.2. Porter Five Forces
3.3. Related Markets
4. Market Outlook
4.1. Overview
4.2. Market Trends and Impact
4.3. Advantages/Disadvantages of Market
4.4. Regulatory Impact
4.5. Market Offering
4.6. Market Segmentation
4.7. Market Dynamics
4.7.1. Drivers
4.7.2. Restraints
4.7.3. Opportunities
4.8. DRO - Impact Analysis
5. Product: Market Size & Analysis
5.1. Overview
5.2. Extraoral Imaging Systems
5.2.1. Panoramic Systems
5.2.2. Panoramic & Cephalometric Systems
5.2.3. 3D CBCT Systems
5.3. Intraoral Imaging Systems
5.3.1. Intraoral Scanners
5.3.2. Intraoral X-ray Systems
5.3.3. Intraoral Sensors
5.3.4. Intraoral PSP Systems
5.3.5. Intraoral Cameras
6. Application: Market Size & Analysis
6.1. Overview
6.2. Implantology
6.3. Endodontics
6.4. Oral & Maxillofacial Surgery
6.5. Orthodontics
6.6. Other
7. Vertical: Market Size & Analysis
7.1. Overview
7.2. Dental Hospitals & Clinics
7.3. Dental Diagnostic Centers
7.4. Dental Academic & Research Institutes
8. Geography: Market Size & Analysis
8.1. Overview
8.2. North America
8.3. Europe
8.4. Asia Pacific
8.5. Rest of the World
9. Competitive Landscape
9.1. Competitor Comparison Analysis
9.2. Market Developments
9.2.1. Mergers and Acquisitions, Legal, Awards, Partnerships
9.2.2. Product Launches and execution
10. Vendor Profiles
10.1. Envista Holdings Corporation
10.1.1. Overview
10.1.2. Product Offerings
10.1.3. Geographic Revenue
10.1.4. Business Units
10.1.5. Developments
10.1.6. Business Strategy
10.2. DENTSPLY Sirona, Inc
10.2.1. Overview
10.2.2. Product Offerings
10.2.3. Geographic Revenue
10.2.4. Business Units
10.2.5. Developments
10.2.6. Business Strategy
10.3. PLANMECA OY
10.3.1. Overview
10.3.2. Product Offerings
10.3.3. Geographic Revenue
10.3.4. Business Units
10.3.5. Developments
10.3.6. Business Strategy
10.4. Carestream Dental, LLC
10.4.1. Overview
10.4.2. Product Offerings
10.4.3. Geographic Revenue
10.4.4. Business Units
10.4.5. Developments
10.4.6. Business Strategy
10.5. VATECH Co., Ltd
10.5.1. Overview
10.5.2. Product Offerings
10.5.3. Geographic Revenue
10.5.4. Business Units
10.5.5. Developments
10.5.6. Business Strategy
10.6. General Co., Ltd
10.6.1. Overview
10.6.2. Product Offerings
10.6.3. Geographic Revenue
10.6.4. Business Units
10.6.5. Developments
10.6.6. Business Strategy
10.7. Align Technology, Inc
10.7.1. Overview
10.7.2. Product Offerings
10.7.3. Geographic Revenue
10.7.4. Business Units
10.7.5. Developments
10.7.6. Business Strategy
10.8. Apteryx Imaging, Inc
10.8.1. Overview
10.8.2. Product Offerings
10.8.3. Geographic Revenue
10.8.4. Business Units
10.8.5. Developments
10.8.6. Business Strategy
10.9. ACTEON Group
10.9.1. Overview
10.9.2. Product Offerings
10.9.3. Geographic Revenue
10.9.4. Business Units
10.9.5. Developments
10.9.6. Business Strategy
10.10. Owandy Radiology
10.10.1. Overview
10.10.2. Product Offerings
10.10.3. Geographic Revenue
10.10.4. Business Units
10.10.5. Developments
10.10.6. Business Strategy
11. Companies to Watch
11.1. J. MORITA CORP
11.1.1. Overview
11.1.2. Market
11.1.3. Business Strategy
11.2. Midmark Corporation
11.2.1. Overview
11.2.2. Market
11.2.3. Business Strategy
11.3. DURR DENTAL SE
11.3.1. Overview
11.3.2. Market
11.3.3. Business Strategy
11.4. FONA Italy
11.4.1. Overview
11.4.2. Market
11.4.3. Business Strategy
11.5. 3Shape A/S
11.5.1. Overview
11.5.2. Market
11.5.3. Business Strategy
11.6. Ningbo Runyes Medical Instrument Co. Ltd
11.6.1. Overview
11.6.2. Market
11.6.3. Business Strategy
11.7. Asahi Roentgen Ind. Co., Ltd
11.7.1. Overview
11.7.2. Market
11.7.3. Business Strategy
11.8. Cefla S.C
11.8.1. Overview
11.8.2. Market
11.8.3. Business Strategy
11.9. Yoshida Dental MFG. Co. Ltd
11.9.1. Overview
11.9.2. Market
11.9.3. Business Strategy
11.10. Prexion, Inc
11.10.1. Overview
11.10.2. Market
11.10.3. Business Strategy
12. Analyst Opinion
13. Annexure
13.1. Report Scope
13.2. Market Definitions
13.3. Research Methodology
13.3.1. Data Collation and In-house Estimation
13.3.2. Market Triangulation
13.3.3. Forecasting
13.4. Report Assumptions
13.5. Declarations
13.6. Stakeholders
13.7. Abbreviations
TABLE 1. GLOBAL DENTAL IMAGING MARKET VALUE, BY PRODUCT, 2020-2026 (USD BILLION)
TABLE 2. GLOBAL DENTAL IMAGING MARKET VALUE, BY EXTRAORAL IMAGING SYSTEMS, 2020-2026
(USD BILLION)
TABLE 3. GLOBAL DENTAL IMAGING MARKET VALUE FOR PANORAMIC & CEPHALOMETRIC SYSTEMS,
BY GEOGRAPHY 2020-2026 (USD BILLION)
TABLE 4. GLOBAL DENTAL IMAGING MARKET VALUE FOR PANORAMIC SYSTEMS, BY GEOGRAPHY,
2020-2026 (USD BILLION)
TABLE 5. GLOBAL DENTAL IMAGING MARKET VALUE FOR PANORAMIC & CEPHALOMETRIC SYSTEMS,
BY GEOGRAPHY, 2020-2026 (USD BILLION)
TABLE 6. GLOBAL DENTAL IMAGING MARKET VALUE FOR 3D CBCT SYSTEMS, BY GEOGRAPHY, 2020-
2026 (USD BILLION)
TABLE 7. GLOBAL DENTAL IMAGING MARKET VALUE, BY INTRAORAL IMAGING SYSTEMS, 2020-2026
(USD BILLION)
TABLE 8. GLOBAL DENTAL IMAGING MARKET VALUE FOR INTRAORAL SCANNERS, BY GEOGRAPHY
2020-2026 (USD BILLION)
TABLE 9. GLOBAL DENTAL IMAGING MARKET VALUE FOR INTRAORAL X-RAY SYSTEMS, BY GEOGRAPHY
2020-2026 (USD BILLION)
TABLE 10. GLOBAL DENTAL IMAGING MARKET VALUE FOR INTRAORAL SENSORS, BY GEOGRAPHY 2020-
2026 (USD BILLION)
TABLE 11. GLOBAL DENTAL IMAGING MARKET VALUE FOR INTRAORAL PSP SYSTEMS, BY GEOGRAPHY
2020-2026 (USD BILLION)
TABLE 12. GLOBAL DENTAL IMAGING MARKET VALUE FOR INTRAORAL CAMERAS, BY GEOGRAPHY 2020-
2026 (USD BILLION)
TABLE 13. GLOBAL DENTAL IMAGING MARKET VALUE, BY APPLICATION, 2020-2026 (USD BILLION)
TABLE 14. GLOBAL DENTAL IMAGING MARKET VALUE FOR IMPLANTOLOGY, BY GEOGRAPHY 2020-2026
(USD BILLION)
TABLE 15. GLOBAL DENTAL IMAGING MARKET VALUE FOR ENDODONTICS, BY GEOGRAPHY, 2020-2026
(USD BILLION)
TABLE 16. GLOBAL DENTAL IMAGING MARKET VALUE FOR ORAL & MAXILLOFACIAL SURGERY, BY
GEOGRAPHY, 2020-2026 (USD BILLION)
TABLE 17. GLOBAL DENTAL IMAGING MARKET VALUE FOR ORTHODONTICS, BY GEOGRAPHY, 2020-2026
(USD BILLION)
TABLE 18. GLOBAL DENTAL IMAGING MARKET VALUE FOR OTHER, BY GEOGRAPHY 2020-2026 (USD
BILLION)
TABLE 19. GLOBAL DENTAL IMAGING MARKET VALUE, BY END USER, 2020-2026 (USD BILLION)
TABLE 20. GLOBAL DENTAL IMAGING MARKET VALUE FOR DENTAL HOSPITALS & CLINICS, BY
GEOGRAPHY 2020-2026 (USD BILLION)
TABLE 21. GLOBAL DENTAL IMAGING MARKET VALUE FOR DENTAL DIAGNOSTIC CENTERS, BY
GEOGRAPHY, 2020-2026 (USD BILLION)
TABLE 22. GLOBAL DENTAL IMAGING MARKET VALUE FOR DENTAL ACADEMIC & RESEARCH
INSTITUTES, BY GEOGRAPHY, 2020-2026 (USD BILLION)
TABLE 23. GLOBAL DENTAL IMAGING MARKET VALUE, BY GEOGRAPHY, 2020-2026 (USD BILLION)
TABLE 24. GLOBAL DENTAL IMAGING MARKET VALUE, BY PRODUCT, 2020-2026 (USD BILLION)
TABLE 25. GLOBAL DENTAL IMAGING MARKET VALUE, BY APPLICATION, 2020-2026 (USD BILLION)
TABLE 26. GLOBAL DENTAL IMAGING MARKET VALUE, BY END USER, 2020-2026 (USD BILLION)
TABLE 27. NORTH AMERICA DENTAL IMAGING MARKET VALUE, BY COUNTRY, 2020-2026 (USD
MILLION)
TABLE 28. NORTH AMERICA DENTAL IMAGING MARKET VALUE, BY PRODUCT, 2020-2026 (USD
MILLION)
TABLE 29. NORTH AMERICA DENTAL IMAGING MARKET VALUE FOR APPLICATION, BY GEOGRAPHY,
2020-2026 (USD MILLION)
TABLE 30. NORTH AMERICA DENTAL IMAGING MARKET VALUE FOR END-USER, BY GEOGRAPHY, 2020-
2026 (USD MILLION)
TABLE 31. U.S DENTAL IMAGING MARKET VALUE, BY PRODUCT, 2020-2026 (USD MILLION)
TABLE 32. U.S DENTAL IMAGING MARKET VALUE FOR APPLICATION, BY GEOGRAPHY, 2020-2026 (USD
MILLION)
TABLE 33. U.S DENTAL IMAGING MARKET VALUE FOR END-USER, BY GEOGRAPHY, 2020-2026 (USD
MILLION)
TABLE 34. CANADA DENTAL IMAGING MARKET VALUE, BY PRODUCT, 2020-2026 (USD MILLION)
TABLE 35. CANADA DENTAL IMAGING MARKET VALUE FOR APPLICATION, BY GEOGRAPHY, 2020-2026
(USD MILLION)
TABLE 36. CANADA DENTAL IMAGING MARKET VALUE FOR END-USER, BY GEOGRAPHY, 2020-2026
(USD MILLION)
TABLE 37. EUROPE DENTAL IMAGING MARKET VALUE, BY COUNTRY, 2020-2026 (USD MILLION)
TABLE 38. EUROPE DENTAL IMAGING MARKET VALUE, BY PRODUCT, 2020-2026 (USD MILLION)
TABLE 39. EUROPE DENTAL IMAGING MARKET VALUE FOR APPLICATION, BY GEOGRAPHY, 2020-2026
(USD MILLION)
TABLE 40. EUROPE DENTAL IMAGING MARKET VALUE FOR END-USER, BY GEOGRAPHY, 2020-2026
(USD MILLION)
TABLE 41. GERMANY DENTAL IMAGING MARKET VALUE, BY PRODUCT, 2020-2026 (USD MILLION)
TABLE 42. GERMANY DENTAL IMAGING MARKET VALUE FOR APPLICATION, BY GEOGRAPHY, 2020-2026
(USD MILLION)
TABLE 43. GERMANY DENTAL IMAGING MARKET VALUE FOR END-USER, BY GEOGRAPHY, 2020-2026
(USD MILLION)
TABLE 44. U.K DENTAL IMAGING MARKET VALUE, BY PRODUCT, 2020-2026 (USD MILLION)
TABLE 45. U.K DENTAL IMAGING MARKET VALUE FOR APPLICATION, BY GEOGRAPHY, 2020-2026 (USD
MILLION)
TABLE 46. U.S DENTAL IMAGING MARKET VALUE FOR END-USER, BY GEOGRAPHY, 2020-2026 (USD
MILLION)
TABLE 47. FRANCE DENTAL IMAGING MARKET VALUE, BY PRODUCT, 2020-2026 (USD MILLION)
TABLE 48. FRANCE DENTAL IMAGING MARKET VALUE FOR APPLICATION, BY GEOGRAPHY, 2020-2026
(USD MILLION)
TABLE 49. FRANCE DENTAL IMAGING MARKET VALUE FOR END-USER, BY GEOGRAPHY, 2020-2026 (USD
MILLION)
TABLE 50. ITALY DENTAL IMAGING MARKET VALUE, BY PRODUCT, 2020-2026 (USD MILLION)
TABLE 51. ITALY DENTAL IMAGING MARKET VALUE FOR APPLICATION, BY GEOGRAPHY, 2020-2026
(USD MILLION)
TABLE 52. ITALY DENTAL IMAGING MARKET VALUE FOR END-USER, BY GEOGRAPHY, 2020-2026 (USD
MILLION)
TABLE 53. ROE DENTAL IMAGING MARKET VALUE, BY PRODUCT, 2020-2026 (USD MILLION)
TABLE 54. ROE DENTAL IMAGING MARKET VALUE FOR APPLICATION, BY GEOGRAPHY, 2020-2026 (USD
MILLION)
TABLE 55. ROE DENTAL IMAGING MARKET VALUE FOR END-USER, BY GEOGRAPHY, 2020-2026 (USD
MILLION)
TABLE 56. ASIA PACIFIC DENTAL IMAGING MARKET VALUE, BY COUNTRY, 2020-2026 (USD MILLION)
TABLE 57. ASIA PACIFIC DENTAL IMAGING MARKET VALUE, BY PRODUCT, 2020-2026 (USD MILLION)
TABLE 58. ASIA PACIFIC DENTAL IMAGING MARKET VALUE FOR APPLICATION, BY GEOGRAPHY, 2020-
2026 (USD MILLION)
TABLE 59. ASIA PACIFIC DENTAL IMAGING MARKET VALUE FOR END-USER, BY GEOGRAPHY, 2020-2026
(USD MILLION)
TABLE 60. CHINA DENTAL IMAGING MARKET VALUE, BY PRODUCT, 2020-2026 (USD MILLION)
TABLE 61. CHINA DENTAL IMAGING MARKET VALUE FOR APPLICATION, BY GEOGRAPHY, 2020-2026
(USD MILLION)
TABLE 62. CHINA DENTAL IMAGING MARKET VALUE FOR END-USER, BY GEOGRAPHY, 2020-2026 (USD
MILLION)
TABLE 63. INDIA DENTAL IMAGING MARKET VALUE, BY PRODUCT, 2020-2026 (USD MILLION)
TABLE 64. INDIA DENTAL IMAGING MARKET VALUE FOR APPLICATION, BY GEOGRAPHY, 2020-2026
(USD MILLION)
TABLE 65. INDIA DENTAL IMAGING MARKET VALUE FOR END-USER, BY GEOGRAPHY, 2020-2026 (USD
MILLION)
TABLE 66. JAPAN DENTAL IMAGING MARKET VALUE, BY PRODUCT, 2020-2026 (USD MILLION)
TABLE 67. JAPAN DENTAL IMAGING MARKET VALUE FOR APPLICATION, BY GEOGRAPHY, 2020-2026
(USD MILLION)
TABLE 68. JAPAN DENTAL IMAGING MARKET VALUE FOR END-USER, BY GEOGRAPHY, 2020-2026 (USD
MILLION)
TABLE 69. AUSTRALIA DENTAL IMAGING MARKET VALUE, BY PRODUCT, 2020-2026 (USD MILLION)
TABLE 70. AUSTRALIA DENTAL IMAGING MARKET VALUE FOR APPLICATION, BY GEOGRAPHY, 2020-
2026 (USD MILLION)
TABLE 71. AUSTRALIA DENTAL IMAGING MARKET VALUE FOR END-USER, BY GEOGRAPHY, 2020-2026
(USD MILLION)
TABLE 72. REST OF ASIA PACIFIC DENTAL IMAGING MARKET VALUE, BY PRODUCT, 2020-2026 (USD
MILLION)
TABLE 73. REST OF ASIA PACIFIC DENTAL IMAGING MARKET VALUE FOR APPLICATION, BY
GEOGRAPHY, 2020-2026 (USD MILLION)
TABLE 74. REST OF ASIA PACIFIC DENTAL IMAGING MARKET VALUE FOR END-USER, BY GEOGRAPHY,
2020-2026 (USD MILLION)
TABLE 75. REST OF WORLD DENTAL IMAGING MARKET VALUE, BY PRODUCT, 2020-2026 (USD
MILLION)
TABLE 76. REST OF WORLD DENTAL IMAGING MARKET VALUE FOR APPLICATION, BY GEOGRAPHY,
2020-2026 (USD MILLION)
TABLE 77. REST OF WORLD DENTAL IMAGING MARKET VALUE FOR END-USER, BY GEOGRAPHY, 2020-
2026 (USD MILLION)
TABLE 78. ENVISTA HOLDINGS CORPORATION: OVERVIEW
TABLE 79. ENVISTA HOLDINGS CORPORATION: STRATEGIC SNAPSHOT
TABLE 80. ENVISTA HOLDINGS CORPORATION: BUSINESS OPPORTUNITIES AND OUTLOOK
TABLE 81. ENVISTA HOLDINGS CORPORATION: PRODUCT/SERVICE PORTFOLIO
TABLE 82. DENTSPLY SIRONA, INC: OVERVIEW
TABLE 83. DENTSPLY SIRONA, INC: STRATEGIC SNAPSHOT
TABLE 84. DENTSPLY SIRONA, INC: BUSINESS OPPORTUNITIES AND OUTLOOK
TABLE 85. DENTSPLY SIRONA, INC: PRODUCT/SERVICE PORTFOLIO
TABLE 86. PLANMECA OY: OVERVIEW
TABLE 87. PLANMECA OY: STRATEGIC SNAPSHOT
TABLE 88. PLANMECA OY: BUSINESS OPPORTUNITIES AND OUTLOOK
TABLE 89. PLANMECA OY: PRODUCT/SERVICE PORTFOLIO
TABLE 90. CARESTREAM DENTAL, LLC: OVERVIEW
TABLE 91. CARESTREAM DENTAL, LLC: STRATEGIC SNAPSHOT
TABLE 92. CARESTREAM DENTAL, LLC: BUSINESS OPPORTUNITIES AND OUTLOOK
TABLE 93. CARESTREAM DENTAL, LLC: PRODUCT/SERVICE PORTFOLIO
TABLE 94. VATECH CO., LTD: OVERVIEW
TABLE 95. VATECH CO., LTD: STRATEGIC SNAPSHOT
TABLE 96. VATECH CO., LTD: BUSINESS OPPORTUNITIES AND OUTLOOK
TABLE 97. VATECH CO., LTD: PRODUCT/SERVICE PORTFOLIO
TABLE 98. GENERAL CO., LTD: OVERVIEW
TABLE 99. GENERAL CO., LTD: STRATEGIC SNAPSHOT
TABLE 100. GENERAL CO., LTD: BUSINESS OPPORTUNITIES AND OUTLOOK
TABLE 101. GENERAL CO., LTD: PRODUCT/SERVICE PORTFOLIO
TABLE 102. ALIGN TECHNOLOGY, INC: OVERVIEW
TABLE 103. ALIGN TECHNOLOGY, INC: STRATEGIC SNAPSHOT
TABLE 104. ALIGN TECHNOLOGY, INC: BUSINESS OPPORTUNITIES AND OUTLOOK
TABLE 105. ALIGN TECHNOLOGY, INC: PRODUCT/SERVICE PORTFOLIO
TABLE 106. APTERYX IMAGING, INC: OVERVIEW
TABLE 107. APTERYX IMAGING, INC: STRATEGIC SNAPSHOT
TABLE 108. APTERYX IMAGING, INC: BUSINESS OPPORTUNITIES AND OUTLOOK
TABLE 109. APTERYX IMAGING, INC: PRODUCT/SERVICE PORTFOLIO
TABLE 110. ACTEON GROUP: OVERVIEW
TABLE 111. ACTEON GROUP: STRATEGIC SNAPSHOT
TABLE 112. ACTEON GROUP: BUSINESS OPPORTUNITIES AND OUTLOOK
TABLE 113. ACTEON GROUP: PRODUCT/SERVICE PORTFOLIO
TABLE 114. OWANDY RADIOLOGY: OVERVIEW
TABLE 115. OWANDY RADIOLOGY: STRATEGIC SNAPSHOT
TABLE 116. OWANDY RADIOLOGY: BUSINESS OPPORTUNITIES AND OUTLO
TABLE 117. OWANDY RADIOLOGY: PRODUCT/SERVICE PORTFOLIO
Research Framework
Infoholic Research works on a holistic 360° approach in order to deliver high quality, validated and reliable information in our market reports. The Market estimation and forecasting involves following steps:
- Data Collation (Primary & Secondary)
- In-house Estimation (Based on proprietary data bases and Models)
- Market Triangulation
- Forecasting

Market related information is congregated from both primary and secondary sources.
Primary sources
Involved participants from all global stakeholders such as Solution providers, service providers, Industry associations, thought leaders etc. across levels such as CXOs, VPs and managers. Plus, our in-house industry experts having decades of industry experience contribute their consulting and advisory services.
Secondary sources
Include public sources such as regulatory frameworks, government IT spending, government demographic indicators, industry association statistics, and company publications along with paid sources such as Factiva, OneSource, Bloomberg among others.
![]()


