
Biodegradable Plastics Market By Type (Starch Based, PLA, PHA, PBAT and PBS) By End Users (Packaging, Agriculture, Consumer Goods and others) and By Geography – Global Driver, Restraints, Opportunities, Trends, and Forecast to 2023
- November, 2018
- Domain: Chemicals, Materials & Food - Petrochemicals,Specialty Chemicals
- Get Free 10% Customization in this Report
The plastics which can decompose naturally in the environment are termed as biodegradable plastics. These are manufactured from petrochemicals as well as from natural sources such as orange peel, corn starch, and plants. Out of total plastics produced in the world only a small fraction (<10%) of which is biodegradable.
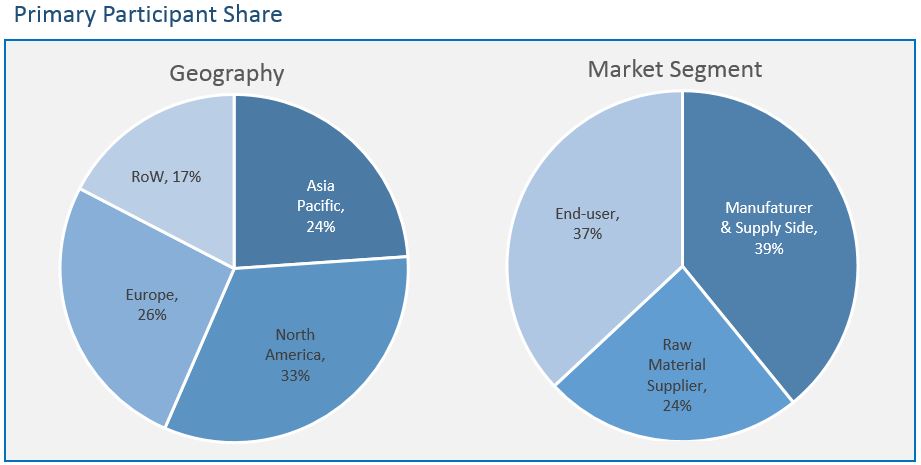
Research Methodology
The biodegradable plastics market has been analyzed by utilizing the optimum combination of secondary sources and in-house methodology along with an irreplaceable blend of primary insights. The real-time assessment of the market is an integral part of our market sizing and forecasting methodology. Our industry experts and panel of primary participants have helped us in compiling relevant aspects with realistic parametric estimations for a comprehensive study. The participation share of different categories of primary participants is given below:
Key Market Insights
Biodegradable plastics are widely utilized in various applications like packaging, agriculture, consumer goods, and others. The manufacturers are focusing towards innovation to capture more of the market share. The demand for biodegradable plastics is increasing owing to the increased awareness about environment and reducing the plastic waste.
The increasing awareness across the globe, especially developed regions along with increasing environmental protection efforts from the governments is pushing the growth of biodegradable plastics. On the other hand, growing economies and increasing per capita income along with technological innovations to bring down the prices are making biodegradable plastics more and more affordable & efficient. The evolution of new enzymes to degrade commodity polymers and upgrade of older biodegradable plastic with enhanced properties is expanding the application areas providing additional growth opportunities to the market.
Europe dominates the market currently and is also expected to grow during the forecast period due to intense demand. Asia Pacific is expected to accelerate in the market during the forecast period. Some of the prominent key players in the biodegradable plastics market are Arkema, BASF, Corbion, DowDuPont, and Cargill.
Types:
- Starch-based
- PLA
- PBS
- PBAT
- PHA
- Others
End Users:
- Packaging
- Agriculture
- Consumer Goods
- Others
Geography:
- Asia Pacific
- North America
- Europe
- Rest of the World
1 Executive Summary
1.1 Europe has the Highest Dominance in the Biodegradable Plastics Market
1.2 By End Users, Alcohol Dominates the Market
2 Market Positioning
2.1 Industry Snapshot
2.1.1 Industry Overview
2.1.2 Key Trends
2.2 Related Market
3 Market Outlook
3.1 Introduction
3.2 Value Chain Analysis
3.3 Market Segmentation
4 Market Characteristics
4.1 PESTLE Analysis
4.2 Porter’s Five Force Analysis
4.3 Market Dynamics
4.3.1 Drivers
4.3.1.1 Growing automotive and packaging industry
4.3.1.2 Increased demand from Asia Pacific
4.3.2 Restraints
4.3.2.1 Low penetration in underdeveloped countries
4.3.2.2 Availability of cheaper alternatives
4.3.3 Opportunities
4.3.3.1 Large untapped market in developing and underdeveloped countries
4.3.3.2 Increasing government regulations
4.3.4 DRO – Impact Analysis
4.4 Patent Analysis
5 Biodegradable Plastics, By Type
5.1 Overview
5.2 Starch-based
5.3 PLA
5.4 PBS
5.5 PBAT
5.6 PHA
6 Biodegradable Plastics, By End Users
6.1 Overview
6.2 Packaging
6.3 Agriculture
6.4 Consumer Goods
7 Biodegradable Plastics, By Geography
7.1 Overview
7.2 Asia Pacific
7.2.1 Asia Pacific Biodegradable Plastics Market, By Country
7.2.2 Asia Pacific Biodegradable Plastics Market, By Type
7.2.3 Asia Pacific Biodegradable Plastics Market, By End Users
7.3 North America
7.3.1 North America Biodegradable Plastics Market, By Country
7.3.2 North America Biodegradable Plastics Market, By Type
7.3.3 North America Biodegradable Plastics Market, By End Users
7.4 Europe
7.4.1 Europe Biodegradable Plastics Market, By Country
7.4.2 Europe Biodegradable Plastics Market, By Type
7.4.3 Europe Biodegradable Plastics Market, By End Users
7.5 Rest of the World
7.5.1 Rest of the World Biodegradable Plastics Market, By Region
7.5.2 Rest of the World Biodegradable Plastics Market, By Type
7.5.3 Rest of the World Biodegradable Plastics Market, By End Users
8 Competitive Landscape
8.1 Competitive Regional Exposure Analysis
8.2 Market Developments
8.2.1 Agreement
8.2.2 Exhibitions & Events
8.2.3 Merger, Acquisition & Joint Venture
8.2.4 Expansions
8.2.5 Linear Integration
8.2.6 Product Launch
9 Vendor Profiles
9.1 BASF SE
9.1.1 Overview
9.1.2 Product Profile
9.1.3 Business Units
9.1.4 Geographic Revenue
9.1.5 Recent Developments
9.2 Novamont S.p.A.
9.2.1 Overview
9.2.2 Product Profile
9.2.3 Business Units
9.2.4 Geographic Revenue
9.2.5 Recent Developments
9.3 Corbion
9.3.1 Overview
9.3.2 Product Profile
9.3.3 Business Units
9.3.4 Geographic Revenue
9.3.5 Recent Developments
9.4 Cargill
9.4.1 Overview
9.4.2 Product Profile
9.4.3 Business Units
9.4.4 Geographic Revenue
9.4.5 Recent Developments
9.5 NatureWorks LLC
9.5.1 Overview
9.5.2 Product Profile
9.5.3 Business Units
9.5.4 Geographic Revenue
9.5.5 Recent Developments
10 Customers Profile
10.1 UFP Technologies
10.1.1 Overview
10.1.2 Product Profile
10.1.3 SWOT Analysis
10.1.4 Business Strategies
10.2 Fiat Chrysler Automobiles N.V. (FCA)
10.2.1 Overview
10.2.2 Subsidiaries
10.2.3 SWOT Analysis
10.2.4 Business Strategies
10.3 General Electric (GE)
10.3.1 Overview
10.3.2 Product Profile
10.3.3 SWOT Analysis
10.3.4 Business Strategies
10.4 Toyota Motor Corporation
10.4.1 Overview
10.4.2 Product Profile
10.4.3 SWOT Analysis
10.4.4 Business Strategies
10.5 Philips
10.5.1 Overview
10.5.2 Product Profile
10.5.3 SWOT Analysis
10.5.4 Business Strategies
11 Companies to Watch for
11.1 BASF SE
11.1.1 BASF striving towards R&D
12 Annexure
12.1 Report Scope
12.2 Market Definition
12.3 Research Methodology
12.3.1 Data Collation & In-house Estimation
12.3.2 Market Triangulation
12.3.3 Forecasting
12.4 Study Declarations
12.5 Report Assumptions
12.6 Stakeholders
12.7 Abbreviations
TABLE 1 GLOBAL BIODEGRADABLE PLASTICS MARKET VALUE, BY TYPE, 2016–2023 ($MILLION)
TABLE 2 GLOBAL BIODEGRADABLE PLASTICS MARKET VOLUME, BY TYPE, 2016–2023 (KILOTONS)
TABLE 3 GLOBAL STARCH BASED IN BIODEGRADABLE PLASTICS MARKET VALUE, BY GEOGRAPHY, 2016–2023 ($MILLION)
TABLE 4 GLOBAL STARCH BASED IN BIODEGRADABLE PLASTICS MARKET VOLUME, BY GEOGRAPHY, 2016–2023 (KILOTONS)
TABLE 5 GLOBAL PLS IN BIODEGRADABLE PLASTICS MARKET VALUE, BY GEOGRAPHY, 2016–2023 ($MILLION)
TABLE 6 GLOBAL PLS IN BIODEGRADABLE PLASTICS MARKET VOLUME, BY GEOGRAPHY, 2016–2023 (KILOTONS)
TABLE 7 GLOBAL PBS IN BIODEGRADABLE PLASTICS MARKET VALUE, BY GEOGRAPHY, 2016–2023 ($MILLION)
TABLE 8 GLOBAL PBS IN BIODEGRADABLE PLASTICS MARKET VOLUME, BY GEOGRAPHY, 2016–2023 (KILOTONS)
TABLE 9 GLOBAL PBAT IN BIODEGRADABLE PLASTICS MARKET VALUE, BY GEOGRAPHY, 2016–2023 ($MILLION)
TABLE 10 GLOBAL PBAT IN BIODEGRADABLE PLASTICS MARKET VOLUME, BY GEOGRAPHY, 2016–2023 (KILOTONS)
TABLE 11 GLOBAL PHA IN BIODEGRADABLE PLASTICS MARKET VALUE, BY GEOGRAPHY, 2016–2023 ($MILLION)
TABLE 12 GLOBAL PHA IN BIODEGRADABLE PLASTICS MARKET VOLUME, BY GEOGRAPHY, 2016–2023 (KILOTONS)
TABLE 13 GLOBAL BIODEGRADABLE PLASTICS VALUE, BY END USERS, 2016–2023 ($MILLION)
TABLE 14 GLOBAL BIODEGRADABLE PLASTICS MARKET VOLUME, BY END USERS, 2016–2023 (KILOTONS)
TABLE 15 GLOBAL BIODEGRADABLE PLASTICS IN PACKAGING MARKET VALUE, BY GEOGRAPHY, 2016–2023 ($MILLION)
TABLE 16 GLOBAL BIODEGRADABLE PLASTICS IN PACKAGING MARKET VOLUME, BY GEOGRAPHY, 2016–2023 (KILOTONS)
TABLE 17 GLOBAL BIODEGRADABLE P-LASTICS IN AGRICULTURE MARKET VALUE, BY GEOGRAPHY, 2016–2023 ($MILLION)
TABLE 18 GLOBAL BIODEGRADABLE PLASTICS IN AGRICULTURE MARKET VOLUME, BY GEOGRAPHY, 2016–2023 (KILOTONS)
TABLE 19 GLOBAL BIODEGRADABLE PLASTICS IN CONSUMER GOODS MARKET VALUE, BY GEOGRAPHY, 2016–2023 ($MILLION)
TABLE 20 GLOBAL BIODEGRADABLE PLASTICS IN CONSUMER GOODS MARKET VOLUME, BY GEOGRAPHY, 2016–2023 (KILOTONS)
TABLE 21 GLOBAL POLYMER FOAM MARKET VALUE, BY GEOGRAPHY, 2016–2023 ($MILLION)
TABLE 22 GLOBAL BIODEGRADABLE PLASTICS MARKET VOLUME, BY GEOGRAPHY, 2016–2023 (KILOTONS)
TABLE 23 ASIA PACIFIC BIODEGRADABLE PLASTICS MARKET VALUE, BY GEOGRAPHY, 2016–2023 ($MILLION)
TABLE 24 ASIA PACIFIC BIODEGRADABLE PLASTICS MARKET VOLUME, BY GEOGRAPHY, 2016–2023 (KILOTONS)
TABLE 25 ASIA PACIFIC BIODEGRADABLE PLASTICS MARKET VALUE, BY TYPE, 2016–2023 ($MILLION)
TABLE 26 ASIA PACIFIC BIODEGRADABLE PLASTICS MARKET VOLUME, BY TYPE, 2016–2023 (KILOTONS)
TABLE 27 ASIA PACIFIC BIODEGRADABLE PLASTICS MARKET VALUE, BY END USERS, 2016–2023 ($MILLION)
TABLE 28 ASIA PACIFIC BIODEGRADABLE PLASTICS MARKET VOLUME, BY APPLICATION, 2016–2023 (KILOTONS)
TABLE 29 NORTH AMERICA BIODEGRADABLE PLASTICS MARKET VALUE, BY GEOGRAPHY, 2016–2023 ($MILLION)
TABLE 30 NORTH AMERICA BIODEGRADABLE PLASTICS MARKET VOLUME, BY GEOGRAPHY, 2016–2023 (KILOTONS)
TABLE 31 NORTH AMERICA BIODEGRADABLE PLASTICS MARKET VALUE, BY TYPE, 2016–2023 ($MILLION)
TABLE 32 NORTH AMERICA BIODEGRADABLE PLASTICS MARKET VOLUME, BY TYPE, 2016–2023 (KILOTONS)
TABLE 33 NORTH AMERICA BIODEGRADABLE PLASTICS MARKET VALUE, BY END USERS, 2016–2023 ($MILLION)
TABLE 34 NORTH AMERICA BIODEGRADABLE PLASTICS MARKET VOLUME, BY END USERS, 2016–2023 (KILOTONS)
TABLE 35 EUROPE BIODEGRADABLE PLASTICS MARKET VALUE, BY GEOGRAPHY, 2016–2023 ($MILLION)
TABLE 36 EUROPE BIODEGRADABLE PLASTICS MARKET VOLUME, BY GEOGRAPHY, 2016–2023 (KILOTONS)
TABLE 37 EUROPE BIODEGRADABLE PLASTICS MARKET VALUE, BY TYPE, 2016–2023 ($MILLION)
TABLE 38 EUROPE BIODEGRADABLE PLASTICS MARKET VOLUME, BY TYPE, 2016–2023 (KILOTONS)
TABLE 39 EUROPE BIODEGRADABLE PLASTICS MARKET VALUE, BY PRODUCT, 2016–2023 ($MILLION)
TABLE 40 EUROPE BIODEGRADABLE PLASTICS MARKET VOLUME, BY PRODUCT, 2016–2023 (KILOTONS)
TABLE 41 REST OF THE WORLD BIODEGRADABLE PLASTICS MARKET VALUE, BY GEOGRAPHY, 2016–2023 ($MILLION)
TABLE 42 REST OF THE WORLD BIODEGRADABLE PLASTICS MARKET VOLUME, BY GEOGRAPHY, 2016–2023 (KILOTONS)
TABLE 43 REST OF THE WORLD BIODEGRADABLE PLASTICS MARKET VALUE, BY TYPE, 2016–2023 ($MILLION)
TABLE 44 REST OF THE WORLD BIODEGRADABLE PLASTICS MARKET VOLUME, BY TYPE, 2016–2023 (KILOTONS)
TABLE 45 REST OF THE WORLD BIODEGRADABLE PLASTICS MARKET VALUE, BY END USERS, 2016–2023 ($MILLION)
TABLE 46 REST OF THE WORLD BIODEGRADABLE PLASTICS MARKET VOLUME, BY END USERS, 2016–2023 (KILOTONS)
TABLE 47 MERGER & ACQUISITION, 2013–2017
TABLE 48 EXPANSIONS, 2013–2017
TABLE 49 PRODUCT LAUNCHES, 2013–2017
TABLE 50 BASF: PRODUCT PROFILE
TABLE 51 BASF: RECENT DEVELOPMENTS
TABLE 52 ARKEMA: PRODUCT PROFILE
TABLE 53 ARKEMA: RECENT DEVELOPMENTS
TABLE 54 CORBION: PRODUCT PROFILE
TABLE 55 CORBION: RECENT DEVELOPMENTS
TABLE 56 CARGILL: PRODUCT PROFILE
TABLE 57 DOW CHEMICALS: RECENT DEVELOPMENTS
TABLE 58 DOWDUPONT: PRODUCT PROFILE
TABLE 59 DOWDUPONT: RECENT DEVELOPMENTS
TABLE 60 UPF TECHNOLOGIES: PRODUCT PROFILE
TABLE 61 FIAT CHRYSLER AUTOMOBILES N.V. (FCA): SUBSIDIARIES
TABLE 62 GENERAL ELECTRIC (GE): PRODUCT PROFILE
TABLE 63 TOYOTA: PRODUCT PROFILE
TABLE 64 PHILIPS: PRODUCT PROFILE
TABLE 65 BASF: PRODUCT PROFILE
Research Framework
Infoholic Research works on a holistic 360° approach in order to deliver high quality, validated and reliable information in our market reports. The Market estimation and forecasting involves following steps:
- Data Collation (Primary & Secondary)
- In-house Estimation (Based on proprietary data bases and Models)
- Market Triangulation
- Forecasting

Market related information is congregated from both primary and secondary sources.
Primary sources
Involved participants from all global stakeholders such as Solution providers, service providers, Industry associations, thought leaders etc. across levels such as CXOs, VPs and managers. Plus, our in-house industry experts having decades of industry experience contribute their consulting and advisory services.
Secondary sources
Include public sources such as regulatory frameworks, government IT spending, government demographic indicators, industry association statistics, and company publications along with paid sources such as Factiva, OneSource, Bloomberg among others.
![]()


