
Augmented Reality Automotive Market by Function (Standard AR HUD, AR HUD based Navigation, AR HUD based Adaptive Cruise Control and AR HUD based Lane Departure Warning), Sensor Technology (Radar, Lidar, CCD/CMOS Image Sensor and Sensor Fusion), Level of Autonomous Driving (Conventional and Semi-autonomous) and Geography – Global Forecast to 2026
- May, 2021
- Domain: ICT - digital technologies
- Get Free 10% Customization in this Report
Augmented reality (AR) is a technology that delivers a real-time vision of the actual world where factors are intensified by computer-generated input such as audio, video, or graphics. In the automobile sector, the augmented reality system is another advancement in an automotive heads-up display (HUD) and other guidance on developing complete autonomous vehicle technology. Novel advancements in display glass technology have progressively enhanced the augmented reality automotive market. The increasing preference for advanced driving support systems for consumers in developed and developing regions and their growing incorporation into the latest vehicles by OEMs is significantly boosting the market. The factors such as ongoing developments in digital networks and cybersecurity threats are restraining the augmented reality automotive market growth. The Augmented Reality Automotive Market is anticipated to grow at the rate of 18.60% CAGR by 2026.
Research Methodology:
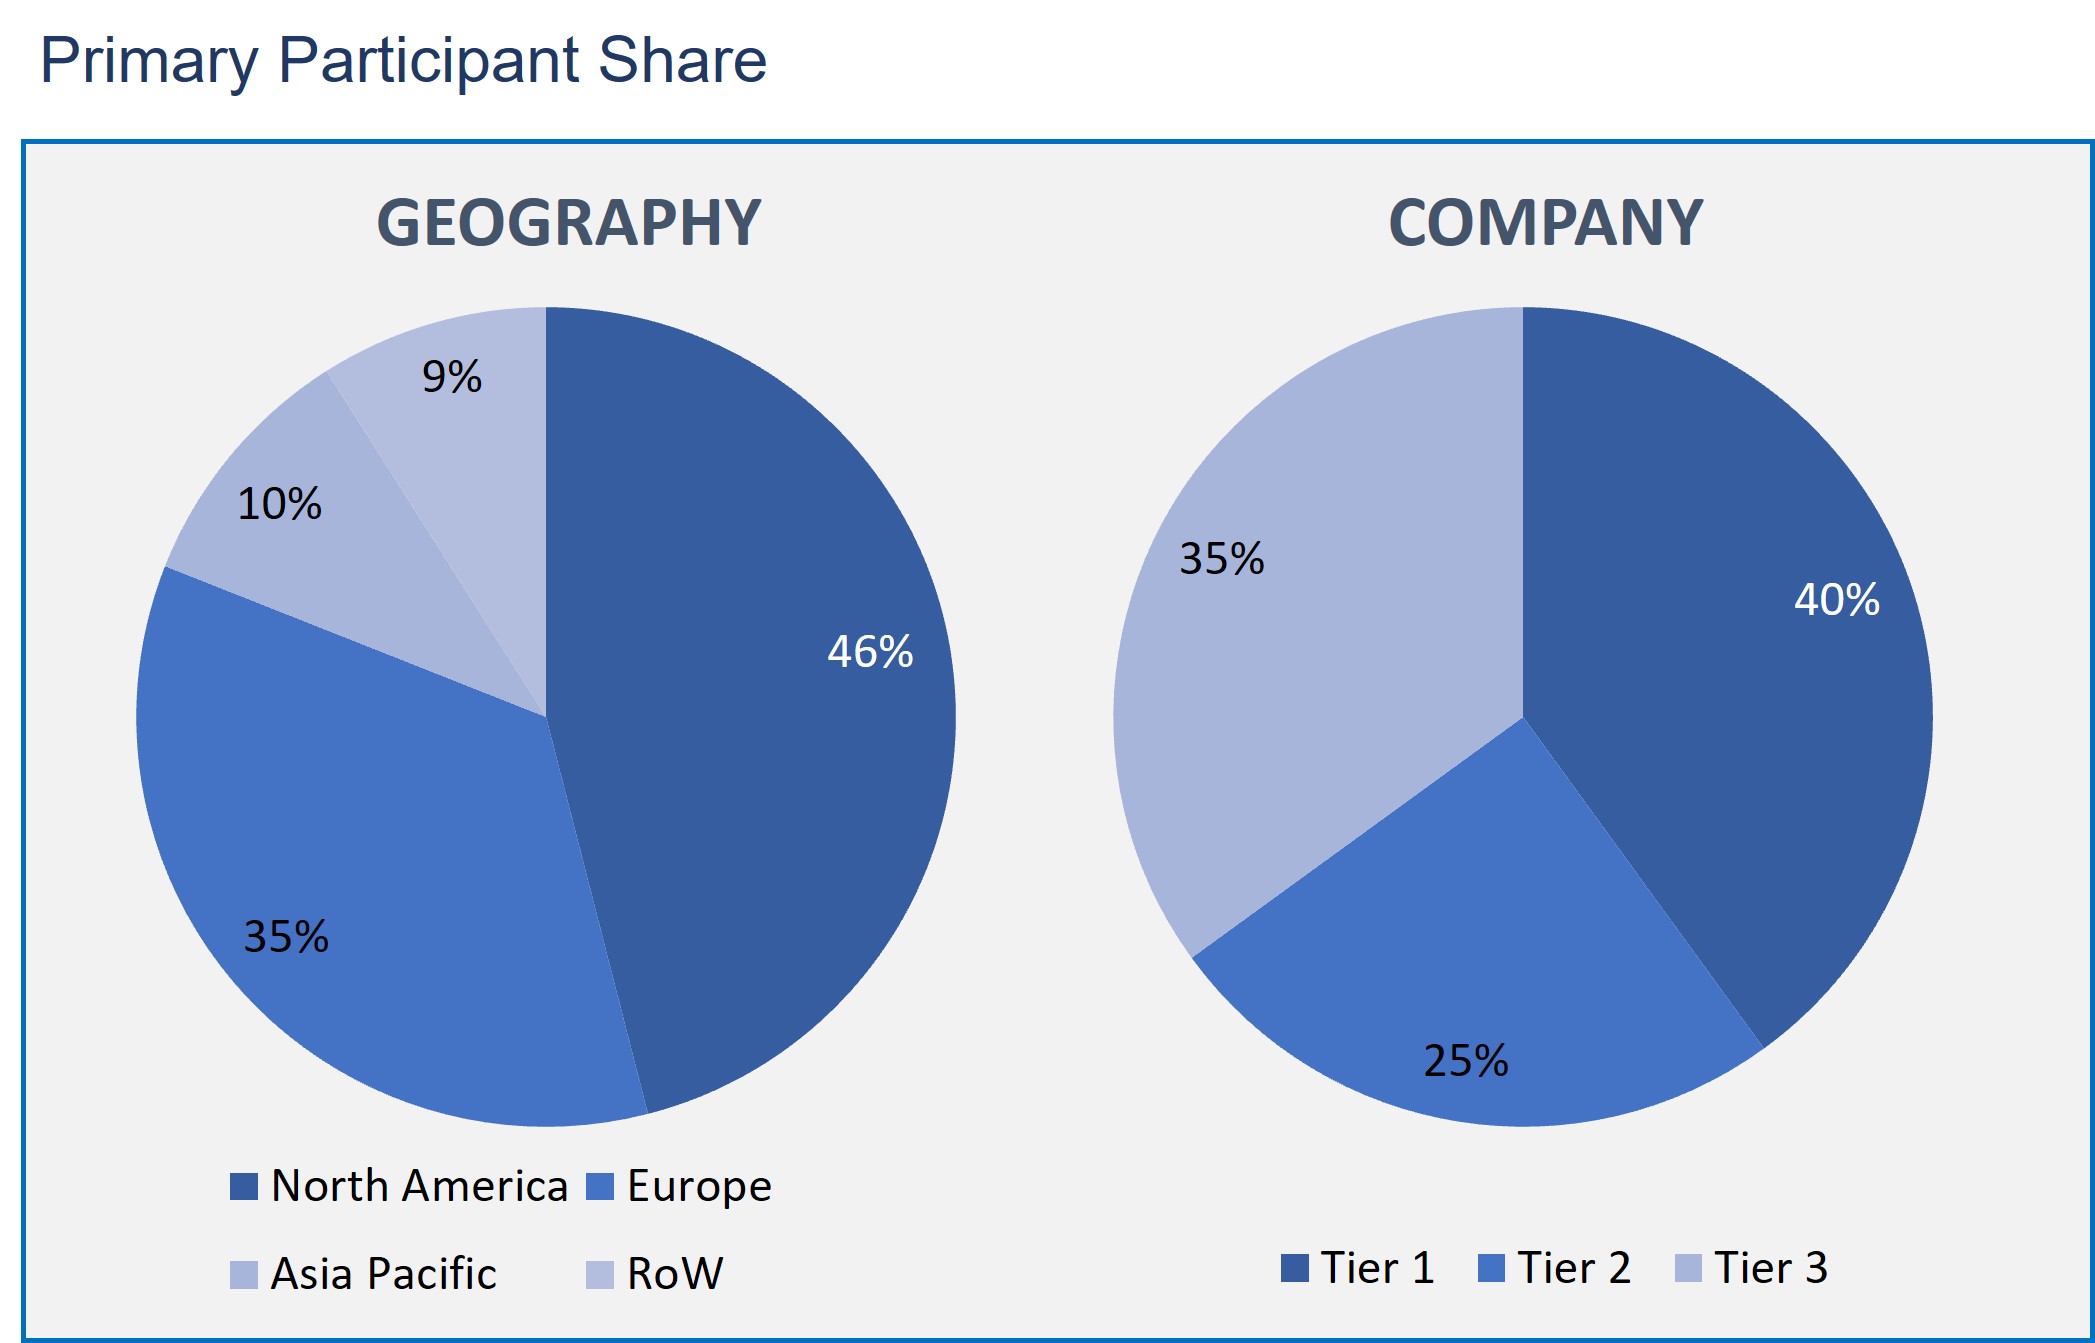
The Augmented Reality Automotive Market has been analyzed by utilizing the optimum combination of secondary sources and in-house methodology and a unique balance of primary insights. The real-time valuation of the market is an integral part of our forecasting and market sizing methodology. Industry experts and our primary participants have helped to compile related aspects with accurate parametric estimations for a complete study. The primary participants share is given below:
Augmented Reality Automotive Market by Function
- Standard AR HUD
- AR HUD based Navigation
- AR HUD based Adaptive Cruise Control
- AR HUD based Lane Departure Warning
Augmented Reality Automotive Market by Sensor Technology
- Radar
- LiDar
- CCD/CMOS Image Sensor
- Sensor Fusion
Augmented Reality Automotive Market by Level of Autonomous Driving
- Conventional
- Semi-autonomous
Augmented Reality Automotive Market by Geography
- North America
- Europe
- Asia Pacific
- Rest of the World
The standard AR HUD segment is projected to have a lucrative share in the augmented reality automotive market owing to the according to the function. This is due to the rising use of sensing technology for internal monitoring of vehicles, external environment monitoring, and safety functions. The augmented reality heads-up display lowers the driver's distraction by offering the information on the vehicle display.
The augmented reality automotive market for technology is segmented into Radar, LiDar, CCD/CMOS Image Sensor, and Sensor Fusion. Sensor fusion technology is leading the market owing to the increasing developments in semi-autonomous and autonomous vehicles. Moreover, the sensors have a prominent role in the efficient functioning of the AR HUD. Combining the sensor technologies will offer data precision for significant safety applications such as higher levels of autonomous driving, fueling the demand for sensor fusion technology.
In the market for autonomous driving, semi-autonomous driving is an emerging driving with increasing demand for semi-autonomous functions. The demand for semi-autonomous vehicles is compelled by the requirement for a more effortless and secure driving experience, giving more safety, even in most dangerous driving situations. Semi-autonomous driving capabilities, which utilize compatible cruise control and advanced sensor technologies, can assist the vehicle in giving complete information to the driver on vehicle data and the external environment.
On the basis of geography, North America is estimated to hold a substantial share. The highest share is ascribed to the early adoption of advanced technology. The augmented reality automotive functions are directly connected to the production of vehicle and rising demand for the luxurious and safe vehicles are driving the augmented reality automotive market in this region.
The global market for augmented reality automotive adoptions is commonly driven by the increase in the adoption of advanced driving support systems by original equipment manufacturers among various vehicle types and consumer preference for in-vehicle safety features that potentially control the accidents and injuries caused by the errors of human-driver. Furthermore, the market is also augmented by the rising level of driving automation and development towards fully autonomous vehicles.
The key competitors of the augmented reality automotive market are Hyundai Motor Company, Continental AG, DigiLens Inc., Harman International Industries Inc., Denso Corporation, General Motors, MicroVision, Inc., Nippon Seiki Co, Ltd, LG Business Solutions, Garmin Limited, Panasonic Corporation, Pioneer Corporation, Robert Bosch GmbH, and Texas Instruments Inc.
As a result, augmented reality is a most beneficial technology and provides secured solutions for customers worldwide. Augmented reality in the automotive industry is projected to obtain enormous customer acceptability owing to the benefits of the augmented reality integrated into vehicles.
- This report defines, describes, and estimates the augmented reality automotive market as per the volume and value.
- The report gives complete information about the significant aspects, including drivers, restraints, opportunities, and industry-specific challenges impacting the market's growth.
- This report gives the forecast of market size, based on qualitative and quantitative, of the market for four regions, namely, North America, Europe, Asia Pacific and Rest of the World.
- This report analyses the competitive edge such as mergers and acquisitions, new product launches, and expansions in the market.
- Executive Summary
- Industry Outlook
- Industry Overview
- Industry Trends
- Market Snapshot
- Total Addressable Market
- Segment Addressable Market
- PEST Analysis
- Porter Five Forces
- Related Markets
- Ecosystem
- Market Overview
- Overview
- Market Evolution
- Market Trends and Impact
- Pricing Analysis
- Market Segmentation
- Market Dynamics
- Drivers
- Restraints
- Opportunities
- DRO - Impact Analysis
- Overview
- Function: Market Size & Analysis
- Overview
- Standard AR HUD
- AR HUD based Navigation
- AR HUD based Adaptive Cruise Control
- AR HUD based Lane Departure Warning
- Sensor Technology: Market Size & Analysis
- Overview
- Radar
- LiDar
- CCD/CMOS Image Sensor
- Sensor Fusion
- Level of Autonomous Driving: Market Size & Analysis
- Overview
- Conventional
- Semi-autonomous
- Geography: Market Size & Analysis
- Overview
- North America
- Europe
- Asia Pacific
- Rest of the World
- Competitive Landscape
- Competitor Comparison Analysis
- Market Developments
- Mergers and Acquisitions, Legal, Awards, Partnerships
- Product Launches and execution
- Vendor Profiles
- Hyundai Motor Company
- Overview
- Financial Overview
- Product Offerings
- Developments
- Business Strategy
- Continental AG
- Overview
- Financial Overview
- Product Offerings
- Developments
- Business Strategy
- DigiLens Inc.
- Overview
- Financial Overview
- Product Offerings
- Developments
- Business Strategy
- Harman International Industries Inc.
- Overview
- Financial Overview
- Product Offerings
- Developments
- Business Strategy
- Denso Corporation
- Overview
- Financial Overview
- Product Offerings
- Developments
- Business Strategy
- General Motors
- Overview
- Financial Overview
- Product Offerings
- Developments
- Business Strategy
- MicroVision, Inc.
- Overview
- Financial Overview
- Product Offerings
- Developments
- Business Strategy
- Nippon Seiki Co, Ltd
- Overview
- Financial Overview
- Product Offerings
- Developments
- Business Strategy
- LG Business Solutions
- Overview
- Financial Overview
- Product Offerings
- Developments
- Business Strategy
- Garmin Limited
- Overview
- Financial Overview
- Product Offerings
- Developments
- Business Strategy
- Hyundai Motor Company
- Companies to Watch
- Panasonic Corporation
- Overview
- Products & Services
- Business Strategy
- Pioneer Corporation
- Overview
- Products & Services
- Business Strategy
- Robert Bosch GmbH
- Overview
- Products & Services
- Business Strategy
- Texas Instruments Inc.
- Overview
- Products & Services
- Business Strategy
- Panasonic Corporation
- Analyst Opinion
- Annexure
- Report Scope
- Market Definitions
- Research Methodology
- Data Collation and In-house Estimation
- Market Triangulation
- Forecasting
- Report Assumptions
- Declarations
- Stakeholders
- Abbreviations
TABLE 1. GLOBAL AUGMENTED REALITY AUTOMOTIVE MARKET VALUE, BY FUNCTION, 2020-2026 (USD BILLION)
TABLE 2. GLOBAL AUGMENTED REALITY AUTOMOTIVE MARKET VALUE FOR STANDARD AR HUD, BY GEOGRAPHY, 2020-2026 (USD BILLION)
TABLE 3. GLOBAL AUGMENTED REALITY AUTOMOTIVE MARKET VALUE FOR AR HUD BASED NAVIGATION, BY GEOGRAPHY, 2020-2026 (USD BILLION)
TABLE 4. GLOBAL AUGMENTED REALITY AUTOMOTIVE MARKET VALUE FOR AR HUD BASED ADAPTIVE CRUISE CONTROL, BY GEOGRAPHY, 2020-2026 (USD BILLION)
TABLE 5. GLOBAL AUGMENTED REALITY AUTOMOTIVE MARKET VALUE FOR AR HUD BASED LANE DEPARTURE WARNING, BY GEOGRAPHY, 2020-2026 (USD BILLION)
TABLE 6. GLOBAL AUGMENTED REALITY AUTOMOTIVE MARKET VALUE, BY SENSOR TECHNOLOGY, 2020-2026 (USD BILLION)
TABLE 7. GLOBAL AUGMENTED REALITY AUTOMOTIVE MARKET VALUE FOR RADAR, BY GEOGRAPHY, 2020-2026 (USD BILLION)
TABLE 8. GLOBAL AUGMENTED REALITY AUTOMOTIVE MARKET VALUE FOR LIDAR, BY GEOGRAPHY, 2020-2026 (USD BILLION)
TABLE 9. GLOBAL AUGMENTED REALITY AUTOMOTIVE MARKET VALUE FOR CCD/CMOS IMAGE SENSOR, BY GEOGRAPHY, 2020-2026 (USD BILLION)
TABLE 10. GLOBAL AUGMENTED REALITY AUTOMOTIVE MARKET VALUE FOR SENSOR FUSION, BY GEOGRAPHY, 2020-2026 (USD BILLION)
TABLE 11. GLOBAL AUGMENTED REALITY AUTOMOTIVE MARKET VALUE, BY LEVEL OF AUTONOMOUS DRIVING, 2020-2026 (USD BILLION)
TABLE 12. GLOBAL AUGMENTED REALITY AUTOMOTIVE MARKET VALUE FOR CONVENTIONAL, BY GEOGRAPHY, 2020-2026 (USD BILLION)
TABLE 13. GLOBAL AUGMENTED REALITY AUTOMOTIVE MARKET VALUE FOR SEMI-AUTONOMOUS, BY GEOGRAPHY, 2020-2026 (USD BILLION)
TABLE 14. NORTH AMERICA AUGMENTED REALITY AUTOMOTIVE MARKET VALUE, BY COUNTRY, 2020-2026 (USD BILLION)
TABLE 15. NORTH AMERICA AUGMENTED REALITY AUTOMOTIVE MARKET VALUE, BY FUNCTION, 2020-2026 (USD BILLION)
TABLE 16. NORTH AMERICA AUGMENTED REALITY AUTOMOTIVE MARKET VALUE, BY SENSOR TECHNOLOGY, 2020-2026 (USD BILLION)
TABLE 17. NORTH AMERICA AUGMENTED REALITY AUTOMOTIVE MARKET VALUE, BY LEVEL OF AUTONOMOUS DRIVING, 2020-2026 (USD BILLION)
TABLE 18. U.S AUGMENTED REALITY AUTOMOTIVE MARKET VALUE, BY FUNCTION, 2020-2026 (USD BILLION)
TABLE 19. U.S AUGMENTED REALITY AUTOMOTIVE MARKET VALUE, BY SENSOR TECHNOLOGY, 2020-2026 (USD BILLION)
TABLE 20. U.S AUGMENTED REALITY AUTOMOTIVE MARKET VALUE, BY LEVEL OF AUTONOMOUS DRIVING, 2020-2026 (USD BILLION)
TABLE 21. CANADA AUGMENTED REALITY AUTOMOTIVE MARKET VALUE, BY FUNCTION, 2020-2026 (USD BILLION)
TABLE 22. CANADA AUGMENTED REALITY AUTOMOTIVE MARKET VALUE, BY SENSOR TECHNOLOGY, 2020-2026 (USD BILLION)
TABLE 23. CANADA AUGMENTED REALITY AUTOMOTIVE MARKET VALUE, BY LEVEL OF AUTONOMOUS DRIVING, 2020-2026 (USD BILLION)
TABLE 24. EUROPE AUGMENTED REALITY AUTOMOTIVE MARKET VALUE, BY COUNTRY, 2020-2026 (USD BILLION)
TABLE 25. EUROPE AUGMENTED REALITY AUTOMOTIVE MARKET VALUE, BY FUNCTION, 2020-2026 (USD BILLION)
TABLE 26. EUROPE AUGMENTED REALITY AUTOMOTIVE MARKET VALUE, BY SENSOR TECHNOLOGY, 2020-2026 (USD BILLION)
TABLE 27. EUROPE AUGMENTED REALITY AUTOMOTIVE MARKET VALUE, LEVEL OF AUTONOMOUS DRIVING, 2020-2026 (USD BILLION)
TABLE 28. GERMANY AUGMENTED REALITY AUTOMOTIVE MARKET VALUE, BY FUNCTION, 2020-2026 (USD BILLION)
TABLE 29. GERMANY AUGMENTED REALITY AUTOMOTIVE MARKET VALUE, BY SENSOR TECHNOLOGY, 2020-2026 (USD BILLION)
TABLE 30. GERMANY AUGMENTED REALITY AUTOMOTIVE MARKET VALUE, BY LEVEL OF AUTONOMOUS DRIVING, 2020-2026 (USD BILLION)
TABLE 31. U.K AUGMENTED REALITY AUTOMOTIVE MARKET VALUE, BY FUNCTION, 2020-2026 (USD BILLION)
TABLE 32. U.K AUGMENTED REALITY AUTOMOTIVE MARKET VALUE, BY SENSOR TECHNOLOGY, 2020-2026 (USD BILLION)
TABLE 33. U.K AUGMENTED REALITY AUTOMOTIVE MARKET VALUE, BY LEVEL OF AUTONOMOUS DRIVING, 2020-2026 (USD BILLION)
TABLE 34. FRANCE AUGMENTED REALITY AUTOMOTIVE MARKET VALUE, BY FUNCTION, 2020-2026 (USD BILLION)
TABLE 35. FRANCE AUGMENTED REALITY AUTOMOTIVE MARKET VALUE, BY SENSOR TECHNOLOGY, 2020-2026 (USD BILLION)
TABLE 36. FRANCE AUGMENTED REALITY AUTOMOTIVE MARKET VALUE, BY LEVEL OF AUTONOMOUS DRIVING, 2020-2026 (USD BILLION)
TABLE 37. ITALY AUGMENTED REALITY AUTOMOTIVE MARKET VALUE, BY FUNCTION, 2020-2026 (USD BILLION)
TABLE 38. ITALY AUGMENTED REALITY AUTOMOTIVE MARKET VALUE, BY SENSOR TECHNOLOGY, 2020-2026 (USD BILLION)
TABLE 39. ITALY AUGMENTED REALITY AUTOMOTIVE MARKET VALUE, BY LEVEL OF AUTONOMOUS DRIVING, 2020-2026 (USD BILLION)
TABLE 40. SPAIN AUGMENTED REALITY AUTOMOTIVE MARKET VALUE, BY FUNCTION, 2020-2026 (USD BILLION)
TABLE 41. SPAIN AUGMENTED REALITY AUTOMOTIVE MARKET VALUE, BY SENSOR TECHNOLOGY, 2020-2026 (USD BILLION)
TABLE 42. SPAIN AUGMENTED REALITY AUTOMOTIVE MARKET VALUE, BY LEVEL OF AUTONOMOUS DRIVING, 2020-2026 (USD BILLION)
TABLE 43. ROE AUGMENTED REALITY AUTOMOTIVE MARKET VALUE, BY FUNCTION, 2020-2026 (USD BILLION)
TABLE 44. ROE AUGMENTED REALITY AUTOMOTIVE MARKET VALUE, BY SENSOR TECHNOLOGY, 2020-2026 (USD BILLION)
TABLE 45. ROE AUGMENTED REALITY AUTOMOTIVE MARKET VALUE, BY LEVEL OF AUTONOMOUS DRIVING, 2020-2026 (USD BILLION)
TABLE 46. ASIA PACIFIC AUGMENTED REALITY AUTOMOTIVE MARKET VALUE, BY COUNTRY, 2020-2026 (USD BILLION)
TABLE 47. ASIA PACIFIC AUGMENTED REALITY AUTOMOTIVE MARKET VALUE, BY FUNCTION, 2020-2026 (USD BILLION)
TABLE 48. ASIA PACIFIC AUGMENTED REALITY AUTOMOTIVE MARKET VALUE, BY SENSOR TECHNOLOGY, 2020-2026 (USD BILLION)
TABLE 49. ASIA PACIFIC AUGMENTED REALITY AUTOMOTIVE MARKET VALUE, BY LEVEL OF AUTONOMOUS DRIVING, 2020-2026 (USD BILLION)
TABLE 50. CHINA AUGMENTED REALITY AUTOMOTIVE MARKET VALUE, BY FUNCTION, 2020-2026 (USD BILLION)
TABLE 51. CHINA AUGMENTED REALITY AUTOMOTIVE MARKET VALUE, BY SENSOR TECHNOLOGY, 2020-2026 (USD BILLION)
TABLE 52. CHINA AUGMENTED REALITY AUTOMOTIVE MARKET VALUE, BY LEVEL OF AUTONOMOUS DRIVING, 2020-2026 (USD BILLION)
TABLE 53. INDIA AUGMENTED REALITY AUTOMOTIVE MARKET VALUE, BY FUNCTION, 2020-2026 (USD BILLION)
TABLE 54. INDIA AUGMENTED REALITY AUTOMOTIVE MARKET VALUE, BY SENSOR TECHNOLOGY, 2020-2026 (USD BILLION)
TABLE 55. INDIA AUGMENTED REALITY AUTOMOTIVE MARKET VALUE, BY LEVEL OF AUTONOMOUS DRIVING, 2020-2026 (USD BILLION)
TABLE 56. JAPAN AUGMENTED REALITY AUTOMOTIVE MARKET VALUE, BY FUNCTION, 2020-2026 (USD BILLION)
TABLE 57. JAPAN AUGMENTED REALITY AUTOMOTIVE MARKET VALUE, BY SENSOR TECHNOLOGY, 2020-2026 (USD BILLION)
TABLE 58. JAPAN AUGMENTED REALITY AUTOMOTIVE MARKET VALUE, BY LEVEL OF AUTONOMOUS DRIVING, 2020-2026 (USD BILLION)
TABLE 59. REST OF APAC AUGMENTED REALITY AUTOMOTIVE MARKET VALUE, BY FUNCTION, 2020-2026 (USD BILLION)
TABLE 60. REST OF APAC AUGMENTED REALITY AUTOMOTIVE MARKET VALUE, BY SENSOR TECHNOLOGY, 2020-2026 (USD BILLION)
TABLE 61. REST OF APAC AUGMENTED REALITY AUTOMOTIVE MARKET VALUE, BY LEVEL OF AUTONOMOUS DRIVING, 2020-2026 (USD BILLION)
TABLE 62. REST OF WORLD AUGMENTED REALITY AUTOMOTIVE MARKET VALUE, BY FUNCTION, 2020-2026 (USD BILLION)
TABLE 63. REST OF WORLD AUGMENTED REALITY AUTOMOTIVE MARKET VALUE, BY SENSOR TECHNOLOGY, 2020-2026 (USD BILLION)
TABLE 64. REST OF WORLD AUGMENTED REALITY AUTOMOTIVE MARKET VALUE, BY LEVEL OF AUTONOMOUS DRIVING, 2020-2026 (USD BILLION)
TABLE 65. HYUNDAI MOTOR COMPANY: FINANCIALS
TABLE 66. HYUNDAI MOTOR COMPANY: PRODUCTS & SERVICES
TABLE 67. HYUNDAI MOTOR COMPANY: RECENT DEVELOPMENTS
TABLE 68. CONTINENTAL AG: FINANCIALS
TABLE 69. CONTINENTAL AG: PRODUCTS & SERVICES
TABLE 70. CONTINENTAL AG: RECENT DEVELOPMENTS
TABLE 71. DIGILENS INC: FINANCIALS
TABLE 72. DIGILENS INC: PRODUCTS & SERVICES
TABLE 73. DIGILENS INC: RECENT DEVELOPMENTS
TABLE 74. HARMAN INTERNATIONAL INDUSTRIES INC: FINANCIALS
TABLE 75. HARMAN INTERNATIONAL INDUSTRIES INC: PRODUCTS & SERVICES
TABLE 76. HARMAN INTERNATIONAL INDUSTRIES INC: RECENT DEVELOPMENTS
TABLE 77. DENSO CORPORATION: FINANCIALS
TABLE 78. DENSO CORPORATION: PRODUCTS & SERVICES
TABLE 79. DENSO CORPORATION: RECENT DEVELOPMENTS
TABLE 80. GENERAL MOTORS: FINANCIALS
TABLE 81. GENERAL MOTORS: PRODUCTS & SERVICES
TABLE 82. GENERAL MOTORS: RECENT DEVELOPMENTS
TABLE 83. MICROVISION, INC: FINANCIALS
TABLE 84. MICROVISION, INC: PRODUCTS & SERVICES
TABLE 85. MICROVISION, INC: RECENT DEVELOPMENTS
TABLE 86. NIPPON SEIKI CO, LTD: FINANCIALS
TABLE 87. NIPPON SEIKI CO, LTD: PRODUCTS & SERVICES
TABLE 88. NIPPON SEIKI CO, LTD: RECENT DEVELOPMENTS
TABLE 89. LG BUSINESS SOLUTIONS: FINANCIALS
TABLE 90. LG BUSINESS SOLUTIONS: PRODUCTS & SERVICES
TABLE 91. LG BUSINESS SOLUTIONS: RECENT DEVELOPMENTS
TABLE 92. GARMIN LIMITED: FINANCIALS
TABLE 93. GARMIN LIMITED: PRODUCTS & SERVICES
TABLE 94. GARMIN LIMITED: RECENT DEVELOPMENTS
TABLE 95. PANASONIC CORPORATION: PRODUCTS & SERVICES
TABLE 96. PIONEER CORPORATION: PRODUCTS & SERVICES
TABLE 97. ROBERT BOSCH GMBH: PRODUCTS & SERVICES
TABLE 98. TEXAS INSTRUMENTS INC: PRODUCTS & SERVICES
Research Framework
Infoholic Research works on a holistic 360° approach in order to deliver high quality, validated and reliable information in our market reports. The Market estimation and forecasting involves following steps:
- Data Collation (Primary & Secondary)
- In-house Estimation (Based on proprietary data bases and Models)
- Market Triangulation
- Forecasting

Market related information is congregated from both primary and secondary sources.
Primary sources
Involved participants from all global stakeholders such as Solution providers, service providers, Industry associations, thought leaders etc. across levels such as CXOs, VPs and managers. Plus, our in-house industry experts having decades of industry experience contribute their consulting and advisory services.
Secondary sources
Include public sources such as regulatory frameworks, government IT spending, government demographic indicators, industry association statistics, and company publications along with paid sources such as Factiva, OneSource, Bloomberg among others.
![]()


