
Water Softeners Market by End-use (Residential, Industrial, and Municipal), Type (Salt-Based and Salt-Free Water Softeners), and Geography – Global Forecast up to 2026
- April, 2021
- Domain: Chemicals, Materials & Food - Specialty Chemicals
- Get Free 10% Customization in this Report
Water softeners decrease the calcium and magnesium levels by filtering the water through resin or zeolite, a bead-like substance covered with positively charged sodium ions. The rise in water consumption across the world is the main factor that drives the development of the global water softeners market. Also, the rise in industrial activities and world population drive the global market for water softeners. But the presence of alternative treatment technologies is anticipated to hamper the market development. Water softeners are used to break calcium and magnesium salts that make up the hard water and replace them with other softer minerals like sodium and potassium. Hard water is undesirable in many household and industrial applications as it involves more soap and leaves a dirty scum that is difficult to wash out. Furthermore, boiling hard water leads to the deposition of calcium and magnesium salts on pipes, kettles, boilers, and radiators, which can basis blockage and reduce their efficiency and may even result in bursting boilers. The Water Softeners Market is expected to grow at the rate of 8.5% CAGR by 2026.
Research Methodology:
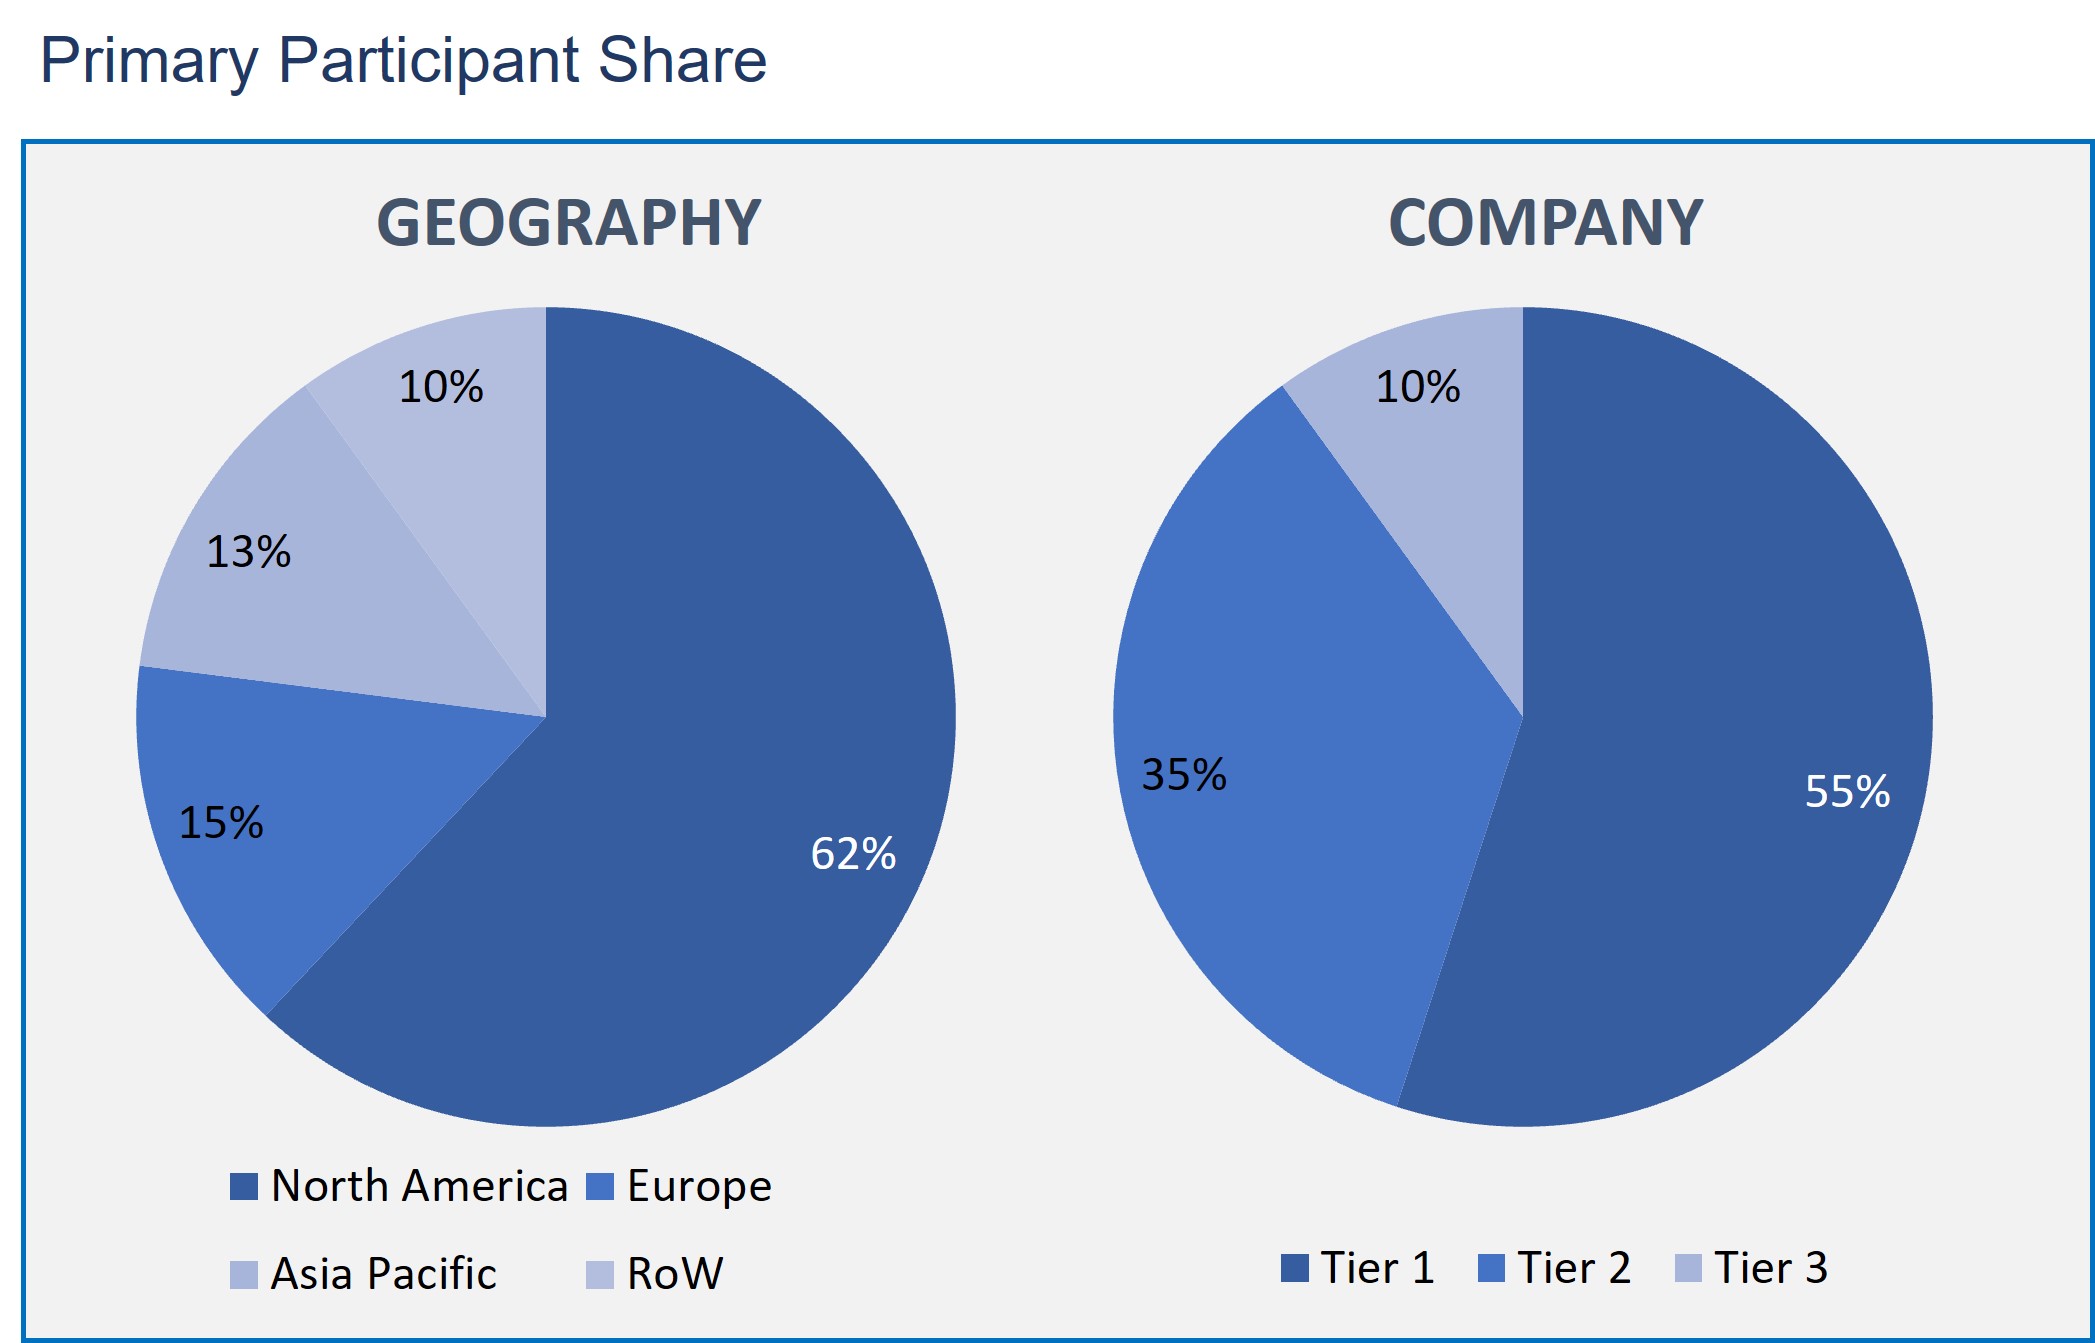
The Water Softeners Market has been analyzed by utilizing the optimum combination of secondary sources and in-house methodology and a unique balance of primary insights. The real-time valuation of the market is an integral part of our forecasting and market sizing methodology. Industry experts and our primary participants have helped to compile related aspects with accurate parametric estimations for a complete study. The primary participants share is given below:
Water Softeners Market by Type
- Salt-Free
- Salt-Based
Water Softeners Market by End User
- Residential
- Single-Family
- Multi-Family
- Industrial
- Office Buildings
- Hotel/Restaurants
- Laundries
- Hospital & Healthcare
- Others
- Municipal
- Food Processing unit
- Textile
- Chemical
- Oil & Gas
- Refineries
- Others
Water Softeners Market by Geography
- North America
- Europe
- Asia Pacific
- Rest of the World
On the basis of the Type, Salt-based water softeners hold the leading share in the global water softeners market. Salt-based water softeners have a resin bed responsible for filtering the water by exchanging hardness minerals for sodium particles. The increase in salt-based water softeners in residential applications drives the growth of the salt-based water softener market.
In terms of the End-user, the residential segment is projected to grow at the highest CAGR due to the rising implementation of water filters. The rising demand for clean and safe drinking water in residential areas boosts the water softeners market's growth.
North America is estimated to hold the highest market share due to development in the industrial sector, increasing the water demand. The frequency of water-borne diseases in this region is also generating the need for water softeners. Also, environmental obligations regarding clean water, water recycling, and reuse drive the North American water softeners market.
This report gives the profiles of companies leading the Water Softeners market: Culligan International Company, NuvoH2O, LLC, Kinetico UK Ltd, US Water System, Inc Ecowater System, LLC. The other key players include Harvey Water Softener, Ion Exchange (India) Limited, Pelican Water System, Hague Quality Water, and Canature Environment Products Co., Ltd.
- This report offers an overall analysis of the Water Softeners market growth drivers, restraints, opportunities, and other related challenges.
- This report depicts the market developments such as new product launches, mergers and acquisitions, diversification, and joint ventures of the market players.
- This report also describes all potential segments and sub-segments present in the market to help the companies in strategic business planning.
- This report also gives a regional analysis of the Water Softeners market in terms of market penetration across the world.
- Executive Summary
- Industry Outlook
- Industry Overview
- Industry Trends
- Market Snapshot
- Market Definition
- Market Outlook
- Porter Five Forces
- Related Markets
- Market characteristics
- Market Overview
- Market Segmentation
- Market Dynamics
- Drivers
- Restraints
- Opportunities
- DRO - Impact Analysis
- Product: Market Size & Analysis
- Overview
- Salt-Based
- Salt-Free
- Application: Market Size & Analysis
- Overview
- Residential
- Single-Family
- Multi-Family
- Commercial
- Office Buildings
- Hotel/Restaurants
- Laundries
- Hospital & Healthcare
- Others
- Industrial
- Food Processing unit
- Textile
- Chemical
- Oil & Gas
- Refineries
- Others
- Geography: Market Size & Analysis
- Overview
- North America
- Europe
- Asia Pacific
- Rest of the World
- Competitive Landscape
- Competitor Comparison Analysis
- Market Developments
- Mergers and Acquisitions, Legal, Awards, Partnerships
- Product Launches and execution
- Vendor Profiles
- Culligan International Company
- Overview
- Financial Overview
- Product Offerings
- Developments
- Business Strategy
- Hans Sseasrath GmbH & Co. KG
- Overview
- Financial Overview
- Product Offerings
- Developments
- Business Strategy
- Canature Water Group
- Overview
- Financial Overview
- Product Offerings
- Developments
- Business Strategy
- Fontus Water Pvt Ltd.
- Overview
- Financial Overview
- Product Offerings
- Developments
- Business Strategy
- Harvey Water Softeners Ltd
- Overview
- Financial Overview
- Product Offerings
- Developments
- Business Strategy
- Hague Quality Water International
- Overview
- Financial Overview
- Product Offerings
- Developments
- Business Strategy
- Whirlpool Corporation
- Overview
- Financial Overview
- Product Offerings
- Developments
- Business Strategy
- Pentair Residential Filtration
- Overview
- Financial Overview
- Product Offerings
- Developments
- Business Strategy
- EcoWater Systems
- Overview
- Financial Overview
- Product Offerings
- Developments
- Business Strategy
- Ion Exchange Ltd.
- Overview
- Financial Overview
- Product Offerings
- Developments
- Business Strategy
- Culligan International Company
- Companies to Watch
- Fountain Softener
- Overview
- Products & Services
- Business Strategy
- K-water Corporation
- Overview
- Products & Services
- Business Strategy
- Axel Johnson Inc.
- Overview
- Market
- Business Strategy
- KCD IP, LLC
- Overview
- Market
- Business Strategy
- Waterboss Inc.
- Overview
- Market
- Business Strategy
- MECO Incorporated
- Overview
- Market
- Business Strategy
- Fountain Softener
- Analyst Opinion
- Annexure
- Report Scope
- Market Definitions
- Research Methodology
- Data Collation and In-house Estimation
- Market Triangulation
- Forecasting
- Report Assumptions
- Declarations
- Stakeholders
- Abbreviations
TABLE 1. GLOBAL WATER SOFTENERS MARKET VALUE, BY PRODUCT, 2020-2026 (USD BILLION)
TABLE 2. GLOBAL WATER SOFTENERS MARKET VALUE FOR SALT BASED, BY GEOGRAPHY, 2020-2026 (USD BILLION)
TABLE 3. GLOBAL WATER SOFTENERS MARKET VALUE FOR SALT-FREE, BY GEOGRAPHY, 2020-2026 (USD BILLION)
TABLE 4. GLOBAL WATER SOFTENERS MARKET VALUE, BY APPLICATION, 2020-2026 (USD BILLION)
TABLE 5. GLOBAL WATER SOFTENERS MARKET VALUE FOR RESIDENTIAL, 2020-2026 (USD BILLION)
TABLE 6. GLOBAL WATER SOFTENERS MARKET VALUE FOR SINGLE FAMILY, BY TYPE, 2020-2026 (USD BILLION)
TABLE 7. GLOBAL WATER SOFTENERS MARKET VALUE FOR MULTI-FAMILY, BY TYPE, 2020-2026 (USD BILLION)
TABLE 8. GLOBAL WATER SOFTENERS MARKET VALUE FOR COMMERCIAL, BY GEOGRAPHY, 2020-2026 (USD BILLION)
TABLE 9. GLOBAL WATER SOFTENERS MARKET VALUE FOR OFFICE BUILDINGS, BY TYPE, 2020-2026 (USD BILLION)
TABLE 10. GLOBAL WATER SOFTENERS MARKET VALUE FOR HOTEL/RESTAURANTS, BY TYPE, 2020-2026 (USD BILLION)
TABLE 11. GLOBAL WATER SOFTENERS MARKET VALUE FOR LAUNDRIES, BY TYPE, 2020-2026 (USD BILLION)
TABLE 12. GLOBAL WATER SOFTENERS MARKET VALUE FOR HOSPITAL & HEALTHCARE, BY TYPE, 2020-2026 (USD BILLION)
TABLE 13. GLOBAL WATER SOFTENERS MARKET VALUE FOR OTHERS, BY TYPE, 2020-2026 (USD BILLION)
TABLE 14. GLOBAL WATER SOFTENERS MARKET VALUE FOR INDUSTRIAL, BY GEOGRAPHY, 2020-2026 (USD BILLION)
TABLE 15. GLOBAL WATER SOFTENERS MARKET VALUE FOR FOOD PROCESSING UNIT, BY TYPE, 2020-2026 (USD BILLION)
TABLE 16. GLOBAL WATER SOFTENERS MARKET VALUE FOR TEXTILE, BY TYPE, 2020-2026 (USD BILLION)
TABLE 17. GLOBAL WATER SOFTENERS MARKET VALUE FOR CHEMICAL, BY TYPE, 2020-2026 (USD BILLION)
TABLE 18. GLOBAL WATER SOFTENERS MARKET VALUE FOR OIL & GAS, BY TYPE, 2020-2026 (USD BILLION)
TABLE 19. GLOBAL WATER SOFTENERS MARKET VALUE FOR REFINERIES, BY TYPE, 2020-2026 (USD BILLION)
TABLE 20. GLOBAL WATER SOFTENERS MARKET VALUE FOR OTHERS, BY TYPE, 2020-2026 (USD BILLION)
TABLE 21. NORTH AMERICA WATER SOFTENERS MARKET VALUE, BY COUNTRY, 2020-2026 (USD BILLION)
TABLE 22. NORTH AMERICA WATER SOFTENERS MARKET VALUE, BY PRODUCT, 2020-2026 (USD BILLION)
TABLE 23. NORTH AMERICA WATER SOFTENERS MARKET VALUE, BY APPLICATION, 2020-2026 (USD BILLION)
TABLE 24. U.S WATER SOFTENERS MARKET VALUE, BY PRODUCT, 2020-2026 (USD BILLION)
TABLE 25. U.S WATER SOFTENERS MARKET VALUE, BY APPLICATION, 2020-2026 (USD BILLION)
TABLE 26. CANADA WATER SOFTENERS MARKET VALUE, BY PRODUCT, 2020-2026 (USD BILLION)
TABLE 27. CANADA WATER SOFTENERS MARKET VALUE, BY APPLICATION, 2020-2026 (USD BILLION)
TABLE 28. EUROPE WATER SOFTENERS MARKET VALUE, BY COUNTRY, 2020-2026 (USD BILLION)
TABLE 29. EUROPE WATER SOFTENERS MARKET VALUE, BY PRODUCT, 2020-2026 (USD BILLION)
TABLE 30. EUROPE WATER SOFTENERS MARKET VALUE, APPLICATION, 2020-2026 (USD BILLION)
TABLE 31. GERMANY WATER SOFTENERS MARKET VALUE, BY PRODUCT, 2020-2026 (USD BILLION)
TABLE 32. GERMANY WATER SOFTENERS MARKET VALUE, BY APPLICATION, 2020-2026 (USD BILLION)
TABLE 33. U.K WATER SOFTENERS MARKET VALUE, BY PRODUCT, 2020-2026 (USD BILLION)
TABLE 34. U.K WATER SOFTENERS MARKET VALUE, BY APPLICATION, 2020-2026 (USD BILLION)
TABLE 35. FRANCE WATER SOFTENERS MARKET VALUE, BY PRODUCT, 2020-2026 (USD BILLION)
TABLE 36. FRANCE WATER SOFTENERS MARKET VALUE, BY APPLICATION, 2020-2026 (USD BILLION)
TABLE 37. ITALY WATER SOFTENERS MARKET VALUE, BY PRODUCT, 2020-2026 (USD BILLION)
TABLE 38. ITALY WATER SOFTENERS MARKET VALUE, BY APPLICATION, 2020-2026 (USD BILLION)
TABLE 39. SPAIN WATER SOFTENERS MARKET VALUE, BY PRODUCT, 2020-2026 (USD BILLION)
TABLE 40. SPAIN WATER SOFTENERS MARKET VALUE, BY APPLICATION, 2020-2026 (USD BILLION)
TABLE 41. ROE WATER SOFTENERS MARKET VALUE, BY PRODUCT, 2020-2026 (USD BILLION)
TABLE 42. ROE WATER SOFTENERS MARKET VALUE, BY APPLICATION, 2020-2026 (USD BILLION)
TABLE 43. ASIA PACIFIC WATER SOFTENERS MARKET VALUE, BY COUNTRY, 2020-2026 (USD BILLION)
TABLE 44. ASIA PACIFIC WATER SOFTENERS MARKET VALUE, BY PRODUCT, 2020-2026 (USD BILLION)
TABLE 45. ASIA PACIFIC WATER SOFTENERS MARKET VALUE, BY APPLICATION, 2020-2026 (USD BILLION)
TABLE 46. CHINA WATER SOFTENERS MARKET VALUE, BY PRODUCT, 2020-2026 (USD BILLION)
TABLE 47. CHINA WATER SOFTENERS MARKET VALUE, BY APPLICATION, 2020-2026 (USD BILLION)
TABLE 48. INDIA WATER SOFTENERS MARKET VALUE, BY PRODUCT, 2020-2026 (USD BILLION)
TABLE 49. INDIA WATER SOFTENERS MARKET VALUE, BY APPLICATION, 2020-2026 (USD BILLION)
TABLE 50. JAPAN WATER SOFTENERS MARKET VALUE, BY PRODUCT, 2020-2026 (USD BILLION)
TABLE 51. JAPAN WATER SOFTENERS MARKET VALUE, BY APPLICATION, 2020-2026 (USD BILLION)
TABLE 52. REST OF APAC WATER SOFTENERS MARKET VALUE, BY PRODUCT, 2020-2026 (USD BILLION)
TABLE 53. REST OF APAC WATER SOFTENERS MARKET VALUE, BY APPLICATION, 2020-2026 (USD BILLION)
TABLE 54. REST OF WORLD WATER SOFTENERS MARKET VALUE, BY PRODUCT, 2020-2026 (USD BILLION)
TABLE 55. REST OF WORLD WATER SOFTENERS MARKET VALUE, BY APPLICATION, 2020-2026 (USD BILLION)
TABLE 56. CULLIGAN INTERNATIONAL COMPANY: FINANCIALS
TABLE 57. CULLIGAN INTERNATIONAL COMPANY: PRODUCTS & SERVICES
TABLE 58. CULLIGAN INTERNATIONAL COMPANY: RECENT DEVELOPMENTS
TABLE 59. HANS SSEASRATH GMBH & CO. KG: FINANCIALS
TABLE 60. HANS SSEASRATH GMBH & CO. KG: PRODUCTS & SERVICES
TABLE 61. HANS SSEASRATH GMBH & CO. KG: RECENT DEVELOPMENTS
TABLE 62. CANATURE WATER GROUP: FINANCIALS
TABLE 63. CANATURE WATER GROUP: PRODUCTS & SERVICES
TABLE 64. CANATURE WATER GROUP: RECENT DEVELOPMENTS
TABLE 65. FONTUS WATER PVT LTD: FINANCIALS
TABLE 66. FONTUS WATER PVT LTD: PRODUCTS & SERVICES
TABLE 67. FONTUS WATER PVT LTD: RECENT DEVELOPMENTS
TABLE 68. HARVEY WATER SOFTENERS LTD: FINANCIALS
TABLE 69. HARVEY WATER SOFTENERS LTD: PRODUCTS & SERVICES
TABLE 70. HARVEY WATER SOFTENERS LTD: RECENT DEVELOPMENTS
TABLE 71. HAGUE QUALITY WATER INTERNATIONAL: FINANCIALS
TABLE 72. HAGUE QUALITY WATER INTERNATIONAL: PRODUCTS & SERVICES
TABLE 73. HAGUE QUALITY WATER INTERNATIONAL: RECENT DEVELOPMENTS
TABLE 74. WHIRLPOOL CORPORATION: FINANCIALS
TABLE 75. WHIRLPOOL CORPORATION: PRODUCTS & SERVICES
TABLE 76. WHIRLPOOL CORPORATION: RECENT DEVELOPMENTS
TABLE 77. PENTAIR RESIDENTIAL FILTRATION: FINANCIALS
TABLE 78. PENTAIR RESIDENTIAL FILTRATION: PRODUCTS & SERVICES
TABLE 79. PENTAIR RESIDENTIAL FILTRATION: RECENT DEVELOPMENTS
TABLE 80. ECOWATER SYSTEMS: FINANCIALS
TABLE 81. ECOWATER SYSTEMS: PRODUCTS & SERVICES
TABLE 82. ECOWATER SYSTEMS: RECENT DEVELOPMENTS
TABLE 83. ION EXCHANGE LTD: FINANCIALS
TABLE 84. ION EXCHANGE LTD: PRODUCTS & SERVICES
TABLE 85. ION EXCHANGE LTD: RECENT DEVELOPMENTS
TABLE 86. FOUNTAIN SOFTENER: PRODUCTS & SERVICES
TABLE 87. K-WATER CORPORATION: PRODUCTS & SERVICES
TABLE 88. AXEL JOHNSON INC: PRODUCTS & SERVICES
TABLE 89. KCD IP, LLC: PRODUCTS & SERVICES
TABLE 90. WATERBOSS INC: PRODUCTS & SERVICES
TABLE 91. MECO INCORPORATED: PRODUCTS & SERVICES
Research Framework
Infoholic Research works on a holistic 360° approach in order to deliver high quality, validated and reliable information in our market reports. The Market estimation and forecasting involves following steps:
- Data Collation (Primary & Secondary)
- In-house Estimation (Based on proprietary data bases and Models)
- Market Triangulation
- Forecasting

Market related information is congregated from both primary and secondary sources.
Primary sources
Involved participants from all global stakeholders such as Solution providers, service providers, Industry associations, thought leaders etc. across levels such as CXOs, VPs and managers. Plus, our in-house industry experts having decades of industry experience contribute their consulting and advisory services.
Secondary sources
Include public sources such as regulatory frameworks, government IT spending, government demographic indicators, industry association statistics, and company publications along with paid sources such as Factiva, OneSource, Bloomberg among others.
![]()


