
Threat Intelligence Market by Solution (Unified threat management, SIEM, IAM, Incident Forensics, Log Management, and Third-Party risk management), Services (Professional Services, Managed Service, Subscription Services, and Training & Support), Deployment (Cloud-based and On-Premise), Application, and Geography – Global Forecast up to 2027
- July, 2021
- Domain: ICT - Security
- Get Free 10% Customization in this Report
Threat intelligence, also called cyber threat intelligence, refers to organized, analyzed, and refined information about present or potential attacks that threaten an organization. Threat intelligence assists organizations in understanding the risks associated with extreme external threats, including advanced persistent threats, zero-day threats, and exploits. This also includes threats from partner and internal threats; threat intelligence is more focused on identifying threats which are more prone to affect a specific organization's environment. Key factors driving the growth of the global threat intelligence market are raising the prevalence of cyber-attacks and data breaches, growing adoption of cloud-based services and internet of things (IoT) devices by several organizations and businesses. In addition, the growing adoption of threat intelligence services and solutions by many sectors such as BSFI, healthcare, military, government, etc., is another attribute fuelling the growth of the global threat intelligence market. However, the cost incurred in the installation is a key factor impeding the market growth. As a result, the threat intelligence market is likely to grow at the rate of 8.3% CAGR by 2027.
Research Methodology:
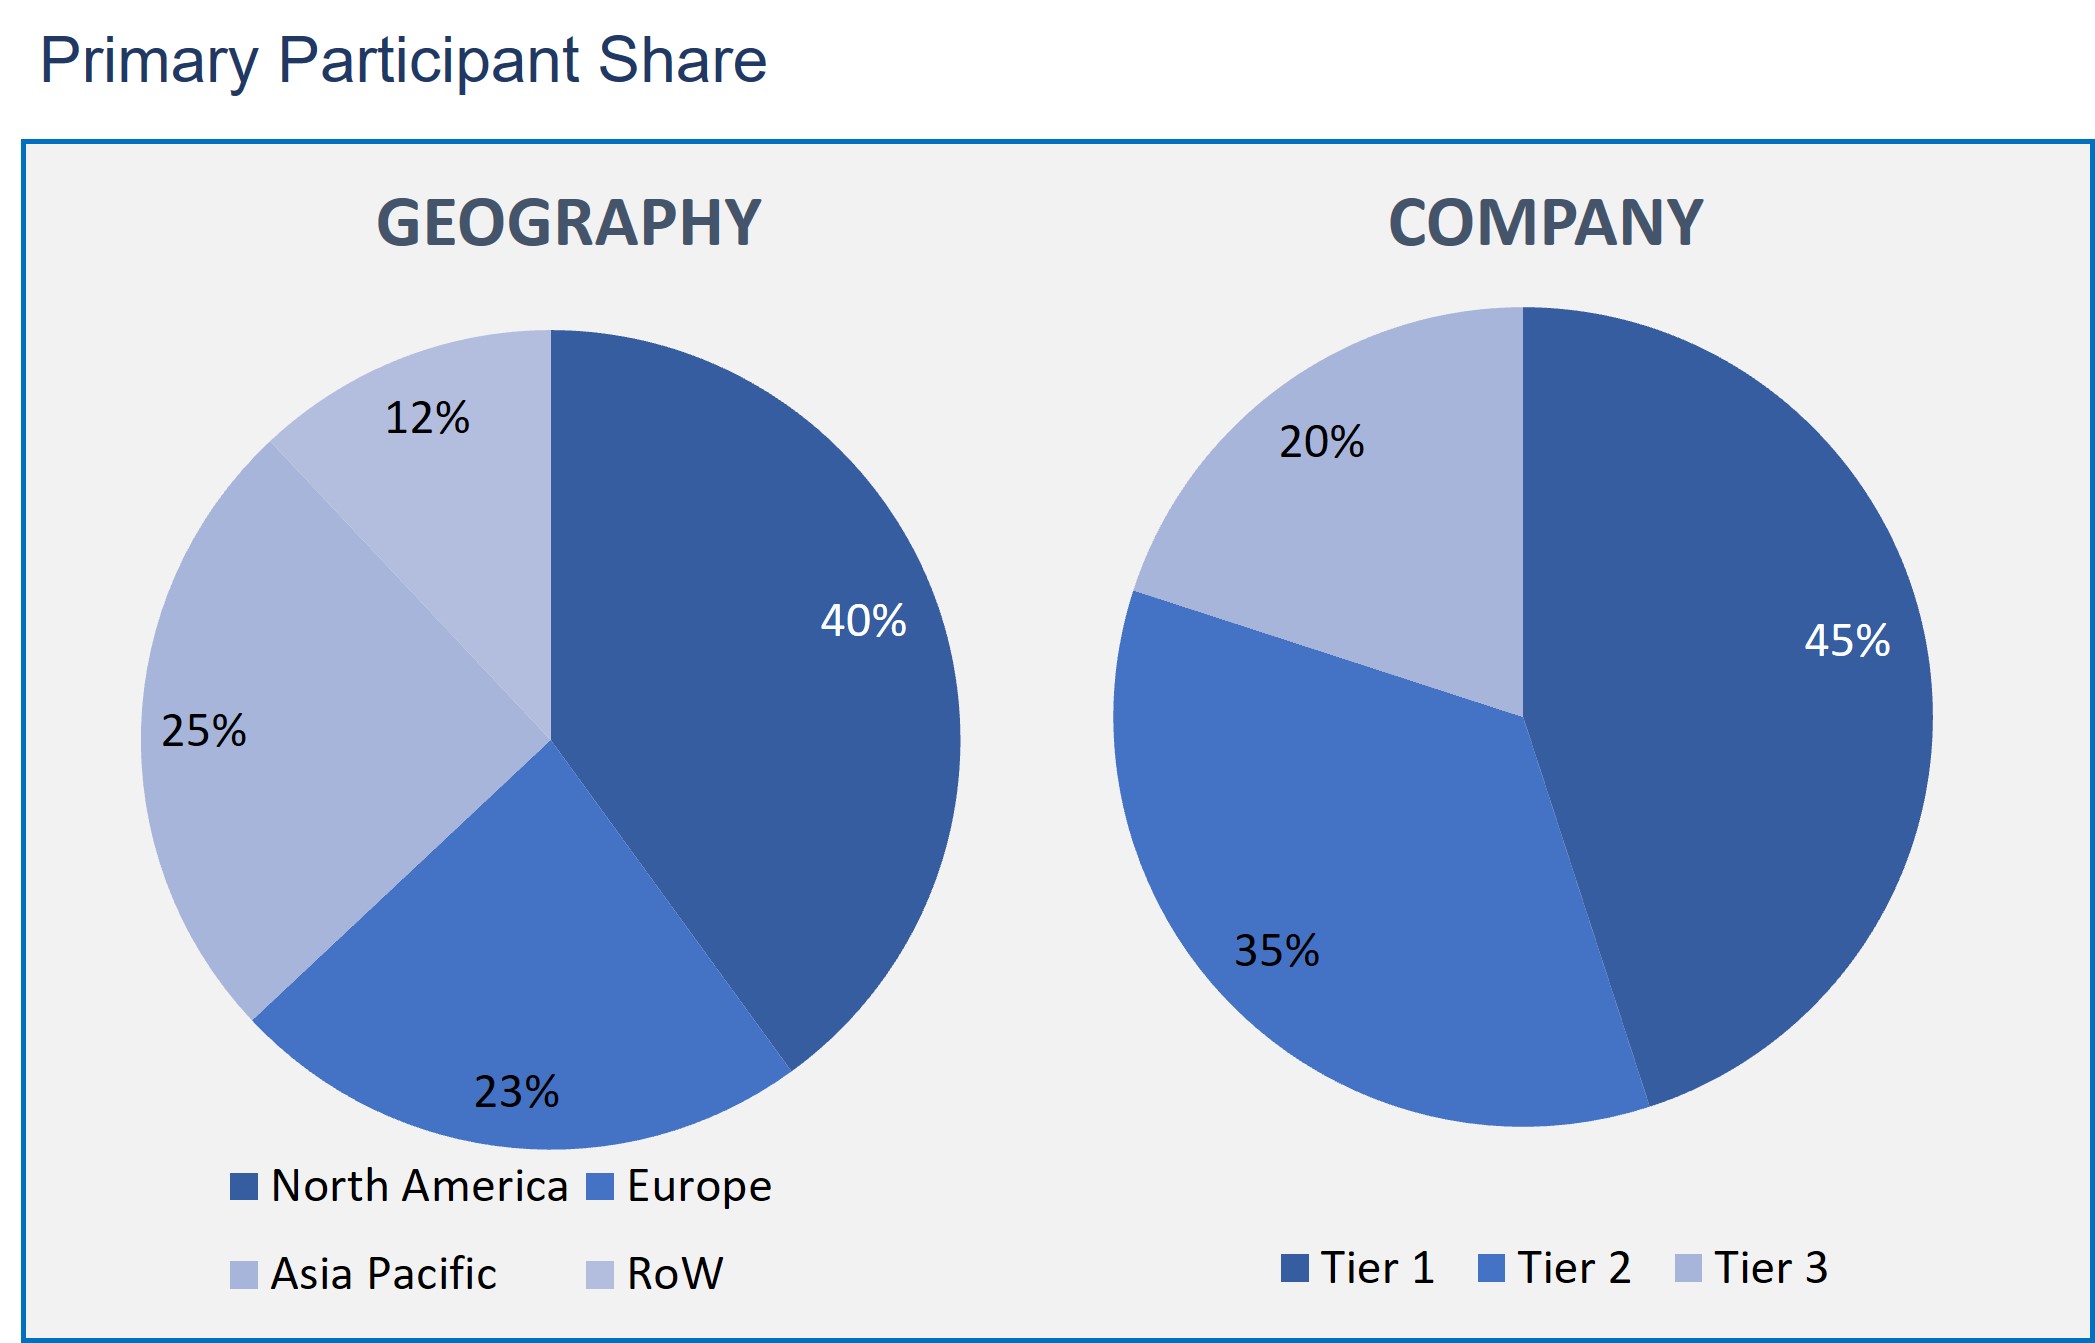
The threat intelligence market has been analyzed by utilizing the optimum combination of secondary sources and in-house methodology and a unique balance of primary insights. The real-time valuation of the market is an important part of our forecasting and market sizing methodology. Industry experts and our primary participants have helped to compile related aspects with accurate parametric estimations for a complete study. The primary participants share is given below:
Threat Intelligence Market based on the Solution
- Unified threat management
- SIEM
- IAM
- Incident Forensics
- Log Management
- Third-Party risk management
Threat Intelligence Market based on the Services
- Professional services
- Managed Service
- Subscription Services
- Training & Support
Threat Intelligence Market based on the Deployment
- Cloud-based
- On-Premise
Threat Intelligence Market based on the Application
- BFSI
- IT & Telecom
- Healthcare
- Retail
- Government & Defense
- Manufacturing
Threat Intelligence Market based on the Geography
- North America
- Europe
- Asia Pacific
- Rest of the World
As per the market segments based on solution, the identity and access management solution segment is expanding rapidly. The expansion of the segment is due to the effective security standards for authentication and authorization of users on the basis of access levels. Moreover, as organizations change their business to cloud services, IAM performs a vital part in managing and accessing applications & data by employees without compromising on security protocols.
As in the market for service, the managed service segment has the major share in the market. Since the managed services provide security management based on collected information from users’ business environment and threat outlook dynamics. This feeds the data points into the systems, which are automated with analysis and algorithms to find vital events to further notify the customer.
Based on the deployment, the cloud-based deployment is increasingly adopted by the various organizations shifting from on-premise deployment mode as they are cost-effective. In addition, organizations are finding it complicated to manage the on-premise solutions due to the issues such as the dearth of expertise and resource as well as budget constraints.
Further based on application, the BFSI segment is accounted for the maximum share in the market. The large share is due to the increasing expenditure on threat intelligence in the BFSI sector in order to tackle the rising cyber-crime and internal breaches. Moreover, the banking sector has increased security vulnerabilities due to advancements in the sector.
In terms of geography, the Asia Pacific is registering major growth in the coming years. Large enterprises and many SMEs within China, Japan, and India have been spending on security systems, which is due to the increasing major issues of data theft and increased cyber-attacks is a key factor responsible for the growth of the market in the region.
Globally increasing technological advancements have given rise to several types of cybersecurity threats and exploits such as phishing, data breaches, zero-day threats, and inside attacks. Accordingly, there has been an increase in the security concerns among organizations to protect their data with the help of constant updates of possible threats. Threat intelligence solutions are responsible for declining upcoming threats and maintain a secure environment. Thus, increasing cyber threats are majorly responsible for the global market growth.
This report provides the profiles of the major competitors of the threat intelligence market - International Business Machines Corporation, Juniper Networks Inc., Farsight Security Inc., Dell Inc., Fortinet Inc., CrowdStrike Inc., Anomali Inc., Symantec Corporation, McAfee LLC, and Webroot Inc.
Henceforth, threat intelligence is having a vital role in protecting the organization’s data from various threats. As various organizations are upgrading with the numerous advanced technologies, they are more vulnerable to cyber threats and various other privacy issues.
- This report provides an exclusive analysis of the market, which includes various regions, allowing shareholders to prepare plans as per the region.
- This report includes insights into the various factors which compels and hampers the growth of the market.
- An in-depth analysis of described regions provides insights that are projected to allow vendors to strategically organize their business moves.
- Key vendors of the market are profiled in this report in terms of their strategies, which assists in gaining a perception of the competitive outlook of the market.
- Executive Summary
- Industry Outlook
- Industry Overview
- Industry Trends
- Market Snapshot
- Market Definition
- Market Outlook
- Porter Five Forces
- Related Markets
- Market characteristics
- Market Overview
- Market Segmentation
- Market Dynamics
- Drivers
- Restraints
- Opportunities
- DRO - Impact Analysis
- Solution: Market Size & Analysis
- Overview
- Unified threat management
- SIEM
- IAM
- Incident Forensics
- Log Management
- Third-Party risk management
- Services: Market Size & Analysis
- Overview
- Professional services
- Managed Service
- Subscription Services
- Training & Support
- Deployment: Market Size & Analysis
- Overview
- Cloud-based
- On-Premise
- Application: Market Size & Analysis
- Overview
- BFSI
- IT & Telecom
- Healthcare
- Retail
- Government & Defense
- Manufacturing
- Geography: Market Size & Analysis
- Overview
- North America
- Europe
- Asia Pacific
- Rest of the World
- Competitive Landscape
- Competitor Comparison Analysis
- Market Developments
- Mergers and Acquisitions, Legal, Awards, Partnerships
- Product Launches and execution
- Vendor Profiles
- International Business Machines Corporation
- Overview
- Financial Overview
- Product Offerings
- Developments
- Business Strategy
- Juniper Networks Inc.
- Overview
- Financial Overview
- Product Offerings
- Developments
- Business Strategy
- Farsight Security Inc.
- Overview
- Financial Overview
- Product Offerings
- Developments
- Business Strategy
- Dell Inc.
- Overview
- Financial Overview
- Product Offerings
- Developments
- Business Strategy
- Fortinet Inc.
- Overview
- Financial Overview
- Product Offerings
- Developments
- Business Strategy
- CrowdStrike Inc.
- Overview
- Financial Overview
- Product Offerings
- Developments
- Business Strategy
- Anomali Inc.
- Overview
- Financial Overview
- Product Offerings
- Developments
- Business Strategy
- Symantec Corporation
- Overview
- Financial Overview
- Product Offerings
- Developments
- Business Strategy
- McAfee LLC
- Overview
- Financial Overview
- Product Offerings
- Developments
- Business Strategy
- Webroot Inc.
- Overview
- Financial Overview
- Product Offerings
- Developments
- Business Strategy
- International Business Machines Corporation
- Analyst Opinion
- Annexure
- Report Scope
- Market Definitions
- Research Methodology
- Data Collation and In-house Estimation
- Market Triangulation
- Forecasting
- Report Assumptions
- Declarations
- Stakeholders
- Abbreviations
TABLE 1. GLOBAL THREAT INTELLIGENCE MARKET VALUE, BY SOLUTION, 2021-2027 (USD BILLION)
TABLE 2. GLOBAL THREAT INTELLIGENCE MARKET VALUE FOR UNIFIED THREAT MANAGEMENT, BY GEOGRAPHY, 2021-2027 (USD BILLION)
TABLE 3. GLOBAL THREAT INTELLIGENCE MARKET VALUE FOR SIEM, BY GEOGRAPHY, 2021-2027 (USD BILLION)
TABLE 4. GLOBAL THREAT INTELLIGENCE MARKET VALUE FOR IAM, BY GEOGRAPHY, 2021-2027 (USD BILLION)
TABLE 5. GLOBAL THREAT INTELLIGENCE MARKET VALUE FOR INCIDENT FORENSICS, BY GEOGRAPHY, 2021-2027 (USD BILLION)
TABLE 6. GLOBAL THREAT INTELLIGENCE MARKET VALUE FOR LOG MANAGEMENT, BY TYPE, 2021-2027 (USD BILLION)
TABLE 7. GLOBAL THREAT INTELLIGENCE MARKET VALUE FOR THIRD-PARTY RISK MANAGEMENT, BY GEOGRAPHY, 2021-2027 (USD BILLION)
TABLE 8. GLOBAL THREAT INTELLIGENCE MARKET VALUE, BY SERVICES, 2021-2027 (USD BILLION)
TABLE 9. GLOBAL THREAT INTELLIGENCE MARKET VALUE FOR PROFESSIONAL SERVICES, BY GEOGRAPHY, 2021-2027 (USD BILLION)
TABLE 10. GLOBAL THREAT INTELLIGENCE MARKET VALUE FOR MANAGED SERVICE, BY GEOGRAPHY, 2021-2027 (USD BILLION)
TABLE 11. GLOBAL THREAT INTELLIGENCE MARKET VALUE FOR SUBSCRIPTION SERVICES, BY GEOGRAPHY, 2021-2027 (USD BILLION)
TABLE 12. GLOBAL THREAT INTELLIGENCE MARKET VALUE FOR TRAINING & SUPPORT, BY GEOGRAPHY, 2021-2027 (USD BILLION)
TABLE 13. GLOBAL THREAT INTELLIGENCE MARKET VALUE, BY DEPLOYMENT, 2021-2027 (USD BILLION)
TABLE 14. GLOBAL THREAT INTELLIGENCE MARKET VALUE FOR CLOUD-BASED, 2021-2027 (USD BILLION)
TABLE 15. GLOBAL THREAT INTELLIGENCE MARKET VALUE FOR ON-PREMISE, BY GEOGRAPHY, 2021-2027 (USD BILLION)
TABLE 16. GLOBAL THREAT INTELLIGENCE MARKET VALUE, APPLICATION, 2021-2027 (USD BILLION)
TABLE 17. GLOBAL THREAT INTELLIGENCE MARKET VALUE FOR BFSI, BY GEOGRAPHY, 2021-2027 (USD BILLION)
TABLE 18. GLOBAL THREAT INTELLIGENCE MARKET VALUE FOR IT & TELECOM, BY GEOGRAPHY, 2021-2027 (USD BILLION)
TABLE 19. GLOBAL THREAT INTELLIGENCE MARKET VALUE FOR HEALTHCARE, BY GEOGRAPHY, 2021-2027 (USD BILLION)
TABLE 20. GLOBAL THREAT INTELLIGENCE MARKET VALUE FOR RETAIL, BY GEOGRAPHY, 2021-2027 (USD BILLION)
TABLE 21. GLOBAL THREAT INTELLIGENCE MARKET VALUE FOR GOVERNMENT & DEFENSE, BY GEOGRAPHY, 2021-2027 (USD BILLION)
TABLE 22. GLOBAL THREAT INTELLIGENCE MARKET VALUE FOR MANUFACTURING, BY GEOGRAPHY, 2021-2027 (USD BILLION)
TABLE 23. NORTH AMERICA THREAT INTELLIGENCE MARKET VALUE, BY COUNTRY, 2021-2027 (USD BILLION)
TABLE 24. NORTH AMERICA THREAT INTELLIGENCE MARKET VALUE, BY SOLUTION, 2021-2027 (USD BILLION)
TABLE 25. NORTH AMERICA THREAT INTELLIGENCE MARKET VALUE, BY SERVICES, 2021-2027 (USD BILLION)
TABLE 26. NORTH AMERICA THREAT INTELLIGENCE MARKET VALUE, BY DEPLOYMENT, 2021-2027 (USD BILLION)
TABLE 27. NORTH AMERICA THREAT INTELLIGENCE MARKET VALUE, BY APPLICATION, 2021-2027 (USD BILLION)
TABLE 28. U.S THREAT INTELLIGENCE MARKET VALUE, BY SOLUTION, 2021-2027 (USD BILLION)
TABLE 29. U.S THREAT INTELLIGENCE MARKET VALUE, BY SERVICES, 2021-2027 (USD BILLION)
TABLE 30. U.S THREAT INTELLIGENCE MARKET VALUE, BY DEPLOYMENT, 2021-2027 (USD BILLION)
TABLE 31. U.S THREAT INTELLIGENCE MARKET VALUE, BY APPLICATION, 2021-2027 (USD BILLION)
TABLE 32. CANADA THREAT INTELLIGENCE MARKET VALUE, BY SOLUTION, 2021-2027 (USD BILLION)
TABLE 33. CANADA THREAT INTELLIGENCE MARKET VALUE, BY SERVICES, 2021-2027 (USD BILLION)
TABLE 34. CANADA THREAT INTELLIGENCE MARKET VALUE, BY DEPLOYMENT, 2021-2027 (USD BILLION)
TABLE 35. CANADA THREAT INTELLIGENCE MARKET VALUE, BY APPLICATION, 2021-2027 (USD BILLION)
TABLE 36. EUROPE THREAT INTELLIGENCE MARKET VALUE, BY COUNTRY, 2021-2027 (USD BILLION)
TABLE 37. EUROPE THREAT INTELLIGENCE MARKET VALUE, BY SOLUTION, 2021-2027 (USD BILLION)
TABLE 38. EUROPE THREAT INTELLIGENCE MARKET VALUE, BY SERVICES, 2021-2027 (USD BILLION)
TABLE 39. EUROPE THREAT INTELLIGENCE MARKET VALUE, BY DEPLOYMENT, 2021-2027 (USD BILLION)
TABLE 40. EUROPE THREAT INTELLIGENCE MARKET VALUE, BY APPLICATION, 2021-2027 (USD BILLION)
TABLE 41. GERMANY THREAT INTELLIGENCE MARKET VALUE, BY SOLUTION, 2021-2027 (USD BILLION)
TABLE 42. GERMANY THREAT INTELLIGENCE MARKET VALUE, BY SERVICES, 2021-2027 (USD BILLION)
TABLE 43. GERMANY THREAT INTELLIGENCE MARKET VALUE, BY DEPLOYMENT, 2021-2027 (USD BILLION)
TABLE 44. GERMANY THREAT INTELLIGENCE MARKET VALUE, BY APPLICATION, 2021-2027 (USD BILLION)
TABLE 45. U.K THREAT INTELLIGENCE MARKET VALUE, BY SOLUTION, 2021-2027 (USD BILLION)
TABLE 46. U.K THREAT INTELLIGENCE MARKET VALUE, BY SERVICES, 2021-2027 (USD BILLION)
TABLE 47. U.K THREAT INTELLIGENCE MARKET VALUE, BY DEPLOYMENT, 2021-2027 (USD BILLION)
TABLE 48. U.K THREAT INTELLIGENCE MARKET VALUE, BY APPLICATION, 2021-2027 (USD BILLION)
TABLE 49. FRANCE THREAT INTELLIGENCE MARKET VALUE, BY SOLUTION, 2021-2027 (USD BILLION)
TABLE 50. FRANCE THREAT INTELLIGENCE MARKET VALUE, BY SERVICES, 2021-2027 (USD BILLION)
TABLE 51. FRANCE THREAT INTELLIGENCE MARKET VALUE, BY DEPLOYMENT, 2021-2027 (USD BILLION)
TABLE 52. FRANCE THREAT INTELLIGENCE MARKET VALUE, BY APPLICATION, 2021-2027 (USD BILLION)
TABLE 53. ITALY THREAT INTELLIGENCE MARKET VALUE, BY SOLUTION, 2021-2027 (USD BILLION)
TABLE 54. ITALY THREAT INTELLIGENCE MARKET VALUE, BY SERVICES, 2021-2027 (USD BILLION)
TABLE 55. ITALY THREAT INTELLIGENCE MARKET VALUE, BY DEPLOYMENT, 2021-2027 (USD BILLION)
TABLE 56. ITALY THREAT INTELLIGENCE MARKET VALUE, BY APPLICATION, 2021-2027 (USD BILLION)
TABLE 57. SPAIN THREAT INTELLIGENCE MARKET VALUE, BY SOLUTION, 2021-2027 (USD BILLION)
TABLE 58. SPAIN THREAT INTELLIGENCE MARKET VALUE, BY SERVICES, 2021-2027 (USD BILLION)
TABLE 59. SPAIN THREAT INTELLIGENCE MARKET VALUE, BY DEPLOYMENT, 2021-2027 (USD BILLION)
TABLE 60. SPAIN THREAT INTELLIGENCE MARKET VALUE, BY APPLICATION, 2021-2027 (USD BILLION)
TABLE 61. ROE THREAT INTELLIGENCE MARKET VALUE, BY SOLUTION, 2021-2027 (USD BILLION)
TABLE 62. ROE THREAT INTELLIGENCE MARKET VALUE, BY SERVICES, 2021-2027 (USD BILLION)
TABLE 63. ROE THREAT INTELLIGENCE MARKET VALUE, BY DEPLOYMENT, 2021-2027 (USD BILLION)
TABLE 64. ROE THREAT INTELLIGENCE MARKET VALUE, BY APPLICATION, 2021-2027 (USD BILLION)
TABLE 65. ASIA PACIFIC THREAT INTELLIGENCE MARKET VALUE, BY COUNTRY, 2021-2027 (USD BILLION)
TABLE 66. ASIA PACIFIC THREAT INTELLIGENCE MARKET VALUE, BY SOLUTION, 2021-2027 (USD BILLION)
TABLE 67. ASIA PACIFIC THREAT INTELLIGENCE MARKET VALUE, BY SERVICES, 2021-2027 (USD BILLION)
TABLE 68. ASIA PACIFIC THREAT INTELLIGENCE MARKET VALUE, BY DEPLOYMENT, 2021-2027 (USD BILLION)
TABLE 69. ASIA PACIFIC THREAT INTELLIGENCE MARKET VALUE, BY APPLICATION, 2021-2027 (USD BILLION)
TABLE 70. CHINA THREAT INTELLIGENCE MARKET VALUE, BY SOLUTION, 2021-2027 (USD BILLION)
TABLE 71. CHINA THREAT INTELLIGENCE MARKET VALUE, BY SERVICES, 2021-2027 (USD BILLION)
TABLE 72. CHINA THREAT INTELLIGENCE MARKET VALUE, BY DEPLOYMENT, 2021-2027 (USD BILLION)
TABLE 73. CHINA THREAT INTELLIGENCE MARKET VALUE, BY APPLICATION, 2021-2027 (USD BILLION)
TABLE 74. INDIA THREAT INTELLIGENCE MARKET VALUE, BY SOLUTION, 2021-2027 (USD BILLION)
TABLE 75. INDIA THREAT INTELLIGENCE MARKET VALUE, BY SERVICES, 2021-2027 (USD BILLION)
TABLE 76. INDIA THREAT INTELLIGENCE MARKET VALUE, BY DEPLOYMENT, 2021-2027 (USD BILLION)
TABLE 77. INDIA THREAT INTELLIGENCE MARKET VALUE, BY APPLICATION, 2021-2027 (USD BILLION)
TABLE 78. JAPAN THREAT INTELLIGENCE MARKET VALUE, BY SOLUTION, 2021-2027 (USD BILLION)
TABLE 79. JAPAN THREAT INTELLIGENCE MARKET VALUE, BY SERVICES, 2021-2027 (USD BILLION)
TABLE 80. JAPAN THREAT INTELLIGENCE MARKET VALUE, BY DEPLOYMENT, 2021-2027 (USD BILLION)
TABLE 81. JAPAN THREAT INTELLIGENCE MARKET VALUE, BY APPLICATION, 2021-2027 (USD BILLION)
TABLE 82. REST OF APAC THREAT INTELLIGENCE MARKET VALUE, BY SOLUTION, 2021-2027 (USD BILLION)
TABLE 83. REST OF APAC THREAT INTELLIGENCE MARKET VALUE, BY SERVICES, 2021-2027 (USD BILLION)
TABLE 84. REST OF APAC THREAT INTELLIGENCE MARKET VALUE, BY DEPLOYMENT, 2021-2027 (USD BILLION)
TABLE 85. REST OF APAC THREAT INTELLIGENCE MARKET VALUE, BY APPLICATION, 2021-2027 (USD BILLION)
TABLE 86. REST OF WORLD THREAT INTELLIGENCE MARKET VALUE, BY SOLUTION, 2021-2027 (USD BILLION)
TABLE 87. REST OF WORLD THREAT INTELLIGENCE MARKET VALUE, BY SERVICES, 2021-2027 (USD BILLION)
TABLE 88. REST OF WORLD THREAT INTELLIGENCE MARKET VALUE, BY DEPLOYMENT, 2021-2027 (USD BILLION)
TABLE 89. REST OF WORLD THREAT INTELLIGENCE MARKET VALUE, BY APPLICATION, 2021-2027 (USD BILLION)
TABLE 90. INTERNATIONAL BUSINESS MACHINES CORPORATION: FINANCIALS
TABLE 91. INTERNATIONAL BUSINESS MACHINES CORPORATION: SOLUTIONS & SERVICES
TABLE 92. INTERNATIONAL BUSINESS MACHINES CORPORATION: RECENT DEVELOPMENTS
TABLE 93. JUNIPER NETWORKS INC: FINANCIALS
TABLE 94. JUNIPER NETWORKS INC: SOLUTIONS & SERVICES
TABLE 95. JUNIPER NETWORKS INC: RECENT DEVELOPMENTS
TABLE 96. FARSIGHT SECURITY INC: FINANCIALS
TABLE 97. FARSIGHT SECURITY INC: SOLUTIONS & SERVICES
TABLE 98. FARSIGHT SECURITY INC: RECENT DEVELOPMENTS
TABLE 99. DELL INC: FINANCIALS
TABLE 100. DELL INC: SOLUTIONS & SERVICES
TABLE 101. DELL INC: RECENT DEVELOPMENTS
TABLE 102. FORTINET INC: FINANCIALS
TABLE 103. FORTINET INC: SOLUTIONS & SERVICES
TABLE 104. FORTINET INC: RECENT DEVELOPMENTS
TABLE 105. CROWDSTRIKE INC: FINANCIALS
TABLE 106. CROWDSTRIKE INC: SOLUTIONS & SERVICES
TABLE 107. CROWDSTRIKE INC: RECENT DEVELOPMENTS
TABLE 108. ANOMALI INC: FINANCIALS
TABLE 109. ANOMALI INC: SOLUTIONS & SERVICES
TABLE 110. ANOMALI INC: RECENT DEVELOPMENTS
TABLE 111. SYMANTEC CORPORATION: FINANCIALS
TABLE 112. SYMANTEC CORPORATION: SOLUTIONS & SERVICES
TABLE 113. SYMANTEC CORPORATION: RECENT DEVELOPMENTS
TABLE 114. MCAFEE LLC: FINANCIALS
TABLE 115. MCAFEE LLC: SOLUTIONS & SERVICES
TABLE 116. MCAFEE LLC: RECENT DEVELOPMENTS
TABLE 117. WEBROOT INC: FINANCIALS
TABLE 118. WEBROOT INC: SOLUTIONS & SERVICES
TABLE 119. WEBROOT INC: RECENT DEVELOPMENTS
Research Framework
Infoholic Research works on a holistic 360° approach in order to deliver high quality, validated and reliable information in our market reports. The Market estimation and forecasting involves following steps:
- Data Collation (Primary & Secondary)
- In-house Estimation (Based on proprietary data bases and Models)
- Market Triangulation
- Forecasting

Market related information is congregated from both primary and secondary sources.
Primary sources
Involved participants from all global stakeholders such as Solution providers, service providers, Industry associations, thought leaders etc. across levels such as CXOs, VPs and managers. Plus, our in-house industry experts having decades of industry experience contribute their consulting and advisory services.
Secondary sources
Include public sources such as regulatory frameworks, government IT spending, government demographic indicators, industry association statistics, and company publications along with paid sources such as Factiva, OneSource, Bloomberg among others.
![]()


