
Testing, Inspection, and Certification Market by Sourcing Type (In-house services and Outsourced services), Service Type (Testing, Inspection, Certification, and Others), Application, Geography – Global Drivers, Restraints, Opportunities, Trends, and Forecast up to 2026
- September, 2020
- Domain: Electronics & Semiconductors - Electronics & Semiconductors
- Get Free 10% Customization in this Report
The testing, inspection, and certification is rendering services to the companies employed across various industrial verticals to enhance the activities such as productivity, the efficient production process for manufacturers to achieve the globally acknowledged standards and policies implemented by the government to stimulate the quality of the product. These services can be implemented for any product and service. The factors impelling the testing, inspection, and certification market growth are the rising illegal trade activities such as forged products and infringe the copyright of the products and the growing tendency of outsourcing the testing, inspection, and certification services. Anyhow, the different rules, regulations, and policies amidst many different countries are impeding market growth. The market for testing, inspection, and certification is projected to grow at a CAGR of 4% with a value expecting to reach $252.60 billion by 2026.
Research Methodology:
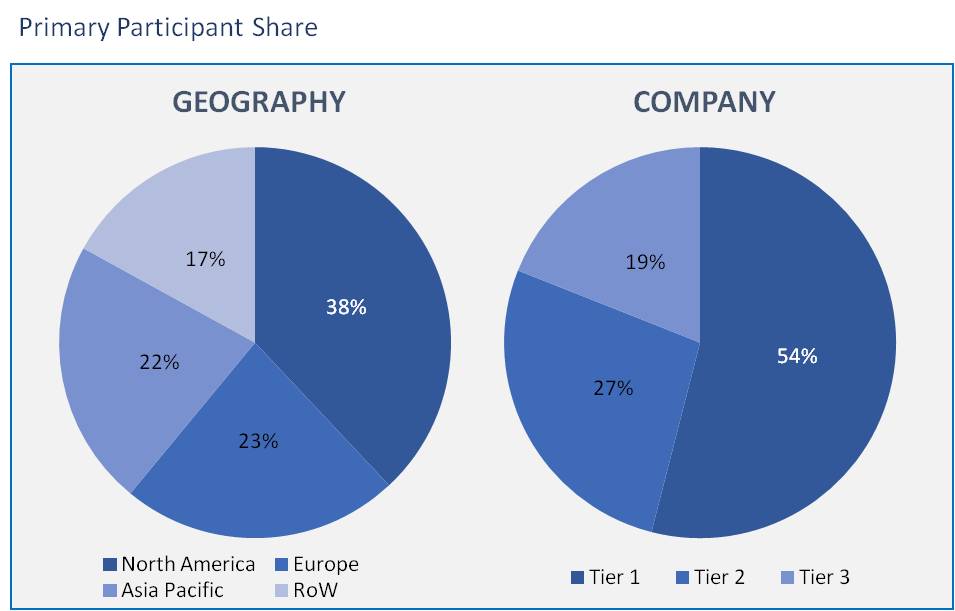
The testing, inspection, and certification market has been analyzed by utilizing the optimum combination of secondary sources and in-house methodology, along with an irreplaceable blend of primary insights. The real-time assessment of the market is an integral part of our market sizing and forecasting methodology. Our industry experts and panel of primary participants have helped in compiling relevant aspects with realistic parametric estimations for a comprehensive study. The participation share of different categories of primary participants is given below:
The scope of testing, inspection, and certification market can be defined by the following segmentation.
Sourcing Type: Market Size & Analysis
- In-house services
- Outsourced services
Service Type: Market Size & Analysis
- Testing
- Inspection
- Certification
- Others
Application: Market Size & Analysis
- Consumer Goods and Retail
- Agriculture and Food
- Chemicals
- Construction and Infrastructure
- Energy and Power
- Industrial manufacturing
- Medical and Life Sciences
- Mining
- Oil & Gas and Petroleum
- Public Sector
- Automotive
- Aerospace
- Marine
- Railways
- Supply Chain and Logistics
- IT and Telecommunications
- Sports & Entertainment
Geography: Market Size & Analysis
- North America
- Europe
- Asia Pacific
- Rest of the World
Based on the sourcing type, the market would be segmented into in-house services and outsourced services. Usually, the companies opt for the in-house services creating a high demand for this segment. The in-house services come up with the company’s overall control in the complete process, and manufacturers can instantaneously manage the testing, inspection, and certification process without approaching other services providers in case of in-house services.
In terms of service type, the certificate services are happening to surge the market growth due to the assured product or service safety and operation aspects, soaring demand for attaining mandatory certificates, and also emerging discretionary certificates for products include pollution-free products. The key objective of this service is to improve the overall performance of the business.
As observed in the market based on application, the agriculture and food application projected to depict the high growth in the market share. The agriculture & food sector based on the safety and validity of the products is very significant. The testing, inspection, and certification plays a prominent role in the agriculture and food sector and also in the trading agricultural and food products by obtaining an international certificate.
In the regional market, the Asia Pacific region is anticipated to represent the highest growth share in the market. Due to the high population density with improved purchasing quality products, growing preference for consumer electronics, rising consciousness regarding quality, and surging imports and exports to boost the market growth in the Asia Pacific.
Expeditious globalization is accelerating the market growth owing to the growth in the number of global trade agreements among countries. Globalization has enhanced the trade among developing countries leading to the growth of testing, inspection, and certification services for manufacturers since the imports from developing countries need to clear restricted tests to respect international standards. Additionally, the surging product diversifications in various nations are driving market growth.
The companies which are anticipated to lead the testing, inspection, and certification market include-ASTM International, TUV SUD AG, AsureQuality Ltd, Dekra SE, TÜV Rheinland Group, Intertek Group Plc, SGS Group, Bureau Veritas SA, ALS Ltd, DNV GL Group AS, Underwriters Laboratories Inc, Lloyd’s Register Group Limited, APPLUS+, TUV Nord group.
Overall, the testing, inspection, and certification market are significantly dependent on the quality of the product or service which is provided by the firms. This is the major attribute in this market. The market report gives other key trends in the market.
- The market report gives the evaluation of testing, inspection, and certification market perspective by analyzing the growth rate according to source type, service type, application, and geography.
- This study gives the overall perspective of different dynamics influencing the testing, inspection, and certification market by major market drivers, restraints, and opportunities.
- This report also presents a comprehensive analysis of the testing, inspection, and certification market competitor performance by their strategies, capabilities, and mergers & acquisitions.
1. Executive Summary
2. Industry Outlook
2.1. Industry Overview
2.2. Industry Trends
3. Market Snapshot
3.1. Market Definition
3.2. Market Outlook
3.3. PEST Analysis
3.4. Porter Five Forces
3.5. Related Markets
4. Market characteristics
4.1. Market Evolution
4.2. Market Trends and Impact
4.3. Advantages/Disadvantages of Market
4.4. Regulatory Impact
4.5. Market Offerings
4.6. Market Segmentation
4.7. Market Dynamics
4.7.1. Drivers
4.7.2. Restraints
4.7.3. Opportunities
4.8. DRO - Impact Analysis
5. Sourcing Type: Market Size & Analysis
5.1. Overview
5.2. In-house services
5.3. Outsourced services
6. Service Type: Market Size & Analysis
6.1. Overview
6.2. Testing
6.3. Inspection
6.4. Certification
6.5. Others
7. Application: Market Size & Analysis
7.1. Overview
7.2. Consumer Goods and Retail
7.3. Agriculture and Food
7.4. Chemicals
7.5. Construction and Infrastructure
7.6. Energy and Power
7.7. Industrial manufacturing
7.8. Medical and Life Sciences
7.9. Mining
7.10. Oil & Gas and Petroleum
7.11. Public Sector
7.12. Automotive
7.13. Aerospace
7.14. Marine
7.15. Railways
7.16. Supply Chain and Logistics
7.17. IT and Telecommunications
7.18. Sports & Entertainment
8. Geography: Market Size & Analysis
8.1. Overview
8.2. North America
8.3. Europe
8.4. Asia Pacific
8.5. Rest of the World
9. Competitive Landscape
9.1. Competitor Comparison Analysis
9.2. Market Developments
9.2.1. Mergers and Acquisitions, Legal, Awards, Partnerships
9.2.2. Product Launches and execution
10. Vendor Profiles
10.1. ASTM International
10.1.1. Overview
10.1.2. Product Offerings
10.1.3. Geographic Revenue
10.1.4. Business Units
10.1.5. Developments
10.1.6. Business Strategy
10.2. TUV SUD AG
10.2.1. Overview
10.2.2. Product Offerings
10.2.3. Geographic Revenue
10.2.4. Business Units
10.2.5. Developments
10.2.6. Business Strategy
10.3. AsureQuality Ltd
10.3.1. Overview
10.3.2. Product Offerings
10.3.3. Geographic Revenue
10.3.4. Business Units
10.3.5. Developments
10.3.6. Business Strategy
10.4. Dekra SE
10.4.1. Overview
10.4.2. Product Offerings
10.4.3. Geographic Revenue
10.4.4. Business Units
10.4.5. Developments
10.4.6. Business Strategy
10.5. TÜV Rheinland Group
10.5.1. Overview
10.5.2. Product Offerings
10.5.3. Geographic Revenue
10.5.4. Business Units
10.5.5. Developments
10.5.6. Business Strategy
10.6. Intertek
10.6.1. Overview
10.6.2. Product Offerings
10.6.3. Geographic Revenue
10.6.4. Business Units
10.6.5. Developments
10.6.6. Business Strategy
10.7. SGS Group
10.7.1. Overview
10.7.2. Product Offerings
10.7.3. Geographic Revenue
10.7.4. Business Units
10.7.5. Developments
10.7.6. Business Strategy
10.8. Bureau Veritas SA
10.8.1. Overview
10.8.2. Product Offerings
10.8.3. Geographic Revenue
10.8.4. Business Units
10.8.5. Developments
10.8.6. Business Strategy
10.9. ALS Ltd
10.9.1. Overview
10.9.2. Product Offerings
10.9.3. Geographic Revenue
10.9.4. Business Units
10.9.5. Developments
10.9.6. Business Strategy
10.10. DNV GL Group AS
10.10.1. Overview
10.10.2. Product Offerings
10.10.3. Geographic Revenue
10.10.4. Business Units
10.10.5. Developments
10.10.6. Business Strategy
11. Companies to Watch
11.1. Underwriters Laboratories Inc
11.1.1. Overview
11.1.2. Market
11.1.3. Business Strategy
11.2. Lloyd's Register Group Limited
11.2.1. Overview
11.2.2. Market
11.2.3. Business Strategy
11.3. APPLUS+
11.3.1. Overview
11.3.2. Market
11.3.3. Business Strategy
11.4. TUV Nord group
11.4.1. Overview
11.4.2. Market
11.4.3. Business Strategy
12. Analyst Opinion
13. Annexure
13.1. Report Scope
13.2. Market Definitions
13.3. Research Methodology
13.3.1. Data Collation and In-house Estimation
13.3.2. Market Triangulation
13.3.3. Forecasting
13.4. Report Assumptions
13.5. Declarations
13.6. Stakeholders
13.7. Abbreviations
TABLE 1. GLOBAL TESTING, INSPECTION, AND CERTIFICATION MARKET VALUE, BY SOURCING TYPE, 2020-2026 (USD BILLION)
TABLE 2. GLOBAL TESTING, INSPECTION, AND CERTIFICATION MARKET VALUE FOR IN-HOUSE SERVICES, BY GEOGRAPHY, 2020-2026 (USD BILLION)
TABLE 3. GLOBAL TESTING, INSPECTION, AND CERTIFICATION MARKET VALUE FOR OUTSOURCED SERVICES, BY GEOGRAPHY, 2020-2026 (USD BILLION)
TABLE 4. GLOBAL TESTING, INSPECTION, AND CERTIFICATION MARKET VALUE, BY SERVICE TYPE, 2020-2026 (USD BILLION)
TABLE 5. GLOBAL TESTING, INSPECTION, AND CERTIFICATION MARKET VALUE FOR TESTING, BY GEOGRAPHY, 2020-2026 (USD BILLION)
TABLE 6. GLOBAL TESTING, INSPECTION, AND CERTIFICATION MARKET VALUE FOR INSPECTION, BY GEOGRAPHY, 2020-2026 (USD BILLION)
TABLE 7. GLOBAL TESTING, INSPECTION, AND CERTIFICATION MARKET VALUE FOR CERTIFICATION, BY GEOGRAPHY, 2020-2026 (USD BILLION)
TABLE 8. GLOBAL TESTING, INSPECTION, AND CERTIFICATION MARKET VALUE FOR OTHERS, BY GEOGRAPHY, 2020-2026 (USD BILLION)
TABLE 9. GLOBAL TESTING, INSPECTION, AND CERTIFICATION MARKET VALUE, BY APPLICATIONS, 2020-2026 (USD BILLION)
TABLE 10. GLOBAL TESTING, INSPECTION, AND CERTIFICATION MARKET VALUE FOR CONSUMER GOODS AND RETAIL, BY GEOGRAPHY, 2020-2026 (USD BILLION)
TABLE 11. GLOBAL TESTING, INSPECTION, AND CERTIFICATION MARKET VALUE FOR AGRICULTURE AND FOOD, BY GEOGRAPHY, 2020-2026 (USD BILLION)
TABLE 12. GLOBAL TESTING, INSPECTION, AND CERTIFICATION MARKET VALUE FOR CHEMICALS, BY GEOGRAPHY, 2020-2026 (USD BILLION)
TABLE 13. GLOBAL TESTING, INSPECTION, AND CERTIFICATION MARKET VALUE FOR CONSTRUCTION AND INFRASTRUCTURE, BY GEOGRAPHY, 2020-2026 (USD BILLION)
TABLE 14. GLOBAL TESTING, INSPECTION, AND CERTIFICATION MARKET VALUE FOR ENERGY AND POWER, BY GEOGRAPHY, 2020-2026 (USD BILLION)
TABLE 15. GLOBAL TESTING, INSPECTION, AND CERTIFICATION MARKET VALUE FOR INDUSTRIAL MANUFACTURING, BY GEOGRAPHY, 2020-2026 (USD BILLION)
TABLE 16. GLOBAL TESTING, INSPECTION, AND CERTIFICATION MARKET VALUE FOR MEDICAL AND LIFE SCIENCES, BY GEOGRAPHY, 2020-2026 (USD BILLION)
TABLE 17. GLOBAL TESTING, INSPECTION, AND CERTIFICATION MARKET VALUE FOR MINING, BY GEOGRAPHY, 2020-2026 (USD BILLION)
TABLE 18. GLOBAL TESTING, INSPECTION, AND CERTIFICATION MARKET VALUE FOR OIL & GAS AND PETROLEUM, BY GEOGRAPHY, 2020-2026 (USD BILLION)
TABLE 19. GLOBAL TESTING, INSPECTION, AND CERTIFICATION MARKET VALUE FOR PUBLIC SECTOR, BY GEOGRAPHY, 2020-2026 (USD BILLION)
TABLE 20. GLOBAL TESTING, INSPECTION, AND CERTIFICATION MARKET VALUE FOR AUTOMOTIVE, BY GEOGRAPHY, 2020-2026 (USD BILLION)
TABLE 21. GLOBAL TESTING, INSPECTION, AND CERTIFICATION MARKET VALUE FOR AEROSPACE, BY GEOGRAPHY, 2020-2026 (USD BILLION)
TABLE 22. GLOBAL TESTING, INSPECTION, AND CERTIFICATION MARKET VALUE FOR MARINE, BY GEOGRAPHY, 2020-2026 (USD BILLION)
TABLE 23. GLOBAL TESTING, INSPECTION, AND CERTIFICATION MARKET VALUE FOR RAILWAYS, BY GEOGRAPHY, 2020-2026 (USD BILLION)
TABLE 24. GLOBAL TESTING, INSPECTION, AND CERTIFICATION MARKET VALUE FOR SUPPLY CHAIN AND LOGISTICS, BY GEOGRAPHY, 2020-2026 (USD BILLION)
TABLE 25. GLOBAL TESTING, INSPECTION, AND CERTIFICATION MARKET VALUE FOR IT AND TELECOMMUNICATIONS, BY GEOGRAPHY, 2020-2026 (USD BILLION)
TABLE 26. GLOBAL TESTING, INSPECTION, AND CERTIFICATION MARKET VALUE FOR SPORTS & ENTERTAINMENT, BY GEOGRAPHY, 2020-2026 (USD BILLION)
TABLE 27. NORTH AMERICA TESTING, INSPECTION, AND CERTIFICATION MARKET VALUE, BY COUNTRY, 2020-2026 (USD BILLION)
TABLE 28. NORTH AMERICA TESTING, INSPECTION, AND CERTIFICATION MARKET VALUE, BY SOURCING TYPE, 2020-2026 (USD BILLION)
TABLE 29. NORTH AMERICA TESTING, INSPECTION, AND CERTIFICATION MARKET VALUE, BY SERVICE TYPE, 2020-2026 (USD BILLION)
TABLE 30. NORTH AMERICA TESTING, INSPECTION, AND CERTIFICATION MARKET VALUE, BY APPLICATIONS, 2020-2026 (USD BILLION)
TABLE 31. U.S TESTING, INSPECTION, AND CERTIFICATION MARKET VALUE, BY SOURCING TYPE, 2020-2026 (USD BILLION)
TABLE 32. U.S TESTING, INSPECTION, AND CERTIFICATION MARKET VALUE, BY SERVICE TYPE, 2020-2026 (USD BILLION)
TABLE 33. U.S TESTING, INSPECTION, AND CERTIFICATION MARKET VALUE, BY APPLICATIONS, 2020-2026 (USD BILLION)
TABLE 34. CANADA TESTING, INSPECTION, AND CERTIFICATION MARKET VALUE, BY SOURCING TYPE, 2020-2026 (USD BILLION)
TABLE 35. CANADA TESTING, INSPECTION, AND CERTIFICATION MARKET VALUE, BY SERVICE TYPE, 2020-2026 (USD BILLION)
TABLE 36. CANADA TESTING, INSPECTION, AND CERTIFICATION MARKET VALUE, BY APPLICATIONS, 2020-2026 (USD BILLION)
TABLE 37. EUROPE TESTING, INSPECTION, AND CERTIFICATION MARKET VALUE, BY COUNTRY, 2020-2026 (USD BILLION)
TABLE 38. EUROPE TESTING, INSPECTION, AND CERTIFICATION MARKET VALUE, BY SOURCING TYPE, 2020-2026 (USD BILLION)
TABLE 39. EUROPE TESTING, INSPECTION, AND CERTIFICATION MARKET VALUE, BY SERVICE TYPE, 2020-2026 (USD BILLION)
TABLE 40. EUROPE TESTING, INSPECTION, AND CERTIFICATION MARKET VALUE, BY APPLICATIONS, 2020-2026 (USD BILLION)
TABLE 41. GERMANY TESTING, INSPECTION, AND CERTIFICATION MARKET VALUE, BY SOURCING TYPE, 2020-2026 (USD BILLION)
TABLE 42. GERMANY TESTING, INSPECTION, AND CERTIFICATION MARKET VALUE, BY SERVICE TYPE, 2020-2026 (USD BILLION)
TABLE 43. GERMANY TESTING, INSPECTION, AND CERTIFICATION MARKET VALUE, BY APPLICATIONS, 2020-2026 (USD BILLION)
TABLE 44. FRANCE TESTING, INSPECTION, AND CERTIFICATION MARKET VALUE, BY SOURCING TYPE, 2020-2026 (USD BILLION)
TABLE 45. FRANCE TESTING, INSPECTION, AND CERTIFICATION MARKET VALUE, BY SERVICE TYPE, 2020-2026 (USD BILLION)
TABLE 46. FRANCE TESTING, INSPECTION, AND CERTIFICATION MARKET VALUE, BY APPLICATIONS, 2020-2026 (USD BILLION)
TABLE 47. U.K TESTING, INSPECTION, AND CERTIFICATION MARKET VALUE, BY SOURCING TYPE, 2020-2026 (USD BILLION)
TABLE 48. U.K TESTING, INSPECTION, AND CERTIFICATION MARKET VALUE, BY SERVICE TYPE, 2020-2026 (USD BILLION)
TABLE 49. U.K TESTING, INSPECTION, AND CERTIFICATION MARKET VALUE, BY APPLICATIONS, 2020-2026 (USD BILLION)
TABLE 50. ROE TESTING, INSPECTION, AND CERTIFICATION MARKET VALUE, BY SOURCING TYPE, 2020-2026 (USD BILLION)
TABLE 51. ROE TESTING, INSPECTION, AND CERTIFICATION MARKET VALUE, BY SERVICE TYPE, 2020-2026 (USD BILLION)
TABLE 52. ROE TESTING, INSPECTION, AND CERTIFICATION MARKET VALUE, BY APPLICATIONS, 2020-2026 (USD BILLION)
TABLE 53. ASIA PACIFIC TESTING, INSPECTION, AND CERTIFICATION MARKET VALUE, BY COUNTRY, 2020-2026 (USD BILLION)
TABLE 54. ASIA PACIFIC TESTING, INSPECTION, AND CERTIFICATION MARKET VALUE, BY SOURCING TYPE, 2020-2026 (USD BILLION)
TABLE 55. ASIA PACIFIC TESTING, INSPECTION, AND CERTIFICATION MARKET VALUE, BY SERVICE TYPE, 2020-2026 (USD BILLION)
TABLE 56. ASIA PACIFIC TESTING, INSPECTION, AND CERTIFICATION MARKET VALUE, BY APPLICATIONS, 2020-2026 (USD BILLION)
TABLE 57. CHINA TESTING, INSPECTION, AND CERTIFICATION MARKET VALUE, BY SOURCING TYPE, 2020-2026 (USD BILLION)
TABLE 58. CHINA TESTING, INSPECTION, AND CERTIFICATION MARKET VALUE, BY SERVICE TYPE, 2020-2026 (USD BILLION)
TABLE 59. CHINA TESTING, INSPECTION, AND CERTIFICATION MARKET VALUE, BY APPLICATIONS, 2020-2026 (USD BILLION)
TABLE 60. JAPAN TESTING, INSPECTION, AND CERTIFICATION MARKET VALUE, BY SOURCING TYPE, 2020-2026 (USD BILLION)
TABLE 61. JAPAN TESTING, INSPECTION, AND CERTIFICATION MARKET VALUE, BY SERVICE TYPE, 2020-2026 (USD BILLION)
TABLE 62. JAPAN TESTING, INSPECTION, AND CERTIFICATION MARKET VALUE, BY APPLICATIONS, 2020-2026 (USD BILLION)
TABLE 63. INDIA TESTING, INSPECTION, AND CERTIFICATION MARKET VALUE, BY SOURCING TYPE, 2020-2026 (USD BILLION)
TABLE 64. INDIA TESTING, INSPECTION, AND CERTIFICATION MARKET VALUE, BY SERVICE TYPE, 2020-2026 (USD BILLION)
TABLE 65. INDIA TESTING, INSPECTION, AND CERTIFICATION MARKET VALUE, BY APPLICATIONS, 2020-2026 (USD BILLION)
TABLE 66. REST OF ASIA PACIFIC TESTING, INSPECTION, AND CERTIFICATION MARKET VALUE, BY SOURCING TYPE, 2020-2026 (USD BILLION)
TABLE 67. REST OF ASIA PACIFIC TESTING, INSPECTION, AND CERTIFICATION MARKET VALUE, BY SERVICE TYPE, 2020-2026 (USD BILLION)
TABLE 68. REST OF ASIA PACIFIC TESTING, INSPECTION, AND CERTIFICATION MARKET VALUE, BY APPLICATIONS, 2020-2026 (USD BILLION)
TABLE 69. REST OF WORLD TESTING, INSPECTION, AND CERTIFICATION MARKET VALUE, BY SOURCING TYPE, 2020-2026 (USD BILLION)
TABLE 70. REST OF WORLD TESTING, INSPECTION, AND CERTIFICATION MARKET VALUE, BY SERVICE TYPE, 2020-2026 (USD BILLION)
TABLE 71. REST OF WORLD TESTING, INSPECTION, AND CERTIFICATION MARKET VALUE, BY APPLICATIONS, 2020-2026 (USD BILLION)
TABLE 72. ASTM INTERNATIONAL: OVERVIEW
TABLE 73. ASTM INTERNATIONAL: STRATEGIC SNAPSHOT
TABLE 74. ASTM INTERNATIONAL: BUSINESS FOCUS
TABLE 75. ASTM INTERNATIONAL: APPLICATION/SERVICE PORTFOLIO
TABLE 76. TUV SUD AG: OVERVIEW
TABLE 77. TUV SUD AG: STRATEGIC SNAPSHOT
TABLE 78. TUV SUD AG: BUSINESS FOCUS
TABLE 79. TUV SUD AG: APPLICATION/SERVICE PORTFOLIO
TABLE 80. ASUREQUALITY LTD: OVERVIEW
TABLE 81. ASUREQUALITY LTD: STRATEGIC SNAPSHOT
TABLE 82. ASUREQUALITY LTD: BUSINESS FOCUS
TABLE 83. ASUREQUALITY LTD: APPLICATION/SERVICE PORTFOLIO
TABLE 84. DEKRA SE: OVERVIEW
TABLE 85. DEKRA SE: STRATEGIC SNAPSHOT
TABLE 86. DEKRA SE: BUSINESS FOCUS
TABLE 87. DEKRA SE: APPLICATION/SERVICE PORTFOLIO
TABLE 88. TÜV RHEINLAND GROUP: OVERVIEW
TABLE 89. TÜV RHEINLAND GROUP: STRATEGIC SNAPSHOT
TABLE 90. TÜV RHEINLAND GROUP: BUSINESS FOCUS
TABLE 91. TÜV RHEINLAND GROUP: APPLICATION/SERVICE PORTFOLIO
TABLE 92. INTERTEK GROUP PLC: OVERVIEW
TABLE 93. INTERTEK GROUP PLC: STRATEGIC SNAPSHOT
TABLE 94. INTERTEK GROUP PLC: BUSINESS FOCUS
TABLE 95. INTERTEK GROUP PLC: APPLICATION/SERVICE PORTFOLIO
TABLE 96. SGS GROUP: OVERVIEW
TABLE 97. SGS GROUP: STRATEGIC SNAPSHOT
TABLE 98. SGS GROUP: BUSINESS FOCUS
TABLE 99. SGS GROUP: APPLICATION/SERVICE PORTFOLIO
TABLE 100. BUREAU VERITAS SA: OVERVIEW
TABLE 101. BUREAU VERITAS SA: STRATEGIC SNAPSHOT
TABLE 102. BUREAU VERITAS SA: BUSINESS FOCUS
TABLE 103. BUREAU VERITAS SA: APPLICATION/SERVICE PORTFOLIO
TABLE 104. DNV GL GROUP AS: OVERVIEW
TABLE 105. DNV GL GROUP AS: STRATEGIC SNAPSHOT
TABLE 106. DNV GL GROUP AS: BUSINESS FOCUS
TABLE 107. DNV GL GROUP AS: APPLICATION/SERVICE PORTFOLIO
TABLE 108. UNDERWRITERS LABORATORIES INC: OVERVIEW
TABLE 109. UNDERWRITERS LABORATORIES INC: STRATEGIC SNAPSHOT
TABLE 110. UNDERWRITERS LABORATORIES INC: BUSINESS FOCUS
TABLE 111. UNDERWRITERS LABORATORIES INC: APPLICATION/SERVICE PORTFOLIO
Research Framework
Infoholic Research works on a holistic 360° approach in order to deliver high quality, validated and reliable information in our market reports. The Market estimation and forecasting involves following steps:
- Data Collation (Primary & Secondary)
- In-house Estimation (Based on proprietary data bases and Models)
- Market Triangulation
- Forecasting

Market related information is congregated from both primary and secondary sources.
Primary sources
Involved participants from all global stakeholders such as Solution providers, service providers, Industry associations, thought leaders etc. across levels such as CXOs, VPs and managers. Plus, our in-house industry experts having decades of industry experience contribute their consulting and advisory services.
Secondary sources
Include public sources such as regulatory frameworks, government IT spending, government demographic indicators, industry association statistics, and company publications along with paid sources such as Factiva, OneSource, Bloomberg among others.
![]()


