
Software-Defined Networking Market by Solution (Physical Network Infrastructure, Virtualization/Control Software, SDN Applications, and Professional Services), End-User (Cloud Service Providers (CSPs), Technology Service Providers (TSPs) and Enterprises), Vertical (Banking, Financial Services, and Insurance, Telecom & Information Technology, Consumer Goods & Retail, Manufacturing, Government & Defense, Academia & Research and Others) and Geography – Global Forecast up to 2027
- May, 2021
- Domain: ICT - Infrastructure Networking & Data centres (IND)
- Get Free 10% Customization in this Report
Software-Defined Networking is a networking structure where the network management is decoupled from forwarding and provides a programmatically effective network configuration to improve network performance. It focuses on delivering an open interface that helps develop the software to regulate data traffic flow among the network resources. The increasing trend of network infrastructure automation and the extensive adoption of cloud-computing services and big data analytics among various industries are the major factors compelling the market's growth. There is an elevating demand for efficient networking solutions, including software-defined networking for data center consolidation, server virtualization, and enhancing enterprise potency. In addition to this, with the rising adoption of Bring-Your-Own-Devices (BYOD), organizations are vastly using software-defined networking solutions to customize and control the data accessed by employees and minimize the mobile workforce. Apart from this, the SDN controller is the perfect attack platform offering total hacker control of the network, which is a critical factor in limiting the market growth. The Software-Defined Networking Market is expected to grow at the rate of 13.8% CAGR by 2027.
Research Methodology:
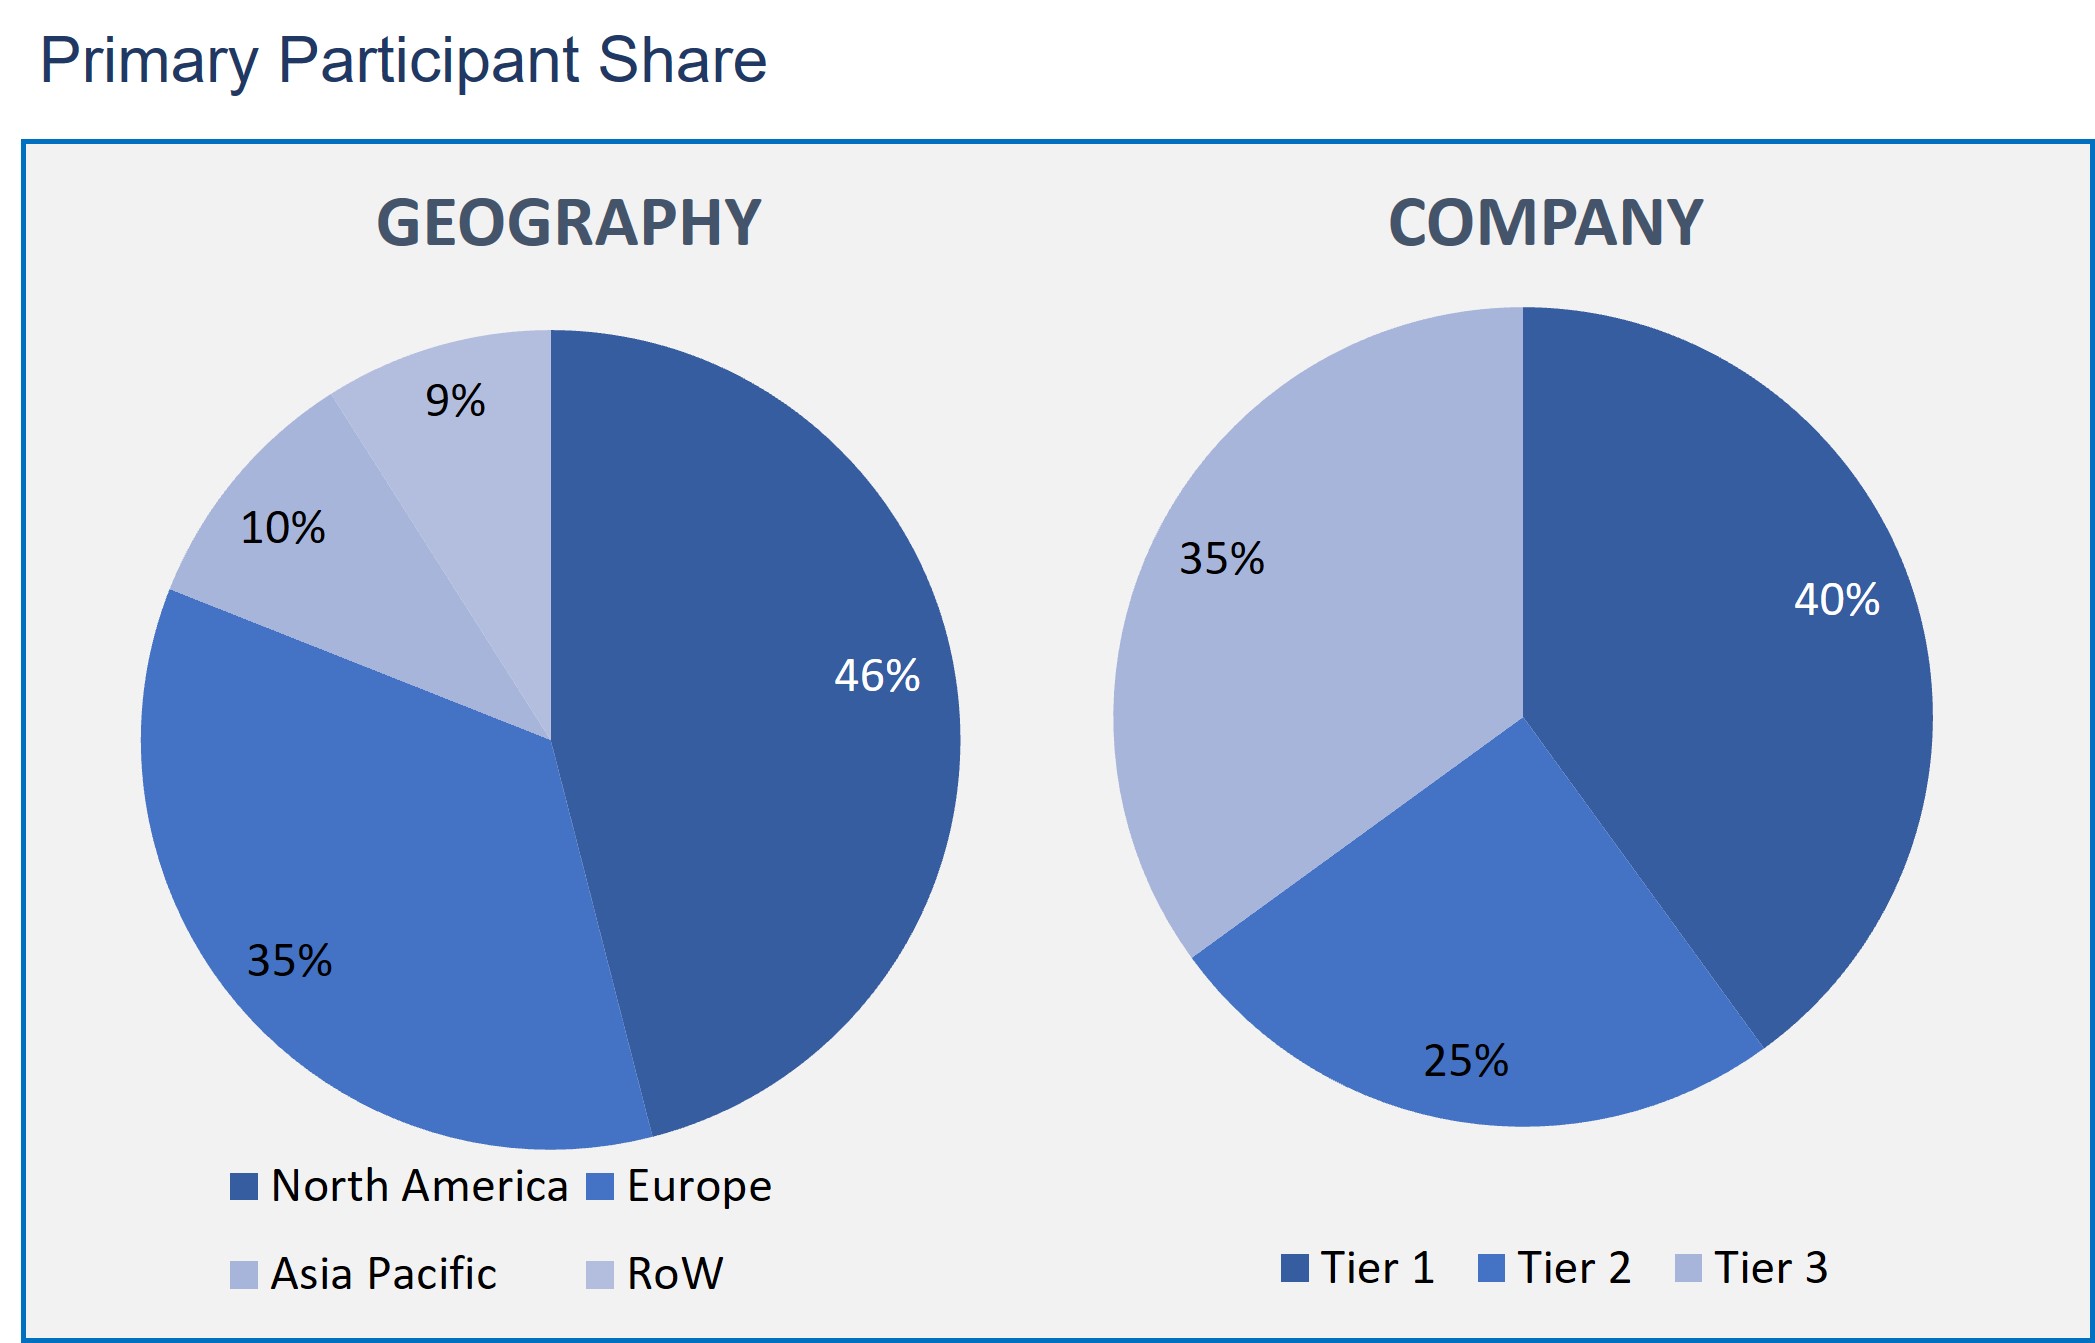
The Software-Defined Networking Market has been analyzed by utilizing the optimum combination of secondary sources and in-house methodology and a unique balance of primary insights. The real-time valuation of the market is an integral part of our forecasting and market sizing methodology. Industry experts and our primary participants have helped to compile related aspects with accurate parametric estimations for a complete study. The primary participants share is given below:
Software-Defined Networking by Solution
- Physical Network Infrastructure
- Virtualization/Control Software
- SDN Applications
- Professional Services
Software-Defined Networking by End User
- Cloud Service Providers (CSPs)
- Technology Service Providers (TSPs)
- Enterprises
Software-Defined Networking by Vertical
- Banking, Financial Services, and Insurance
- Telecom & Information Technology
- Consumer Goods & Retail
- Manufacturing
- Government & Defense
- Academia & Research
- Others
Software-Defined Networking by Geography
- North America
- Europe
- Asia Pacific
- Rest of the World
The physical network infrastructure is projected to have the highest share in the software-defined networking market growth based on the solution segment. The software-defined networking majorly spreads in the industry and handles the flow control among the network devices and the application.
On the basis of end-user, the enterprise segment is expected to be the leading segment in the software-defined networking market. The key factors fostering the SDN adoption in the enterprise space include improved infrastructure flexibility and the requirement to minimize the time-to-market of several applications and services. For SDN to be employed across the enterprise, it is essential to ensure the complete knowledge of the implementation.
The telecom and IT vertical is projected to hold a significant share in the software-defined networking market as per the vertical segmentation. This is due to an increasing number of telecom and IT companies moving towards web-based applications and services. Less operational costs, holistic infrastructure management, abstraction, and integration with the cloud are the few major factors contributing to the rising adoption of software-defined networking in the telecom and IT vertical.
As per the geographical analysis, North America has a major position in the market share. This is ascribed to the early and rapid adoption of technologies, such as cloud computing, mobility services, network functions virtualization, Bring Your Own Device (BYOD), and high industrialization in the region.
The exponential development in the size and complexity of network infrastructures in the past few years has created a requirement for solutions to simplify and effectively manage the whole network. SDN solutions directly handle these problems by offering more flexibility in traffic management to the operator to enhance the network's efficiency. Hence, most Communication Service Providers (CSPs) worldwide are investing in software-defined networking for end-to-end network, service management, and control, stimulating the software-defined networking market growth.
Leading competitors operating in the software-defined networking market are Arista Networks Inc., International Business Machines Corporation, Cisco Systems Inc., Citrix Systems Inc., Hewlett-Packard Enterprise Company, Cloudgenix Inc., Extreme Networks Inc., Cumulus Networks Inc., Dell Technologies Inc., and Juniper Networks Inc.
Henceforth, software-defined networking transforms the conventional way of networking. The objective of the approach is to avoid the physical infrastructure limitations of the network. It offers a cost-effective, application-centric networking approach and allows network functions to be virtualized with the implementation of NFV.
- This study helps in understanding the analysis of the market size based on quantitative and qualitative.
- This report provides complete information about the key factors fostering or restricting the market's growth, such as opportunities, drivers, industry-specific challenges, and risks.
- This report majorly highlights significant players' profiles to describe the market competition outlook, SWOT analysis, and development strategies in the coming years.
- This report also covers the geographical analysis of the market as per the market share and the future prospective.
- Executive Summary
- Industry Outlook
- Industry Overview
- Industry Trends
- Market Snapshot
- Market Definition
- Market Outlook
- Porter Five Forces
- Related Markets
- Market characteristics
- Market Overview
- Market Segmentation
- Market Dynamics
- Drivers
- Restraints
- Opportunities
- DRO - Impact Analysis
- Solution: Market Size & Analysis
- Overview
- Physical Network Infrastructure
- Virtualization/Control Software
- SDN Applications
- Professional Services
- End User: Market Size & Analysis
- Overview
- Cloud Service Providers (CSPs)
- Technology Service Providers (TSPs)
- Enterprises
- Vertical: Market Size & Analysis
- Overview
- Banking, Financial Services and Insurance
- Telecom & Information Technology
- Consumer Goods & Retail
- Manufacturing
- Government & Defense
- Academia & Research
- Others
- Geography: Market Size & Analysis
- Overview
- North America
- Europe
- Asia Pacific
- Rest of the World
- Competitive Landscape
- Competitor Comparison Analysis
- Market Developments
- Mergers and Acquisitions, Legal, Awards, Partnerships
- Product Launches and execution
- Vendor Profiles
- Arista Networks Inc.
- Overview
- Financial Overview
- Product Offerings
- Developments
- Business Strategy
- International Business Machines Corporation
- Overview
- Financial Overview
- Product Offerings
- Developments
- Business Strategy
- Cisco Systems Inc.
- Overview
- Financial Overview
- Product Offerings
- Developments
- Business Strategy
- Citrix Systems Inc.
- Overview
- Financial Overview
- Product Offerings
- Developments
- Business Strategy
- Hewlett-Packard Enterprise Company
- Overview
- Financial Overview
- Product Offerings
- Developments
- Business Strategy
- Cloudgenix Inc.
- Overview
- Financial Overview
- Product Offerings
- Developments
- Business Strategy
- Extreme Networks Inc.
- Overview
- Financial Overview
- Product Offerings
- Developments
- Business Strategy
- Cumulus Networks Inc.
- Overview
- Financial Overview
- Product Offerings
- Developments
- Business Strategy
- Dell Technologies Inc.
- Overview
- Financial Overview
- Product Offerings
- Developments
- Business Strategy
- Juniper Networks Inc.
- Overview
- Financial Overview
- Product Offerings
- Developments
- Business Strategy
- Arista Networks Inc.
- Analyst Opinion
- Annexure
- Report Scope
- Market Definitions
- Research Methodology
- Data Collation and In-house Estimation
- Market Triangulation
- Forecasting
- Report Assumptions
- Declarations
- Stakeholders
- Abbreviations
TABLE 1. GLOBAL SOFTWARE DEFINED NETWORKING MARKET VALUE, BY SOLUTION, 2021-2027 (USD BILLION)
TABLE 2. GLOBAL SOFTWARE DEFINED NETWORKING MARKET VALUE FOR PHYSICAL NETWORK INFRASTRUCTURE, BY GEOGRAPHY, 2021-2027 (USD BILLION)
TABLE 3. GLOBAL SOFTWARE DEFINED NETWORKING MARKET VALUE FOR VIRTUALIZATION/CONTROL SOFTWARE, BY GEOGRAPHY, 2021-2027 (USD BILLION)
TABLE 4. GLOBAL SOFTWARE DEFINED NETWORKING MARKET VALUE FOR SDN APPLICATIONS, BY GEOGRAPHY, 2021-2027 (USD BILLION)
TABLE 5. GLOBAL SOFTWARE DEFINED NETWORKING MARKET VALUE FOR PROFESSIONAL SERVICES, BY GEOGRAPHY, 2021-2027 (USD BILLION)
TABLE 6. GLOBAL SOFTWARE DEFINED NETWORKING MARKET VALUE, BY END USER, BY GEOGRAPHY, 2021-2027 (USD BILLION)
TABLE 7. GLOBAL SOFTWARE DEFINED NETWORKING MARKET VALUE FOR CLOUD SERVICE PROVIDERS (CSPS), BY GEOGRAPHY, 2021-2027 (USD BILLION)
TABLE 8. GLOBAL SOFTWARE DEFINED NETWORKING MARKET VALUE FOR TECHNOLOGY SERVICE PROVIDERS (TSPS), BY GEOGRAPHY, 2021-2027 (USD BILLION)
TABLE 9. GLOBAL SOFTWARE DEFINED NETWORKING MARKET VALUE FOR ENTERPRISES, BY GEOGRAPHY, 2021-2027 (USD BILLION)
TABLE 10. GLOBAL SOFTWARE DEFINED NETWORKING MARKET VALUE, BY VERTICAL, 2021-2027 (USD BILLION)
TABLE 11. GLOBAL SOFTWARE DEFINED NETWORKING MARKET VALUE FOR BANKING, FINANCIAL SERVICES AND INSURANCE, BY GEOGRAPHY, 2021-2027 (USD BILLION)
TABLE 12. GLOBAL SOFTWARE DEFINED NETWORKING MARKET VALUE FOR TELECOM & INFORMATION TECHNOLOGY, BY GEOGRAPHY, 2021-2027 (USD BILLION)
TABLE 13. GLOBAL SOFTWARE DEFINED NETWORKING MARKET VALUE FOR CONSUMER GOODS & RETAIL, BY GEOGRAPHY, 2021-2027 (USD BILLION)
TABLE 14. GLOBAL SOFTWARE DEFINED NETWORKING MARKET VALUE FOR MANUFACTURING, BY GEOGRAPHY, 2021-2027 (USD BILLION)
TABLE 15. GLOBAL SOFTWARE DEFINED NETWORKING MARKET VALUE FOR GOVERNMENT & DEFENSE, BY GEOGRAPHY, 2021-2027 (USD BILLION)
TABLE 16. GLOBAL SOFTWARE DEFINED NETWORKING MARKET VALUE FOR ACADEMIA & RESEARCH, BY GEOGRAPHY, 2021-2027 (USD BILLION)
TABLE 17. GLOBAL SOFTWARE DEFINED NETWORKING MARKET VALUE FOR OTHERS, BY GEOGRAPHY, 2021-2027 (USD BILLION)
TABLE 18. NORTH AMERICA SOFTWARE DEFINED NETWORKING MARKET VALUE, BY COUNTRY, 2021-2027 (USD BILLION)
TABLE 19. NORTH AMERICA SOFTWARE DEFINED NETWORKING MARKET VALUE, BY SOLUTION, 2021-2027 (USD BILLION)
TABLE 20. NORTH AMERICA SOFTWARE DEFINED NETWORKING MARKET VALUE, BY END USER, 2021-2027 (USD BILLION)
TABLE 21. NORTH AMERICA SOFTWARE DEFINED NETWORKING MARKET VALUE, BY VERTICAL, 2021-2027 (USD BILLION)
TABLE 22. U.S SOFTWARE DEFINED NETWORKING MARKET VALUE, BY SOLUTION, 2021-2027 (USD BILLION)
TABLE 23. U.S SOFTWARE DEFINED NETWORKING MARKET VALUE, BY END USER, 2021-2027 (USD BILLION)
TABLE 24. U.S SOFTWARE DEFINED NETWORKING MARKET VALUE, BY VERTICAL, 2021-2027 (USD BILLION)
TABLE 25. CANADA SOFTWARE DEFINED NETWORKING MARKET VALUE, BY SOLUTION, 2021-2027 (USD BILLION)
TABLE 26. CANADA SOFTWARE DEFINED NETWORKING MARKET VALUE, BY END USER, 2021-2027 (USD BILLION)
TABLE 27. CANADA SOFTWARE DEFINED NETWORKING MARKET VALUE, BY VERTICAL, 2021-2027 (USD BILLION)
TABLE 28. EUROPE SOFTWARE DEFINED NETWORKING MARKET VALUE, BY COUNTRY, 2021-2027 (USD BILLION)
TABLE 29. EUROPE SOFTWARE DEFINED NETWORKING MARKET VALUE, BY SOLUTION, 2021-2027 (USD BILLION)
TABLE 30. EUROPE SOFTWARE DEFINED NETWORKING MARKET VALUE, BY END USER, 2021-2027 (USD BILLION)
TABLE 31. EUROPE SOFTWARE DEFINED NETWORKING MARKET VALUE, VERTICAL, 2021-2027 (USD BILLION)
TABLE 32. GERMANY SOFTWARE DEFINED NETWORKING MARKET VALUE, BY SOLUTION, 2021-2027 (USD BILLION)
TABLE 33. GERMANY SOFTWARE DEFINED NETWORKING MARKET VALUE, BY END USER, 2021-2027 (USD BILLION)
TABLE 34. GERMANY SOFTWARE DEFINED NETWORKING MARKET VALUE, BY VERTICAL, 2021-2027 (USD BILLION)
TABLE 35. U.K SOFTWARE DEFINED NETWORKING MARKET VALUE, BY SOLUTION, 2021-2027 (USD BILLION)
TABLE 36. U.K SOFTWARE DEFINED NETWORKING MARKET VALUE, BY END USER, 2021-2027 (USD BILLION)
TABLE 37. U.K SOFTWARE DEFINED NETWORKING MARKET VALUE, BY VERTICAL, 2021-2027 (USD BILLION)
TABLE 38. FRANCE SOFTWARE DEFINED NETWORKING MARKET VALUE, BY SOLUTION, 2021-2027 (USD BILLION)
TABLE 39. FRANCE SOFTWARE DEFINED NETWORKING MARKET VALUE, BY END USER, 2021-2027 (USD BILLION)
TABLE 40. FRANCE SOFTWARE DEFINED NETWORKING MARKET VALUE, BY VERTICAL, 2021-2027 (USD BILLION)
TABLE 41. ITALY SOFTWARE DEFINED NETWORKING MARKET VALUE, BY SOLUTION, 2021-2027 (USD BILLION)
TABLE 42. ITALY SOFTWARE DEFINED NETWORKING MARKET VALUE, BY END USER, 2021-2027 (USD BILLION)
TABLE 43. ITALY SOFTWARE DEFINED NETWORKING MARKET VALUE, BY VERTICAL, 2021-2027 (USD BILLION)
TABLE 44. SPAIN SOFTWARE DEFINED NETWORKING MARKET VALUE, BY SOLUTION, 2021-2027 (USD BILLION)
TABLE 45. SPAIN SOFTWARE DEFINED NETWORKING MARKET VALUE, BY END USER, 2021-2027 (USD BILLION)
TABLE 46. SPAIN SOFTWARE DEFINED NETWORKING MARKET VALUE, BY VERTICAL, 2021-2027 (USD BILLION)
TABLE 47. ROE SOFTWARE DEFINED NETWORKING MARKET VALUE, BY SOLUTION, 2021-2027 (USD BILLION)
TABLE 48. ROE SOFTWARE DEFINED NETWORKING MARKET VALUE, BY END USER, 2021-2027 (USD BILLION)
TABLE 49. ROE SOFTWARE DEFINED NETWORKING MARKET VALUE, BY VERTICAL, 2021-2027 (USD BILLION)
TABLE 50. ASIA PACIFC SOFTWARE DEFINED NETWORKING MARKET VALUE, BY COUNTRY, 2021-2027 (USD BILLION)
TABLE 51. ASIA PACIFC SOFTWARE DEFINED NETWORKING MARKET VALUE, BY SOLUTION, 2021-2027 (USD BILLION)
TABLE 52. ASIA PACIFC SOFTWARE DEFINED NETWORKING MARKET VALUE, BY END USER, 2021-2027 (USD BILLION)
TABLE 53. ASIA PACIFC SOFTWARE DEFINED NETWORKING MARKET VALUE, BY VERTICAL, 2021-2027 (USD BILLION)
TABLE 54. CHINA SOFTWARE DEFINED NETWORKING MARKET VALUE, BY SOLUTION, 2021-2027 (USD BILLION)
TABLE 55. CHINA SOFTWARE DEFINED NETWORKING MARKET VALUE, BY END USER, 2021-2027 (USD BILLION)
TABLE 56. CHINA SOFTWARE DEFINED NETWORKING MARKET VALUE, BY VERTICAL, 2021-2027 (USD BILLION)
TABLE 57. INDIA SOFTWARE DEFINED NETWORKING MARKET VALUE, BY SOLUTION, 2021-2027 (USD BILLION)
TABLE 58. INDIA SOFTWARE DEFINED NETWORKING MARKET VALUE, BY END USER, 2021-2027 (USD BILLION)
TABLE 59. INDIA SOFTWARE DEFINED NETWORKING MARKET VALUE, BY VERTICAL, 2021-2027 (USD BILLION)
TABLE 60. JAPAN SOFTWARE DEFINED NETWORKING MARKET VALUE, BY SOLUTION, 2021-2027 (USD BILLION)
TABLE 61. JAPAN SOFTWARE DEFINED NETWORKING MARKET VALUE, BY END USER, 2021-2027 (USD BILLION)
TABLE 62. JAPAN SOFTWARE DEFINED NETWORKING MARKET VALUE, BY VERTICAL, 2021-2027 (USD BILLION)
TABLE 63. REST OF APAC SOFTWARE DEFINED NETWORKING MARKET VALUE, BY SOLUTION, 2021-2027 (USD BILLION)
TABLE 64. REST OF APAC SOFTWARE DEFINED NETWORKING MARKET VALUE, BY END USER, 2021-2027 (USD BILLION)
TABLE 65. REST OF APAC SOFTWARE DEFINED NETWORKING MARKET VALUE, BY VERTICAL, 2021-2027 (USD BILLION)
TABLE 66. REST OF WORLD SOFTWARE DEFINED NETWORKING MARKET VALUE, BY SOLUTION, 2021-2027 (USD BILLION)
TABLE 67. REST OF WORLD SOFTWARE DEFINED NETWORKING MARKET VALUE, BY END USER, 2021-2027 (USD BILLION)
TABLE 68. REST OF WORLD SOFTWARE DEFINED NETWORKING MARKET VALUE, BY VERTICAL, 2021-2027 (USD BILLION)
TABLE 69. ARISTA NETWORKS INC.: FINANCIALS
TABLE 70. ARISTA NETWORKS INC.: PRODUCTS & SERVICES
TABLE 71. ARISTA NETWORKS INC.: RECENT DEVELOPMENTS
TABLE 72. INTERNATIONAL BUSINESS MACHINES CORPORATION: FINANCIALS
TABLE 73. INTERNATIONAL BUSINESS MACHINES CORPORATION: PRODUCTS & SERVICES
TABLE 74. INTERNATIONAL BUSINESS MACHINES CORPORATION: RECENT DEVELOPMENTS
TABLE 75. CISCO SYSTEMS INC: FINANCIALS
TABLE 76. CISCO SYSTEMS INC: PRODUCTS & SERVICES
TABLE 77. CISCO SYSTEMS INC: RECENT DEVELOPMENTS
TABLE 78. HEWLETT-PACKARD ENTERPRISE COMPANY: FINANCIALS
TABLE 79. HEWLETT-PACKARD ENTERPRISE COMPANY: PRODUCTS & SERVICES
TABLE 80. HEWLETT-PACKARD ENTERPRISE COMPANY: RECENT DEVELOPMENTS
TABLE 81. CLOUDGENIX INC: FINANCIALS
TABLE 82. CLOUDGENIX INC: PRODUCTS & SERVICES
TABLE 83. CLOUDGENIX INC: RECENT DEVELOPMENTS
TABLE 84. EXTREME NETWORKS INC: FINANCIALS
TABLE 85. EXTREME NETWORKS INC: PRODUCTS & SERVICES
TABLE 86. EXTREME NETWORKS INC: RECENT DEVELOPMENTS
TABLE 87. CUMULUS NETWORKS INC: FINANCIALS
TABLE 88. CUMULUS NETWORKS INC: PRODUCTS & SERVICES
TABLE 89. CUMULUS NETWORKS INC: RECENT DEVELOPMENTS
TABLE 90. DELL TECHNOLOGIES INC: FINANCIALS
TABLE 91. DELL TECHNOLOGIES INC: PRODUCTS & SERVICES
TABLE 92. DELL TECHNOLOGIES INC: RECENT DEVELOPMENTS
TABLE 93. JUNIPER NETWORKS INC: FINANCIALS
TABLE 94. JUNIPER NETWORKS INC: PRODUCTS & SERVICES
TABLE 95. JUNIPER NETWORKS INC: RECENT DEVELOPMENTS
Research Framework
Infoholic Research works on a holistic 360° approach in order to deliver high quality, validated and reliable information in our market reports. The Market estimation and forecasting involves following steps:
- Data Collation (Primary & Secondary)
- In-house Estimation (Based on proprietary data bases and Models)
- Market Triangulation
- Forecasting

Market related information is congregated from both primary and secondary sources.
Primary sources
Involved participants from all global stakeholders such as Solution providers, service providers, Industry associations, thought leaders etc. across levels such as CXOs, VPs and managers. Plus, our in-house industry experts having decades of industry experience contribute their consulting and advisory services.
Secondary sources
Include public sources such as regulatory frameworks, government IT spending, government demographic indicators, industry association statistics, and company publications along with paid sources such as Factiva, OneSource, Bloomberg among others.
![]()


