
Soap Colorants Market By Type (Water Based and Oil Based) By Application (Bar Soap, Liquid Soap, Shampoo & Conditioner and others) and By Geography – Global Driver, Restraints, Opportunities, Trends, and Forecast to 2023
- August, 2018
- Domain: Chemicals, Materials & Food - Specialty Chemicals,Agro, Pharma, Food & Personal Care
- Get Free 10% Customization in this Report
The soap colorant is a major product in the personal care products segment. In personal care products, colorants are classified into two main varieties, i.e., water-based and oil-based. It provides colors to soaps (liquid, bar, shampoo) to make them attractive.
Research Methodology
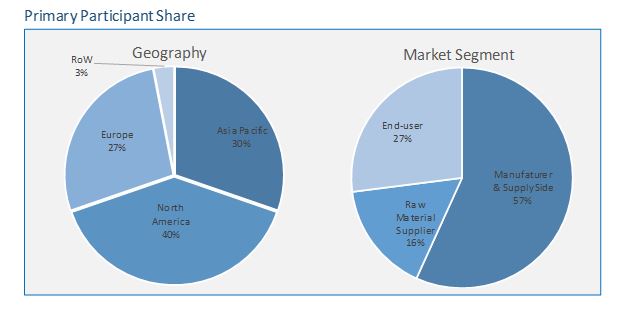
The soap colorant market has been analyzed by utilizing the optimum combination of secondary sources and in-house methodology along with an irreplaceable blend of primary insights. The real-time assessment of the market is an integral part of our market sizing and forecasting methodology. Our industry experts and panel of primary participants have helped in compiling relevant aspects with realistic parametric estimations for a comprehensive study. The participation share of different categories of primary participants is given below:
Key Market Insights
Soap colorants are widely used in bar soaps, liquid soaps, shampoo, and conditioner. The market for water-soluble base soaps is increasing as they keep the skin hydrated and maintain the balance not letting it become oily. Oil-based soaps are also increasing as they provide various nutrients to the skin and maintain the dryness level. Liquid soaps are proliferating owing to the convenient packaging and the hygiene factors as they prevent the transfer of germs through usage.
Globally, Asia Pacific is the largest soap colorant market, primarily due to the presence of export-oriented manufacturing capacities and intense domestic demand from various end-user industries. The increase in personal care manufacturers is further driving the market growth in the region. The anticipated economic stability in Europe is expected to boost its manufacturing sector, complementing the growth of the soap colorants market. North America is likely to remain the key region with a significant contribution from the US. Few of the prominent companies operating in the soap colorant market are BASF SE, Huntsman Corporation, Merck KGaA, Neelikon, and Clariant.
Types:
- Oil-based
- Water-based
Applications:
- Bar Soap
- Liquid Soap
- Shampoo & Conditioner
- Others
Geography:
- Asia Pacific
- North America
- Europe
- Rest of the World
1 Report Outline
1.1 Introduction
1.2 Report Scope
1.3 Market Definition
1.4 Research Methodology
1.4.1 Data Collation & In-house Estimation
1.4.2 Market Triangulation
1.4.3 Forecasting
1.5 Study Declarations
1.6 Report Assumptions
1.7 Stakeholders
2 Executive Summary
2.1 Asia Pacific Has Highest Growth Rate in the Soap Colorants Market
2.2 Liquid Soap is Increasing Its Market Share Due to High Growth Coming from Developing Countries
3 Market Positioning
3.1 Total Addressable Market: Global Colorants Market
3.1.1 Market Overview
3.1.2 Major Trends
3.2 Segmented Addressable Market
3.3 Related Markets
4 Market Outlook
4.1 Overview
4.2 Value Chain Analysis
4.3 PESTLE Analysis
4.4 Porter 5 (Five) Forces
4.5 Patent Analysis
5 Market Characteristics
5.1 Market Segmentation
5.2 Market Dynamics
5.2.1 Drivers
5.2.1.1 Growing demand for premium and organic soaps
5.2.1.2 Rising awareness about hygiene due to various government initiatives
5.2.2 Restraints
5.2.2.1 Regulatory approval limitation for new colors
5.2.2.2 Increasing demand of DIY
5.2.3 Opportunities
5.2.3.1 Technological development in the products
5.2.3.2 Customization of colors
5.2.4 DRO – Impact Analysis
6 By Type: Market Size and Analysis
6.1 Overview
6.2 Oil Based
6.3 Water Based
6.4 Vendor Profiles
6.4.1 Merck KGaA
6.4.2 Clariant
6.4.3 BASF SE
6.4.4 Huntsman Corporation
6.4.5 Neelikon
(Overview, business units, geographic revenues, product profile, recent developments, business focus, SWOT analysis, and business strategies have been covered for all vendors)
7 Applications: Market Size and Analysis
7.1 Overview
7.2 Bar Soap
7.3 Liquid Soap
7.4 Shampoo and Conditioner
7.5 Customer Profile
7.5.1 Unilever
7.5.2 Procter and Gamble
7.5.3 L’Oreal
7.5.4 New Avon LLC
7.5.5 REVLON
(Overview, business units, geographic revenues, product profile, and business strategies have been covered for all customers)
8 Regions: Market Size and Analysis
8.1 Overview
8.2 Asia Pacific
8.2.1 Asia Pacific Market by Countries
8.2.2 Asia Pacific Market by Type
8.2.3 Asia Pacific Market by Applications
8.3 North America
8.4 Europe
8.5 Rest of the World
(Market segmentation based on countries, type, and application has been covered for all regions)
9 Companies to watch for
9.1.1 Sudarshan Chemical Industries Limited
9.1.1.1 Overview
9.2 Increasing investment in R&D
10 Competitive Landscape
10.1 Competitor Comparison Analysis
10.2 Market Landscape
10.2.1 Mergers, Acquisitions, & Joint Ventures
10.2.2 Expansion
10.2.3 Exhibition & Product Launch
10.2.4 Restructuring & Repositioning
10.2.5 Awards & Recognition
10.2.6 Others
11 Expert’s Views
12 Annexure
Abbreviations
TABLE 1 GLOBAL SOAP COLORANTS MARKET REVENUE BY TYPE, 2016-2023 ($MILLION)
TABLE 2 GLOBAL SOAP COLORANTS MARKET VOLUME BY TECHNOLOGY, 2016-2023 (TONS)
TABLE 3 GLOBAL OIL BASED SOAP MARKET REVENUE, BY GEOGRAPHY, 2016-2023 ($MILLION)
TABLE 4 GLOBAL OIL BASED SOAP MARKET VOLUME, BY GEOGRAPHY, 2016-2023 (TONS)
TABLE 5 GLOBAL WATER BASED SOAP MARKET REVENUE, BY GEOGRAPHY, 2016-2023 ($MILLION)
TABLE 6 GLOBAL WATER BASED SOAP MARKET VOLUME, BY GEOGRAPHY, 2016-2023 (TONS)
TABLE 7 MERCK: PRODUCT PROFILE
TABLE 8 MERCK: RECENT DEVELOPMENTS
TABLE 9 CLARIANT: PRODUCT PROFILE
TABLE 10 CLARIANT: RECENT DEVELOPMENTS
TABLE 11 BASF SE: PRODUCT PROFILE
TABLE 12 BASF SE: RECENT DEVELOPMENTS
TABLE 13 HUNTSMAN CORPORATION: PRODUCT PROFILE
TABLE 14 HUNTSMAN CORPORATION: RECENT DEVELOPMENTS
TABLE 15 NEELIKON: PRODUCT PROFILE
TABLE 16 NEELIKON: RECENT DEVELOPMENTS
TABLE 17 GLOBAL SOAP COLORANTS MARKET REVENUE BY APPLICATION, 2016-2023 ($MILLION)
TABLE 18 GLOBAL SOAP COLORANTS MARKET VOLUME BY APPLICATIONS, 2016-2023 (TONS)
TABLE 19 GLOBAL COLORANTS IN BAR SOAP MARKET VALUE, BY GEOGRAPHY, 2016-2023 ($MILLION)
TABLE 20 GLOBAL BAR SOAP IN SOAP COLORANTS MARKET VOLUME, BY GEOGRAPHY, 2016-2023 (TONS)
TABLE 21 GLOBAL COLRANTS IN LIQUID SOAPS MARKET VALUE, BY GEOGRAPHY, 2016-2023 ($MILLION)
TABLE 22 GLOBAL COLRANTS IN LIQUID SOAPS MARKET VOLUME, BY GEOGRAPHY, 2016-2023 (TONS)
TABLE 23 GLOBAL SOAP COLORANTS IN SHAMPOO & CONDITIONER MARKET REVENUE, BY GEOGRAPHY, 2016-2023 ($MILLION)
TABLE 24 GLOBAL COLORANTS IN SHAPOO & CONDITIONER MARKET VOLUME, BY GEOGRAPHY, 2016-2023 (TONS)
TABLE 25 UNILEVER: PRODUCT PROFILE
TABLE 26 P&G: PRODUCT PROFILE
TABLE 27 L'OREAL: PRODUCT PROFILE
TABLE 28 NEW AVON LLC: PRODUCT PROFILE
TABLE 29 GLOBAL SOAP COLORANTS MARKET VALUE, BY GEOGRAPHY, 2016−2023 ($MILLION)
TABLE 30 GLOBAL SOAP COLORANTS MARKET VOLUME, BY GEOGRAPHY, 2016−2023 (TONS)
TABLE 31 ASIA PACIFIC SOAP COLORANT VALUE, BY COUNTRY, 2016−2023 ($MILLION)
TABLE 32 ASIA PACIFIC SOAP COLORANTS MARKET VOLUME, BY COUNTRY, 2016−2023 (KILOTONS)
TABLE 33 ASIA PACIFIC SOAP COLORANTS MARKET VALUE, BY TYPE, 2016−2023 ($MILLION)
TABLE 34 ASIA PACIFIC SOAP COLORANTS MARKET VOLUME, BY TYPE, 2016−2023 (TONS)
TABLE 35 ASIA PACIFIC SOAP COLORANTS MARKET VALUE, BY APPLICATIONS, 2016−2023 ($MILLION)
TABLE 36 ASIA PACIFIC SOAP COLORANTS MARKET VOLUME, BY APPLICATIONS, 2016−2023 (TONS)
TABLE 37 NORTH AMERICA SOAP COLORANTS MARKET VALUE, BY COUNTRY, 2016−2023 ($MILLION)
TABLE 38 NORTH AMERICA SOAP COLORANTS MARKET VOLUME, BY COUNTRY, 2016−2023 (TONS)
TABLE 39 NORTH AMERICA SOAP COLORANTS MARKET VALUE, BY TYPE, 2016−2023 ($MILLION)
TABLE 40 NORTH AMERICA SOAP COLORANTS MARKET VOLUME, BY TYPE, 2016−2023 (TONS)
TABLE 41 NORTH AMERICA SOAP COLORANTS MARKET VALUE, BY APPLICATIONS, 2016−2023 ($MILLION)
TABLE 42 NORTH AMERICA SOAP COLORANTS MARKET VOLUME, BY APPLICATIONS, 2016−2023 (TONS)
TABLE 43 EUROPE SOAP COLORANTS MARKET VALUE, BY COUNTRY, 2016−2023 ($MILLION)
TABLE 44 EUROPE SOAP COLORANTS MARKET VOLUME, BY COUNTRY, 2016−2023
TABLE 45 EUROPE SOAP COLORNATS MARKET VALUE, BY TYPE, 2016−2023 ($MILLION)
TABLE 46 EUROPE SOAP COLROANTS MARKET VOLUME, BY TYPE, 2016−2023 (TONS)
TABLE 47 EUROPE SOAP COLORANTS MARKET VALUE, BY APPLICATION, 2016−2023 ($MILLION)
TABLE 48 EUROPE SOAP COLORANTS MARKET VOLUME, BY APPLICATIONS, 2016−2023 (TONS)
TABLE 49 REST OF THE WORLD SOAP COLORANTS MARKET VALUE, BY GEOGRAPHY, 2016−2023 ($MILLION)
TABLE 50 REST OF THE WORLD SOAP COLORANTS MARKET VOLUME, BY GEOGRAPHY, 2015−2022 (TONS)
TABLE 51 REST OF THE WORLD SOAP COLORANTS MARKET VALUE, BY TYPE, 2016−2023 ($MILLION)
TABLE 52 REST OF THE WORLD SOAP COLORANTS MARKET VOLUME, BY TYPE, 2016−2023 (TONS)
TABLE 53 REST OF THE WORLD SOAP COLORANTS MARKET VALUE, BY APPLICATIONS, 2016−2023 ($MILLION)
TABLE 54 REST OF THE WORLD SOAP COLORANTS MARKET VOLUME, BY APPLICATIONS, 2016−2023 (TONS)
TABLE 55 MERGERS, ACQUISITIONS, & JOINT VENTURES
TABLE 56 EXPANSION
TABLE 57 EXHIBITION & PRODUCT LAUNCH
TABLE 58 RESTRUCTURING & REPOSITIONING
TABLE 59 AWARDS & RECOGNITION
TABLE 60 OTHERS
Research Framework
Infoholic Research works on a holistic 360° approach in order to deliver high quality, validated and reliable information in our market reports. The Market estimation and forecasting involves following steps:
- Data Collation (Primary & Secondary)
- In-house Estimation (Based on proprietary data bases and Models)
- Market Triangulation
- Forecasting

Market related information is congregated from both primary and secondary sources.
Primary sources
Involved participants from all global stakeholders such as Solution providers, service providers, Industry associations, thought leaders etc. across levels such as CXOs, VPs and managers. Plus, our in-house industry experts having decades of industry experience contribute their consulting and advisory services.
Secondary sources
Include public sources such as regulatory frameworks, government IT spending, government demographic indicators, industry association statistics, and company publications along with paid sources such as Factiva, OneSource, Bloomberg among others.
![]()


