
Smart Hospitals Market based on Component, Service Rendered, Connectivity, Application and Geography, projected to grow at CAGR of 25.1% during 2021–2027
- July, 2021
- Domain: ICT - digital technologies
- Get Free 10% Customization in this Report
The collection of technological advancements in medical devices for the safety of patients and efficiency within hospitals or connected through software to clinical information systems. Such hospitals are known as smart hospitals. IoT plays a prominent role in establishing smart hospitals through devices, system components, and networks. Smart hospitals are modifying the healthcare industry, as electronic devices gather information of patients’ significant signs and share it with physicians, and patients can track their records. The modernization of healthcare infrastructure and the rising usage of connected devices and instruments in hospitals are fueling the market growth. The increasing requirement for cost-effective application in hospitals and implementing IoT technologies in healthcare strengthens the market value. The increasing prevalence of chronic diseases all around the globe whose patients require long-term support and constant monitoring of health conditions is further propelling the market value. On the other hand, the huge cost of connected systems is likely to hamper market growth. The Smart Hospital Market is anticipated to grow at the rate of 25.1% CAGR by 2027.
Research Methodology:
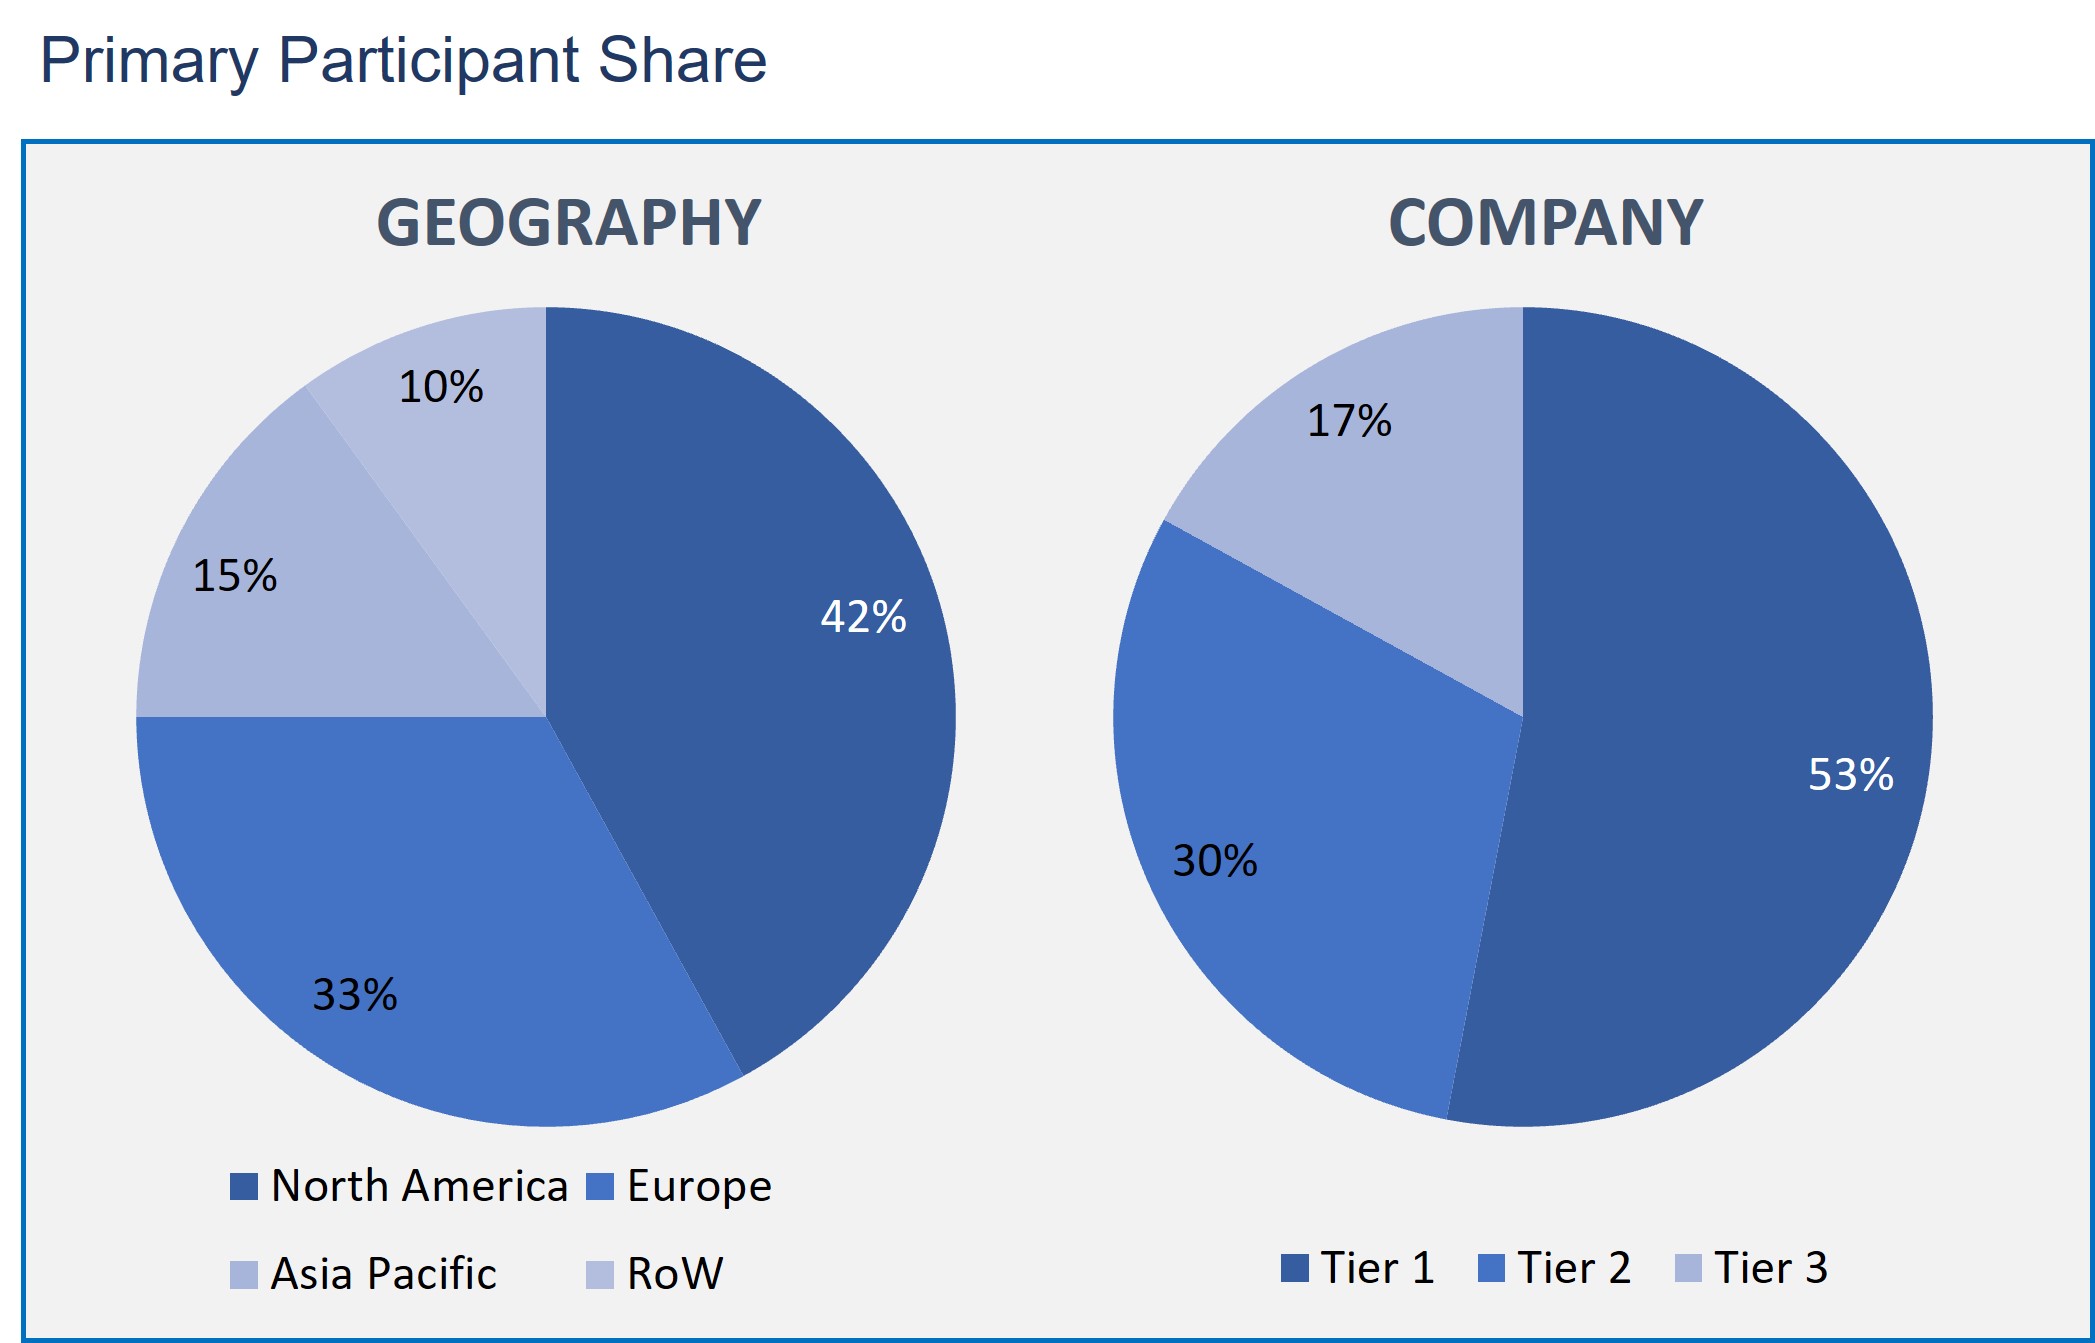
The Smart Hospital Market has been analyzed by utilizing the optimum combination of secondary sources and in-house methodology and a unique balance of primary insights. The real-time valuation of the market is an integral part of our forecasting and market sizing methodology. Industry experts and our primary participants have helped to compile related aspects with accurate parametric estimations for a complete study. The primary participants share is given below:
Smart Hospital Market based on Component
- Hardware
- System & Software
- Service
Smart Hospital Market based on Service Rendered
- General Services
- Specialty
- Super Specialty
Smart Hospital Market based on Connectivity
- Wired
- Wireless
Smart Hospital Market by Application
- Remote Medicine Management
- Medical Assistance
- Medical Connected Imaging
- Electronic Health Record & Clinical Workflow
- Others
Smart Hospital Market based on Geography
- North America
- Europe
- Asia Pacific
- Rest of the World
The hardware segment is likely to be the most lucrative segment based on components, due to the immense utilization of hardware in hospital settings. Several types of hardware devices are used in hospitals, including wearable, implanted, and other stationary devices for patient health management. Therefore, increased utilization of such devices is projected to drive the growth of the smart hospitals market.
Based on service rendered, the general segment commanded the global smart hospitals market, as general hospitals have a robust presence worldwide. Additionally, the advent of technologically advanced solutions in general hospitals is anticipated to provide patients access to several services and solutions.
As per the connectivity, the smart hospitals market has been bifurcated into wired and wireless. However, the wireless segment has a prominent share in the market. This is ascribed to smart hospitals' development using wireless networks, such as IoT, wireless devices, or sensors.
Further based on application, the global smart hospitals market has been categorized into Remote Medicine Management, Medical Assistance, Medical Connected Imaging, Electronic Health Record & Clinical Workflow, and Others. The electronic health records & clinical workflow segment has registered the major share in the smart hospital market. Smart hospital offers access to patient records and enables secured sharing of electronic information among patients and clinics.
In the geographical market, North America has the highest market share. This is due to the well-advanced healthcare infrastructure coupled with the rapid adoption and development of technologies in the healthcare sector, favoring the regional market value. The substantial spending power of people in the region is also bolstering the regional market value.
The increasing demand for improved quality of treatment and healthcare services in hospitals and increased productivity, which offer more efficacy services, are projected to considerably stimulate global market growth. In addition, smart hospitals offered patient satisfaction with an emphasis on better care of patients and minimize pressure on the hospital professionals, which reduces errors during treatment procedures, contributing to global market growth.
The smart hospital market report consists of the list of key market players: Allscripts Healthcare, LLC, Honeywell International Inc., Alphabet Inc. (Google Inc.), Next IT Corp., Enlitic Inc., General Vision, Intel Corporation, IBM Corporation, Microsoft Corporation, and Nvidia Corporation.
As a result, the increasing technological advancements have substantial modified the hospital facilities around the world. These are technological advancements in the healthcare industry that look forward to offering a wide range of services. Smart hospitals merge with technology design to enhance patient care.
- The research report of the smart hospital market includes changing market trends, propelling factors, and opportunities.
- This research represents the complete market segmentation coupled with past, present, and forthcoming market size regarding qualitative and quantitative analysis.
- This research consists of novel market innovations and developments in products taking place in the market.
- The report also mentions all the potential segments and geographical regions depicting the growth of the market.
- Executive Summary
- Industry Outlook
- Industry Overview
- Industry Trends
- Market Snapshot
- Market Definition
- Market Outlook
- Porter Five Forces
- Related Markets
- Market characteristics
- Market Overview
- Market Segmentation
- Market Dynamics
- Drivers
- Restraints
- Opportunities
- DRO - Impact Analysis
- Component: Market Size & Analysis
- Overview
- Hardware
- System & Software
- Service
- Service Rendered: Market Size & Analysis
- Overview
- General Services
- Specialty
- Super Specialty
- Connectivity: Market Size & Analysis
- Overview
- Wired
- Wireless
- Application: Market Size & Analysis
- Overview
- Remote Medicine Management
- Medical Assistance
- Medical Connected Imaging
- Electronic Health Record & Clinical Workflow
- Others
- Geography: Market Size & Analysis
- Overview
- North America
- Europe
- Asia Pacific
- Rest of the World
- Competitive Landscape
- Competitor Comparison Analysis
- Market Developments
- Mergers and Acquisitions, Legal, Awards, Partnerships
- Product Launches and execution
- Vendor Profiles
- Allscripts Healthcare, LLC
- Overview
- Financial Overview
- Product Offerings
- Developments
- Business Strategy
- Honeywell International Inc.
- Overview
- Financial Overview
- Product Offerings
- Developments
- Business Strategy
- Alphabet Inc. (Google Inc.)
- Overview
- Financial Overview
- Product Offerings
- Developments
- Business Strategy
- Next IT Corp.
- Overview
- Financial Overview
- Product Offerings
- Developments
- Business Strategy
- Enlitic Inc.
- Overview
- Financial Overview
- Product Offerings
- Developments
- Business Strategy
- General Vision
- Overview
- Financial Overview
- Product Offerings
- Developments
- Business Strategy
- Intel Corporation
- Overview
- Financial Overview
- Product Offerings
- Developments
- Business Strategy
- IBM Corporation
- Overview
- Financial Overview
- Product Offerings
- Developments
- Business Strategy
- Microsoft Corporation
- Overview
- Financial Overview
- Product Offerings
- Developments
- Business Strategy
- Nvidia Corporation
- Overview
- Financial Overview
- Product Offerings
- Developments
- Business Strategy
- Allscripts Healthcare, LLC
- Analyst Opinion
- Annexure
- Report Scope
- Market Definitions
- Research Methodology
- Data Collation and In-house Estimation
- Market Triangulation
- Forecasting
- Report Assumptions
- Declarations
- Stakeholders
- Abbreviations
TABLE 1. GLOBAL SMART HOSPITAL MARKET VALUE, BY COMPONENT, 2021-2027 (USD BILLION)
TABLE 2. GLOBAL SMART HOSPITAL MARKET VALUE FOR HARDWARE, BY GEOGRAPHY, 2021-2027 (USD BILLION)
TABLE 3. GLOBAL SMART HOSPITAL MARKET VALUE FOR SYSTEM & SOFTWARE, BY TYPE, 2021-2027 (USD BILLION)
TABLE 4. GLOBAL SMART HOSPITAL MARKET VALUE FOR SERVICE, BY GEOGRAPHY, 2021-2027 (USD BILLION)
TABLE 5. GLOBAL SMART HOSPITAL MARKET VALUE, BY SERVICE RENDERED, 2021-2027 (USD BILLION)
TABLE 6. GLOBAL SMART HOSPITAL MARKET VALUE FOR GENERAL SERVICES, BY GEOGRAPHY, 2021-2027 (USD BILLION)
TABLE 7. GLOBAL SMART HOSPITAL MARKET VALUE FOR SPECIALTY, BY GEOGRAPHY, 2021-2027 (USD BILLION)
TABLE 8. GLOBAL SMART HOSPITAL MARKET VALUE FOR SUPER SPECIALTY, BY GEOGRAPHY, 2021-2027 (USD BILLION)
TABLE 9. GLOBAL SMART HOSPITAL MARKET VALUE, BY CONNECTIVITY, 2021-2027 (USD BILLION)
TABLE 10. GLOBAL SMART HOSPITAL MARKET VALUE FOR WIRED, 2021-2027 (USD BILLION)
TABLE 11. GLOBAL SMART HOSPITAL MARKET VALUE FOR WIRELESS, BY GEOGRAPHY, 2021-2027 (USD BILLION)
TABLE 12. GLOBAL SMART HOSPITAL MARKET VALUE, APPLICATION, 2021-2027 (USD BILLION)
TABLE 13. GLOBAL SMART HOSPITAL MARKET VALUE FOR REMOTE MEDICINE MANAGEMENT, BY GEOGRAPHY, 2021-2027 (USD BILLION)
TABLE 14. GLOBAL SMART HOSPITAL MARKET VALUE FOR MEDICAL ASSISTANCE, BY GEOGRAPHY, 2021-2027 (USD BILLION)
TABLE 15. GLOBAL SMART HOSPITAL MARKET VALUE FOR MEDICAL CONNECTED IMAGING, BY GEOGRAPHY, 2021-2027 (USD BILLION)
TABLE 16. GLOBAL SMART HOSPITAL MARKET VALUE FOR ELECTRONIC HEALTH RECORD & CLINICAL WORKFLOW, BY GEOGRAPHY, 2021-2027 (USD BILLION)
TABLE 17. GLOBAL SMART HOSPITAL MARKET VALUE FOR OTHERS, BY GEOGRAPHY, 2021-2027 (USD BILLION)
TABLE 18. NORTH AMERICA SMART HOSPITAL MARKET VALUE, BY COUNTRY, 2021-2027 (USD BILLION)
TABLE 19. NORTH AMERICA SMART HOSPITAL MARKET VALUE, BY COMPONENT, 2021-2027 (USD BILLION)
TABLE 20. NORTH AMERICA SMART HOSPITAL MARKET VALUE, BY SERVICE RENDERED, 2021-2027 (USD BILLION)
TABLE 21. NORTH AMERICA SMART HOSPITAL MARKET VALUE, BY CONNECTIVITY, 2021-2027 (USD BILLION)
TABLE 22. NORTH AMERICA SMART HOSPITAL MARKET VALUE, BY APPLICATION, 2021-2027 (USD BILLION)
TABLE 23. U.S SMART HOSPITAL MARKET VALUE, BY COMPONENT, 2021-2027 (USD BILLION)
TABLE 24. U.S SMART HOSPITAL MARKET VALUE, BY SERVICE RENDERED, 2021-2027 (USD BILLION)
TABLE 25. U.S SMART HOSPITAL MARKET VALUE, BY CONNECTIVITY, 2021-2027 (USD BILLION)
TABLE 26. U.S SMART HOSPITAL MARKET VALUE, BY APPLICATION, 2021-2027 (USD BILLION)
TABLE 27. CANADA SMART HOSPITAL MARKET VALUE, BY COMPONENT, 2021-2027 (USD BILLION)
TABLE 28. CANADA SMART HOSPITAL MARKET VALUE, BY SERVICE RENDERED, 2021-2027 (USD BILLION)
TABLE 29. CANADA SMART HOSPITAL MARKET VALUE, BY CONNECTIVITY, 2021-2027 (USD BILLION)
TABLE 30. CANADA SMART HOSPITAL MARKET VALUE, BY APPLICATION, 2021-2027 (USD BILLION)
TABLE 31. EUROPE SMART HOSPITAL MARKET VALUE, BY COUNTRY, 2021-2027 (USD BILLION)
TABLE 32. EUROPE SMART HOSPITAL MARKET VALUE, BY COMPONENT, 2021-2027 (USD BILLION)
TABLE 33. EUROPE SMART HOSPITAL MARKET VALUE, BY SERVICE RENDERED, 2021-2027 (USD BILLION)
TABLE 34. EUROPE SMART HOSPITAL MARKET VALUE, BY CONNECTIVITY, 2021-2027 (USD BILLION)
TABLE 35. EUROPE SMART HOSPITAL MARKET VALUE, BY APPLICATION, 2021-2027 (USD BILLION)
TABLE 36. GERMANY SMART HOSPITAL MARKET VALUE, BY COMPONENT, 2021-2027 (USD BILLION)
TABLE 37. GERMANY SMART HOSPITAL MARKET VALUE, BY SERVICE RENDERED, 2021-2027 (USD BILLION)
TABLE 38. GERMANY SMART HOSPITAL MARKET VALUE, BY CONNECTIVITY, 2021-2027 (USD BILLION)
TABLE 39. GERMANY SMART HOSPITAL MARKET VALUE, BY APPLICATION, 2021-2027 (USD BILLION)
TABLE 40. U.K SMART HOSPITAL MARKET VALUE, BY COMPONENT, 2021-2027 (USD BILLION)
TABLE 41. U.K SMART HOSPITAL MARKET VALUE, BY SERVICE RENDERED, 2021-2027 (USD BILLION)
TABLE 42. U.K SMART HOSPITAL MARKET VALUE, BY CONNECTIVITY, 2021-2027 (USD BILLION)
TABLE 43. U.K SMART HOSPITAL MARKET VALUE, BY APPLICATION, 2021-2027 (USD BILLION)
TABLE 44. FRANCE SMART HOSPITAL MARKET VALUE, BY COMPONENT, 2021-2027 (USD BILLION)
TABLE 45. FRANCE SMART HOSPITAL MARKET VALUE, BY SERVICE RENDERED, 2021-2027 (USD BILLION)
TABLE 46. FRANCE SMART HOSPITAL MARKET VALUE, BY CONNECTIVITY, 2021-2027 (USD BILLION)
TABLE 47. FRANCE SMART HOSPITAL MARKET VALUE, BY APPLICATION, 2021-2027 (USD BILLION)
TABLE 48. ITALY SMART HOSPITAL MARKET VALUE, BY COMPONENT, 2021-2027 (USD BILLION)
TABLE 49. ITALY SMART HOSPITAL MARKET VALUE, BY SERVICE RENDERED, 2021-2027 (USD BILLION)
TABLE 50. ITALY SMART HOSPITAL MARKET VALUE, BY CONNECTIVITY, 2021-2027 (USD BILLION)
TABLE 51. ITALY SMART HOSPITAL MARKET VALUE, BY APPLICATION, 2021-2027 (USD BILLION)
TABLE 52. SPAIN SMART HOSPITAL MARKET VALUE, BY COMPONENT, 2021-2027 (USD BILLION)
TABLE 53. SPAIN SMART HOSPITAL MARKET VALUE, BY SERVICE RENDERED, 2021-2027 (USD BILLION)
TABLE 54. SPAIN SMART HOSPITAL MARKET VALUE, BY CONNECTIVITY, 2021-2027 (USD BILLION)
TABLE 55. SPAIN SMART HOSPITAL MARKET VALUE, BY APPLICATION, 2021-2027 (USD BILLION)
TABLE 56. ROE SMART HOSPITAL MARKET VALUE, BY COMPONENT, 2021-2027 (USD BILLION)
TABLE 57. ROE SMART HOSPITAL MARKET VALUE, BY SERVICE RENDERED, 2021-2027 (USD BILLION)
TABLE 58. ROE SMART HOSPITAL MARKET VALUE, BY CONNECTIVITY, 2021-2027 (USD BILLION)
TABLE 59. ROE SMART HOSPITAL MARKET VALUE, BY APPLICATION, 2021-2027 (USD BILLION)
TABLE 60. ASIA PACIFIC SMART HOSPITAL MARKET VALUE, BY COUNTRY, 2021-2027 (USD BILLION)
TABLE 61. ASIA PACIFIC SMART HOSPITAL MARKET VALUE, BY COMPONENT, 2021-2027 (USD BILLION)
TABLE 62. ASIA PACIFIC SMART HOSPITAL MARKET VALUE, BY SERVICE RENDERED, 2021-2027 (USD BILLION)
TABLE 63. ASIA PACIFIC SMART HOSPITAL MARKET VALUE, BY CONNECTIVITY, 2021-2027 (USD BILLION)
TABLE 64. ASIA PACIFIC SMART HOSPITAL MARKET VALUE, BY APPLICATION, 2021-2027 (USD BILLION)
TABLE 65. CHINA SMART HOSPITAL MARKET VALUE, BY COMPONENT, 2021-2027 (USD BILLION)
TABLE 66. CHINA SMART HOSPITAL MARKET VALUE, BY SERVICE RENDERED, 2021-2027 (USD BILLION)
TABLE 67. CHINA SMART HOSPITAL MARKET VALUE, BY CONNECTIVITY, 2021-2027 (USD BILLION)
TABLE 68. CHINA SMART HOSPITAL MARKET VALUE, BY APPLICATION, 2021-2027 (USD BILLION)
TABLE 69. INDIA SMART HOSPITAL MARKET VALUE, BY COMPONENT, 2021-2027 (USD BILLION)
TABLE 70. INDIA SMART HOSPITAL MARKET VALUE, BY SERVICE RENDERED, 2021-2027 (USD BILLION)
TABLE 71. INDIA SMART HOSPITAL MARKET VALUE, BY CONNECTIVITY, 2021-2027 (USD BILLION)
TABLE 72. INDIA SMART HOSPITAL MARKET VALUE, BY APPLICATION, 2021-2027 (USD BILLION)
TABLE 73. JAPAN SMART HOSPITAL MARKET VALUE, BY COMPONENT, 2021-2027 (USD BILLION)
TABLE 74. JAPAN SMART HOSPITAL MARKET VALUE, BY SERVICE RENDERED, 2021-2027 (USD BILLION)
TABLE 75. JAPAN SMART HOSPITAL MARKET VALUE, BY CONNECTIVITY, 2021-2027 (USD BILLION)
TABLE 76. JAPAN SMART HOSPITAL MARKET VALUE, BY APPLICATION, 2021-2027 (USD BILLION)
TABLE 77. REST OF APAC SMART HOSPITAL MARKET VALUE, BY COMPONENT, 2021-2027 (USD BILLION)
TABLE 78. REST OF APAC SMART HOSPITAL MARKET VALUE, BY SERVICE RENDERED, 2021-2027 (USD BILLION)
TABLE 79. REST OF APAC SMART HOSPITAL MARKET VALUE, BY CONNECTIVITY, 2021-2027 (USD BILLION)
TABLE 80. REST OF APAC SMART HOSPITAL MARKET VALUE, BY APPLICATION, 2021-2027 (USD BILLION)
TABLE 81. REST OF WORLD SMART HOSPITAL MARKET VALUE, BY COMPONENT, 2021-2027 (USD BILLION)
TABLE 82. REST OF WORLD SMART HOSPITAL MARKET VALUE, BY SERVICE RENDERED, 2021-2027 (USD BILLION)
TABLE 83. REST OF WORLD SMART HOSPITAL MARKET VALUE, BY CONNECTIVITY, 2021-2027 (USD BILLION)
TABLE 84. REST OF WORLD SMART HOSPITAL MARKET VALUE, BY APPLICATION, 2021-2027 (USD BILLION)
TABLE 85. ALLSCRIPTS HEALTHCARE, LLC: FINANCIALS
TABLE 86. ALLSCRIPTS HEALTHCARE, LLC: PRODUCTS & SERVICES
TABLE 87. ALLSCRIPTS HEALTHCARE, LLC: RECENT DEVELOPMENTS
TABLE 88. HONEYWELL INTERNATIONAL INC: FINANCIALS
TABLE 89. HONEYWELL INTERNATIONAL INC: PRODUCTS & SERVICES
TABLE 90. HONEYWELL INTERNATIONAL INC: RECENT DEVELOPMENTS
TABLE 91. ALPHABET INC. (GOOGLE INC.): FINANCIALS
TABLE 92. ALPHABET INC. (GOOGLE INC.): PRODUCTS & SERVICES
TABLE 93. ALPHABET INC. (GOOGLE INC.): RECENT DEVELOPMENTS
TABLE 94. NEXT IT CORP: FINANCIALS
TABLE 95. NEXT IT CORP: PRODUCTS & SERVICES
TABLE 96. NEXT IT CORP: RECENT DEVELOPMENTS
TABLE 97. ENLITIC INC: FINANCIALS
TABLE 98. ENLITIC INC: PRODUCTS & SERVICES
TABLE 99. ENLITIC INC: RECENT DEVELOPMENTS
TABLE 100. GENERAL VISION: FINANCIALS
TABLE 101. GENERAL VISION: PRODUCTS & SERVICES
TABLE 102. GENERAL VISION: RECENT DEVELOPMENTS
TABLE 103. INTEL CORPORATION: FINANCIALS
TABLE 104. INTEL CORPORATION: PRODUCTS & SERVICES
TABLE 105. INTEL CORPORATION: RECENT DEVELOPMENTS
TABLE 106. IBM CORPORATION: FINANCIALS
TABLE 107. IBM CORPORATION: PRODUCTS & SERVICES
TABLE 108. IBM CORPORATION: RECENT DEVELOPMENTS
TABLE 109. MICROSOFT CORPORATION: FINANCIALS
TABLE 110. MICROSOFT CORPORATION: PRODUCTS & SERVICES
TABLE 111. MICROSOFT CORPORATION: RECENT DEVELOPMENTS
TABLE 112. NVIDIA CORPORATION: FINANCIALS
TABLE 113. NVIDIA CORPORATION: PRODUCTS & SERVICES
TABLE 114. NVIDIA CORPORATION: RECENT DEVELOPMENTS
Research Framework
Infoholic Research works on a holistic 360° approach in order to deliver high quality, validated and reliable information in our market reports. The Market estimation and forecasting involves following steps:
- Data Collation (Primary & Secondary)
- In-house Estimation (Based on proprietary data bases and Models)
- Market Triangulation
- Forecasting

Market related information is congregated from both primary and secondary sources.
Primary sources
Involved participants from all global stakeholders such as Solution providers, service providers, Industry associations, thought leaders etc. across levels such as CXOs, VPs and managers. Plus, our in-house industry experts having decades of industry experience contribute their consulting and advisory services.
Secondary sources
Include public sources such as regulatory frameworks, government IT spending, government demographic indicators, industry association statistics, and company publications along with paid sources such as Factiva, OneSource, Bloomberg among others.
![]()


