
Smart Greenhouse Market based on Type (Hydroponic and Non-Hydroponic), Component (HVAC Systems, Irrigation System, Valves & Pumps, LED Grow Lights, Sensor & Control System and Others), End-User (Commercial Growers, Research & Educational Institutes, Retail Gardens, and Others) and Geography–Global Forecast to 2026
- June, 2021
- Domain: ICT - smart technologies
- Get Free 10% Customization in this Report
A smart greenhouse is an impression of a greenhouse that cultivates crops without human intervention. Crops raise without adjustment of climate or any human interference by any means for a certain period in a smart greenhouse. The smart greenhouse uses several microprocessors and sensors to perform functions like controlling temperature and irrigation systems. The key unbiassed of the smart greenhouse is to increase the farmers' productivity and produce better farming outcomes. The rise in popularity of organic food across the world and the surge in adoption of IoT and artificial intelligence by farmers and agriculturists drive the development of the market. Also, the ease of crop monitoring and harvesting fuels market development. But high investment costs due to the deployment of expensive systems in smart greenhouses hamper the market's growth. Moreover, the increase in the adoption of vertical farming technology and the rise in public-private partnerships in the agriculture sector is anticipated to offer lucrative opportunities for market development. The Smart Greenhouse Market is expected to grow at the rate of 9.6% CAGR by 2026.
Research Methodology:
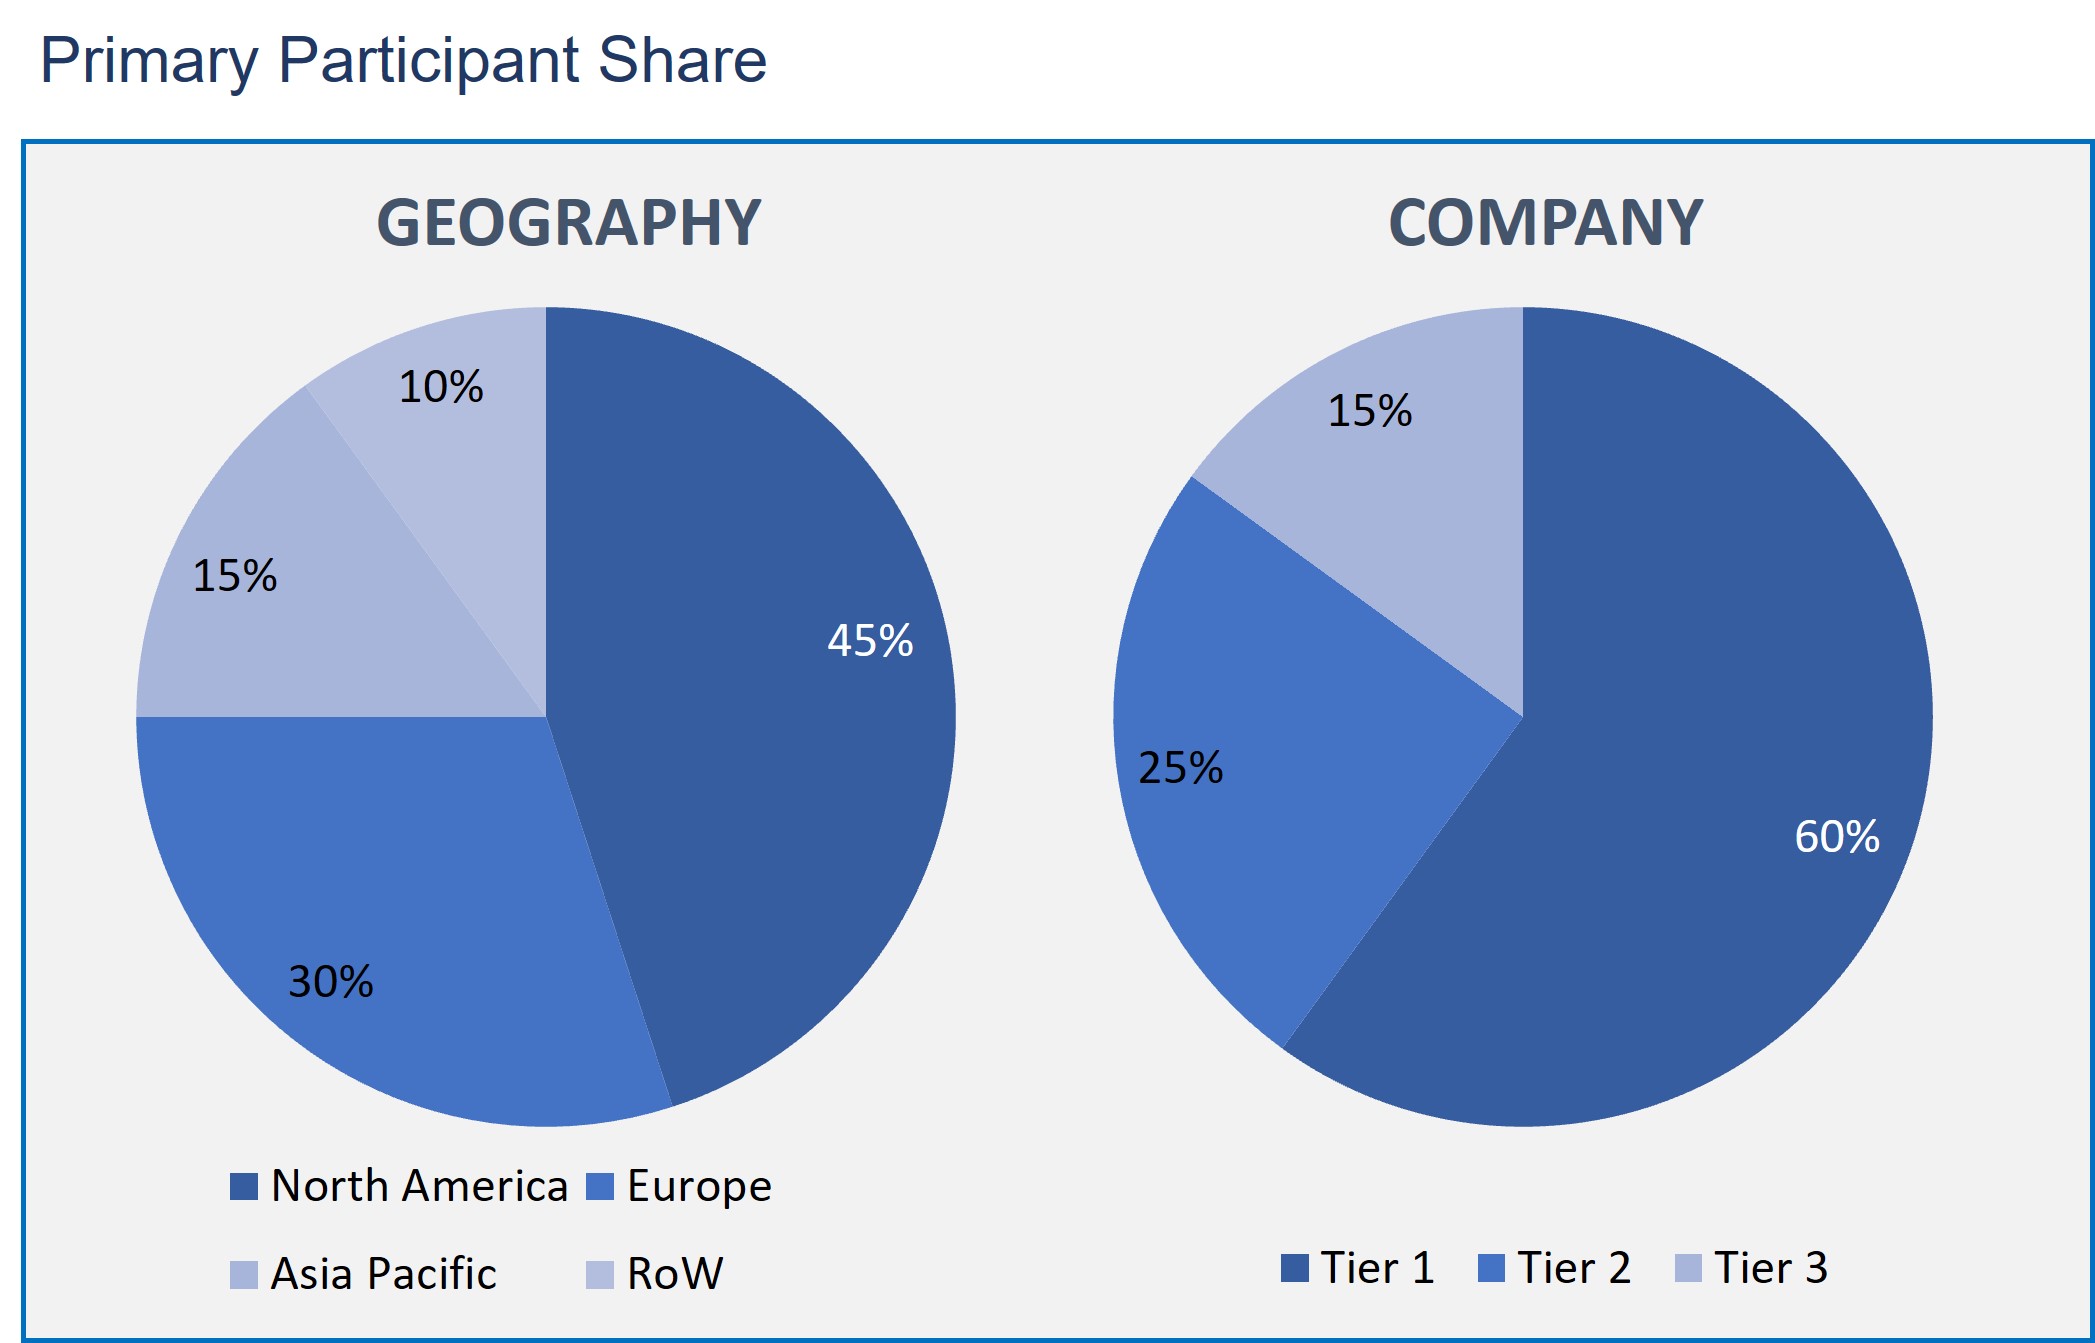
The Smart greenhouse Market has been analyzed by utilizing the optimum combination of secondary sources and in-house methodology and a unique balance of primary insights. The real-time valuation of the market is an integral part of our forecasting and market sizing methodology. Industry experts and our primary participants have helped to compile related aspects with accurate parametric estimations for a complete study. The primary participants share is given below:
Smart Greenhouse Market by Type
- Hydroponic
- Non-Hydroponic
Smart Greenhouse Market by Component
- HVAC Systems
- Irrigation System
- Valves & Pumps
- LED Grow Lights
- Sensor & Control System
- Others
Smart Greenhouse Market by End-Use
- Commercial Growers
- Research & Educational Institutes
- Retail Gardens
- Others
Smart Greenhouse Market by Geography
- North America
- Europe
- Asia Pacific
- Rest of the World
The types of smart greenhouse include hydroponic and non-hydroponic. The hydroponic segment has acquired the highest share in the smart greenhouse market. The hydroponic-based smart greenhouse is a method of production where nutrient solution is used rather than soil. This technique uses sand, pebbles, or sawdust as a substrate since; they have a high water-holding capability. This type of smart greenhouse allows soilless farming to minimize the consumption of resources, enabling many stakeholders to deploy hydroponic-based smart greenhouse agriculture.
Further, the smart greenhouse market is segmented by component; the LED grow lights segment holds a significant share in the market among other segments. This is due to the benefits provided by the LED grow lights, such as emission of cool and directional light, the adjustable light spectrum, and compact design structure. In addition to that, the LED grow lights have a long life and consume low energy.
The end-users of the smart greenhouse are commercial growers, research and educational institutes, retail gardens, and others. Among them, the research and education institutions are the major end-users in the market. This is because the research and educational institutions perform research activities on the various flowers, vegetables, and fruits that boost the growth of the smart greenhouse market in this segment.
In the geographical market of a smart greenhouse, the European region has occupied a significant share. The major share is ascribed to the rise in the population, increasing demand for imports, and increasing adoption of smart greenhouse methods to offer organic food.
The major factor driving the global smart greenhouse market growth is the increase in the population across the world. Hence, the requirement for food production has increased eventually. The burden has increased on the farmers to increase crop production by making land suitable for cultivation or deploying new emerging cultivation techniques such as smart greenhouse farming and vertical farming. Thus, the increasing population is forcing the farmers to adopt new methods of farming.
This report provides the profiles of the companies such as Rough Brothers, Inc., Argus Control Systems Limited, GreenTech Agro LLC, Nexus Corporation, Certhon, Netafim, Sensaphone, Cultivar Ltd., Heliospectra AB, and LumiGrow.
Therefore, smart greenhouse cultivation has a major role in increasing demand for improved quality and more quantity of food. Moreover, smart greenhouse agriculture is considered the most effective farming method to reduce the consumption of natural resources.
- In-sights of competitive developments include agreements, joint ventures, mergers and acquisitions, collaborations, product developments, research, and developments in the Smart Greenhouse Market.
- The report's main aim is to offer an in-depth analysis of the Smart Greenhouse Market in terms of type, component, end-user, and geography.
- A comprehensive analysis of the industry in terms of market segments, market dynamics, market share, competition, and companies has been covered in the study.
- Analysis of the Smart Greenhouse Market according to the individual growth trends, estimations, and contributions to the whole market.
- Executive Summary
- Industry Outlook
- Industry Overview
- Industry Trends
- Market Snapshot
- Market Definition
- Market Outlook
- Porter Five Forces
- Related Markets
- Market characteristics
- Market Overview
- Market Segmentation
- Market Dynamics
- Drivers
- Restraints
- Opportunities
- DRO - Impact Analysis
- Type: Market Size & Analysis
- Overview
- Hydroponic
- Non-Hydroponic
- Component: Market Size & Analysis
- Overview
- HVAC Systems
- Irrigation System
- Valves & Pumps
- LED Grow Lights
- Sensor & Control System
- Others
- End-Use: Market Size & Analysis
- Overview
- Commercial Growers
- Research & Educational Institutes
- Retail Gardens
- Others
- Geography: Market Size & Analysis
- Overview
- North America
- Europe
- Asia Pacific
- Rest of the World
- Competitive Landscape
- Competitor Comparison Analysis
- Market Developments
- Mergers and Acquisitions, Legal, Awards, Partnerships
- Product Launches and execution
- Vendor Profiles
- Rough Brothers, Inc.
- Overview
- Financial Overview
- Product Offerings
- Developments
- Business Strategy
- Argus Control Systems Limited
- Overview
- Financial Overview
- Product Offerings
- Developments
- Business Strategy
- GreenTech Agro LLC
- Overview
- Financial Overview
- Product Offerings
- Developments
- Business Strategy
- Nexus Corporation
- Overview
- Financial Overview
- Product Offerings
- Developments
- Business Strategy
- Certhon
- Overview
- Financial Overview
- Product Offerings
- Developments
- Business Strategy
- Netafim
- Overview
- Financial Overview
- Product Offerings
- Developments
- Business Strategy
- Sensaphone
- Overview
- Financial Overview
- Product Offerings
- Developments
- Business Strategy
- Cultivar Ltd.
- Overview
- Financial Overview
- Product Offerings
- Developments
- Business Strategy
- Heliospectra AB
- Overview
- Financial Overview
- Product Offerings
- Developments
- Business Strategy
- LumiGrow
- Overview
- Financial Overview
- Product Offerings
- Developments
- Business Strategy
- Rough Brothers, Inc.
- Analyst Opinion
- Annexure
- Report Scope
- Market Definitions
- Research Methodology
- Data Collation and In-house Estimation
- Market Triangulation
- Forecasting
- Report Assumptions
- Declarations
- Stakeholders
- Abbreviations
TABLE 1. GLOBAL SMART GREENHOUSE MARKET VALUE, BY TYPE, 2020-2026 (USD BILLION)
TABLE 2. GLOBAL SMART GREENHOUSE MARKET VALUE FOR HYDROPONIC, BY GEOGRAPHY, 2020-2026 (USD BILLION)
TABLE 3. GLOBAL SMART GREENHOUSE MARKET VALUE FOR NON-HYDROPONIC, BY GEOGRAPHY, 2020-2026 (USD BILLION)
TABLE 4. GLOBAL SMART GREENHOUSE MARKET VALUE, BY COMPONENT, BY GEOGRAPHY, 2020-2026 (USD BILLION)
TABLE 5. GLOBAL SMART GREENHOUSE MARKET VALUE FOR HVAC SYSTEMS, BY GEOGRAPHY, 2020-2026 (USD BILLION)
TABLE 6. GLOBAL SMART GREENHOUSE MARKET VALUE FOR LED GROW LIGHTS, BY GEOGRAPHY, 2020-2026 (USD BILLION)
TABLE 7. GLOBAL SMART GREENHOUSE MARKET VALUE FOR IRRIGATION SYSTEM, BY GEOGRAPHY, 2020-2026 (USD BILLION)
TABLE 8. GLOBAL SMART GREENHOUSE MARKET VALUE FOR VALVES & PUMPS, BY GEOGRAPHY, 2020-2026 (USD BILLION)
TABLE 9. GLOBAL SMART GREENHOUSE MARKET VALUE FOR SENSOR & CONTROL SYSTEM, BY GEOGRAPHY, 2020-2026 (USD BILLION)
TABLE 10. GLOBAL SMART GREENHOUSE MARKET VALUE FOR OTHERS, BY GEOGRAPHY, 2020-2026 (USD BILLION)
TABLE 11. GLOBAL SMART GREENHOUSE MARKET VALUE, BY END-USE, 2020-2026 (USD BILLION)
TABLE 12. GLOBAL SMART GREENHOUSE MARKET VALUE FOR COMMERCIAL GROWERS, BY GEOGRAPHY, 2020-2026 (USD BILLION)
TABLE 13. GLOBAL SMART GREENHOUSE MARKET VALUE FOR RESEARCH & EDUCATIONAL INSTITUTES, BY GEOGRAPHY, 2020-2026 (USD BILLION)
TABLE 14. GLOBAL SMART GREENHOUSE MARKET VALUE FOR RETAIL GARDENS, BY GEOGRAPHY, 2020-2026 (USD BILLION)
TABLE 15. GLOBAL SMART GREENHOUSE MARKET VALUE FOR OTHERS, BY GEOGRAPHY, 2020-2026 (USD BILLION)
TABLE 16. NORTH AMERICA SMART GREENHOUSE MARKET VALUE, BY COUNTRY, 2020-2026 (USD BILLION)
TABLE 17. NORTH AMERICA SMART GREENHOUSE MARKET VALUE, BY TYPE, 2020-2026 (USD BILLION)
TABLE 18. NORTH AMERICA SMART GREENHOUSE MARKET VALUE, BY COMPONENT, 2020-2026 (USD BILLION)
TABLE 19. NORTH AMERICA SMART GREENHOUSE MARKET VALUE, BY END-USE, 2020-2026 (USD BILLION)
TABLE 20. U.S SMART GREENHOUSE MARKET VALUE, BY TYPE, 2020-2026 (USD BILLION)
TABLE 21. U.S SMART GREENHOUSE MARKET VALUE, BY COMPONENT, 2020-2026 (USD BILLION)
TABLE 22. U.S SMART GREENHOUSE MARKET VALUE, BY END-USE, 2020-2026 (USD BILLION)
TABLE 23. CANADA SMART GREENHOUSE MARKET VALUE, BY TYPE, 2020-2026 (USD BILLION)
TABLE 24. CANADA SMART GREENHOUSE MARKET VALUE, BY COMPONENT, 2020-2026 (USD BILLION)
TABLE 25. CANADA SMART GREENHOUSE MARKET VALUE, BY END-USE, 2020-2026 (USD BILLION)
TABLE 26. EUROPE SMART GREENHOUSE MARKET VALUE, BY COUNTRY, 2020-2026 (USD BILLION)
TABLE 27. EUROPE SMART GREENHOUSE MARKET VALUE, BY TYPE, 2020-2026 (USD BILLION)
TABLE 28. EUROPE SMART GREENHOUSE MARKET VALUE, BY COMPONENT, 2020-2026 (USD BILLION)
TABLE 29. EUROPE SMART GREENHOUSE MARKET VALUE, END-USE, 2020-2026 (USD BILLION)
TABLE 30. GERMANY SMART GREENHOUSE MARKET VALUE, BY TYPE, 2020-2026 (USD BILLION)
TABLE 31. GERMANY SMART GREENHOUSE MARKET VALUE, BY COMPONENT, 2020-2026 (USD BILLION)
TABLE 32. GERMANY SMART GREENHOUSE MARKET VALUE, BY END-USE, 2020-2026 (USD BILLION)
TABLE 33. U.K SMART GREENHOUSE MARKET VALUE, BY TYPE, 2020-2026 (USD BILLION)
TABLE 34. U.K SMART GREENHOUSE MARKET VALUE, BY COMPONENT, 2020-2026 (USD BILLION)
TABLE 35. U.K SMART GREENHOUSE MARKET VALUE, BY END-USE, 2020-2026 (USD BILLION)
TABLE 36. FRANCE SMART GREENHOUSE MARKET VALUE, BY TYPE, 2020-2026 (USD BILLION)
TABLE 37. FRANCE SMART GREENHOUSE MARKET VALUE, BY COMPONENT, 2020-2026 (USD BILLION)
TABLE 38. FRANCE SMART GREENHOUSE MARKET VALUE, BY END-USE, 2020-2026 (USD BILLION)
TABLE 39. ITALY SMART GREENHOUSE MARKET VALUE, BY TYPE, 2020-2026 (USD BILLION)
TABLE 40. ITALY SMART GREENHOUSE MARKET VALUE, BY COMPONENT, 2020-2026 (USD BILLION)
TABLE 41. ITALY SMART GREENHOUSE MARKET VALUE, BY END-USE, 2020-2026 (USD BILLION)
TABLE 42. SPAIN SMART GREENHOUSE MARKET VALUE, BY TYPE, 2020-2026 (USD BILLION)
TABLE 43. SPAIN SMART GREENHOUSE MARKET VALUE, BY COMPONENT, 2020-2026 (USD BILLION)
TABLE 44. SPAIN SMART GREENHOUSE MARKET VALUE, BY END-USE, 2020-2026 (USD BILLION)
TABLE 45. ROE SMART GREENHOUSE MARKET VALUE, BY TYPE, 2020-2026 (USD BILLION)
TABLE 46. ROE SMART GREENHOUSE MARKET VALUE, BY COMPONENT, 2020-2026 (USD BILLION)
TABLE 47. ROE SMART GREENHOUSE MARKET VALUE, BY END-USE, 2020-2026 (USD BILLION)
TABLE 48. ASIA PACIFIC SMART GREENHOUSE MARKET VALUE, BY COUNTRY, 2020-2026 (USD BILLION)
TABLE 49. ASIA PACIFIC SMART GREENHOUSE MARKET VALUE, BY TYPE, 2020-2026 (USD BILLION)
TABLE 50. ASIA PACIFIC SMART GREENHOUSE MARKET VALUE, BY COMPONENT, 2020-2026 (USD BILLION)
TABLE 51. ASIA PACIFIC SMART GREENHOUSE MARKET VALUE, BY END-USE, 2020-2026 (USD BILLION)
TABLE 52. CHINA SMART GREENHOUSE MARKET VALUE, BY TYPE, 2020-2026 (USD BILLION)
TABLE 53. CHINA SMART GREENHOUSE MARKET VALUE, BY COMPONENT, 2020-2026 (USD BILLION)
TABLE 54. CHINA SMART GREENHOUSE MARKET VALUE, BY END-USE, 2020-2026 (USD BILLION)
TABLE 55. INDIA SMART GREENHOUSE MARKET VALUE, BY TYPE, 2020-2026 (USD BILLION)
TABLE 56. INDIA SMART GREENHOUSE MARKET VALUE, BY COMPONENT, 2020-2026 (USD BILLION)
TABLE 57. INDIA SMART GREENHOUSE MARKET VALUE, BY END-USE, 2020-2026 (USD BILLION)
TABLE 58. JAPAN SMART GREENHOUSE MARKET VALUE, BY TYPE, 2020-2026 (USD BILLION)
TABLE 59. JAPAN SMART GREENHOUSE MARKET VALUE, BY COMPONENT, 2020-2026 (USD BILLION)
TABLE 60. JAPAN SMART GREENHOUSE MARKET VALUE, BY END-USE, 2020-2026 (USD BILLION)
TABLE 61. REST OF APAC SMART GREENHOUSE MARKET VALUE, BY TYPE, 2020-2026 (USD BILLION)
TABLE 62. REST OF APAC SMART GREENHOUSE MARKET VALUE, BY COMPONENT, 2020-2026 (USD BILLION)
TABLE 63. REST OF APAC SMART GREENHOUSE MARKET VALUE, BY END-USE, 2020-2026 (USD BILLION)
TABLE 64. REST OF WORLD SMART GREENHOUSE MARKET VALUE, BY TYPE, 2020-2026 (USD BILLION)
TABLE 65. REST OF WORLD SMART GREENHOUSE MARKET VALUE, BY COMPONENT, 2020-2026 (USD BILLION)
TABLE 66. REST OF WORLD SMART GREENHOUSE MARKET VALUE, BY END-USE, 2020-2026 (USD BILLION)
TABLE 67. ROUGH BROTHERS, INC: FINANCIALS
TABLE 68. ROUGH BROTHERS, INC: PRODUCTS & SERVICES
TABLE 69. ROUGH BROTHERS, INC: RECENT DEVELOPMENTS
TABLE 70. ARGUS CONTROL SYSTEMS LIMITED: FINANCIALS
TABLE 71. ARGUS CONTROL SYSTEMS LIMITED: PRODUCTS & SERVICES
TABLE 72. ARGUS CONTROL SYSTEMS LIMITED: RECENT DEVELOPMENTS
TABLE 73. GREENTECH AGRO LLC: FINANCIALS
TABLE 74. GREENTECH AGRO LLC: PRODUCTS & SERVICES
TABLE 75. GREENTECH AGRO LLC: RECENT DEVELOPMENTS
TABLE 76. NEXUS CORPORATION: FINANCIALS
TABLE 77. NEXUS CORPORATION: PRODUCTS & SERVICES
TABLE 78. NEXUS CORPORATION: RECENT DEVELOPMENTS
TABLE 79. CERTHON: FINANCIALS
TABLE 80. CERTHON: PRODUCTS & SERVICES
TABLE 81. CERTHON: RECENT DEVELOPMENTS
TABLE 82. NETAFIM: FINANCIALS
TABLE 83. NETAFIM: PRODUCTS & SERVICES
TABLE 84. NETAFIM: RECENT DEVELOPMENTS
TABLE 85. SENSAPHONE: FINANCIALS
TABLE 86. SENSAPHONE: PRODUCTS & SERVICES
TABLE 87. SENSAPHONE: RECENT DEVELOPMENTS
TABLE 88. CULTIVAR LTD: FINANCIALS
TABLE 89. CULTIVAR LTD: PRODUCTS & SERVICES
TABLE 90. CULTIVAR LTD: RECENT DEVELOPMENTS
TABLE 91. HELIOSPECTRA AB: FINANCIALS
TABLE 92. HELIOSPECTRA AB: PRODUCTS & SERVICES
TABLE 93. HELIOSPECTRA AB: RECENT DEVELOPMENTS
TABLE 94. LUMIGROW: FINANCIALS
TABLE 95. LUMIGROW: PRODUCTS & SERVICES
TABLE 96. LUMIGROW: RECENT DEVELOPMENTS
Research Framework
Infoholic Research works on a holistic 360° approach in order to deliver high quality, validated and reliable information in our market reports. The Market estimation and forecasting involves following steps:
- Data Collation (Primary & Secondary)
- In-house Estimation (Based on proprietary data bases and Models)
- Market Triangulation
- Forecasting

Market related information is congregated from both primary and secondary sources.
Primary sources
Involved participants from all global stakeholders such as Solution providers, service providers, Industry associations, thought leaders etc. across levels such as CXOs, VPs and managers. Plus, our in-house industry experts having decades of industry experience contribute their consulting and advisory services.
Secondary sources
Include public sources such as regulatory frameworks, government IT spending, government demographic indicators, industry association statistics, and company publications along with paid sources such as Factiva, OneSource, Bloomberg among others.
![]()


