
Smart Bed Market by Product (Manual, Semi-automatic and Fully-automatic), End-user (Residential, Hospital, and Other End Users), Distribution Channel (Supermarkets, Specialty Stores, Online and Other Distribution Channels), Geography (North America, Europe, APAC, and RoW) - Forecast to 2026
- August, 2020
- Domain: ICT - smart technologies
- Get Free 10% Customization in this Report
A smart bed is a bed installed with sensors and technologies, which gives information about how well an individual is sleeping, and the smart technology in the bed helps a person to improve the sleep. Some smart beds are also available with in-built installed features such as TV and alarm. There are smart bed sheets available that adjust according to the weather changes in the night. The smart bed market is an emerging market with multiple factors propelling the market growth including the increasing preference for smart beds for the athletes, rising elderly population, increasing incidence of diseases, and the consolidation of internet of things (IoT) in this technology. Although, the high costs incurred in purchases and maintenance can be considered as the constraint to the market growth. Smart Bed Market is predicted to grow at a CAGR of 11.6% in the forecasting period. The market is predicted to reach $7,735 million in 2026 from $4,003 million in 2020.
The scope of the smart bed market report includes:
Based on the Product:
- Manual
- Semi-automatic
- Fully -automatic
Based on the End User:
- Residential
- Hospital
- Other End Users
Based on the Geography:
- North America
- Europe
- Asia Pacific
- Rest of the World
Smart bed market segmented based on the product – The semi-automatic smart bed segment is estimated to have the largest demand share in the market as these semi-automatic beds are commonly used in the hospitals and for the homecare settings for the patients. These beds can be enabled to adjust to eating food as well as for sleeping also.
As per the end-users market segmentation, the hospitals have a major role in the market growth as the smart beds are mostly used in hospitals for effective patient monitoring and easy management of the patient's health condition and for the better improvement of the patient. The advancements in smart bed technology are enhancing the market in the end-user segment.
The distribution channel market segment in the smart bed market is divided into supermarkets, specialty stores, online, and other distribution channels. The online distribution channel is accounted to have the largest share due to the increasing e-commerce adoption, and the favorable discounts in the online purchases.
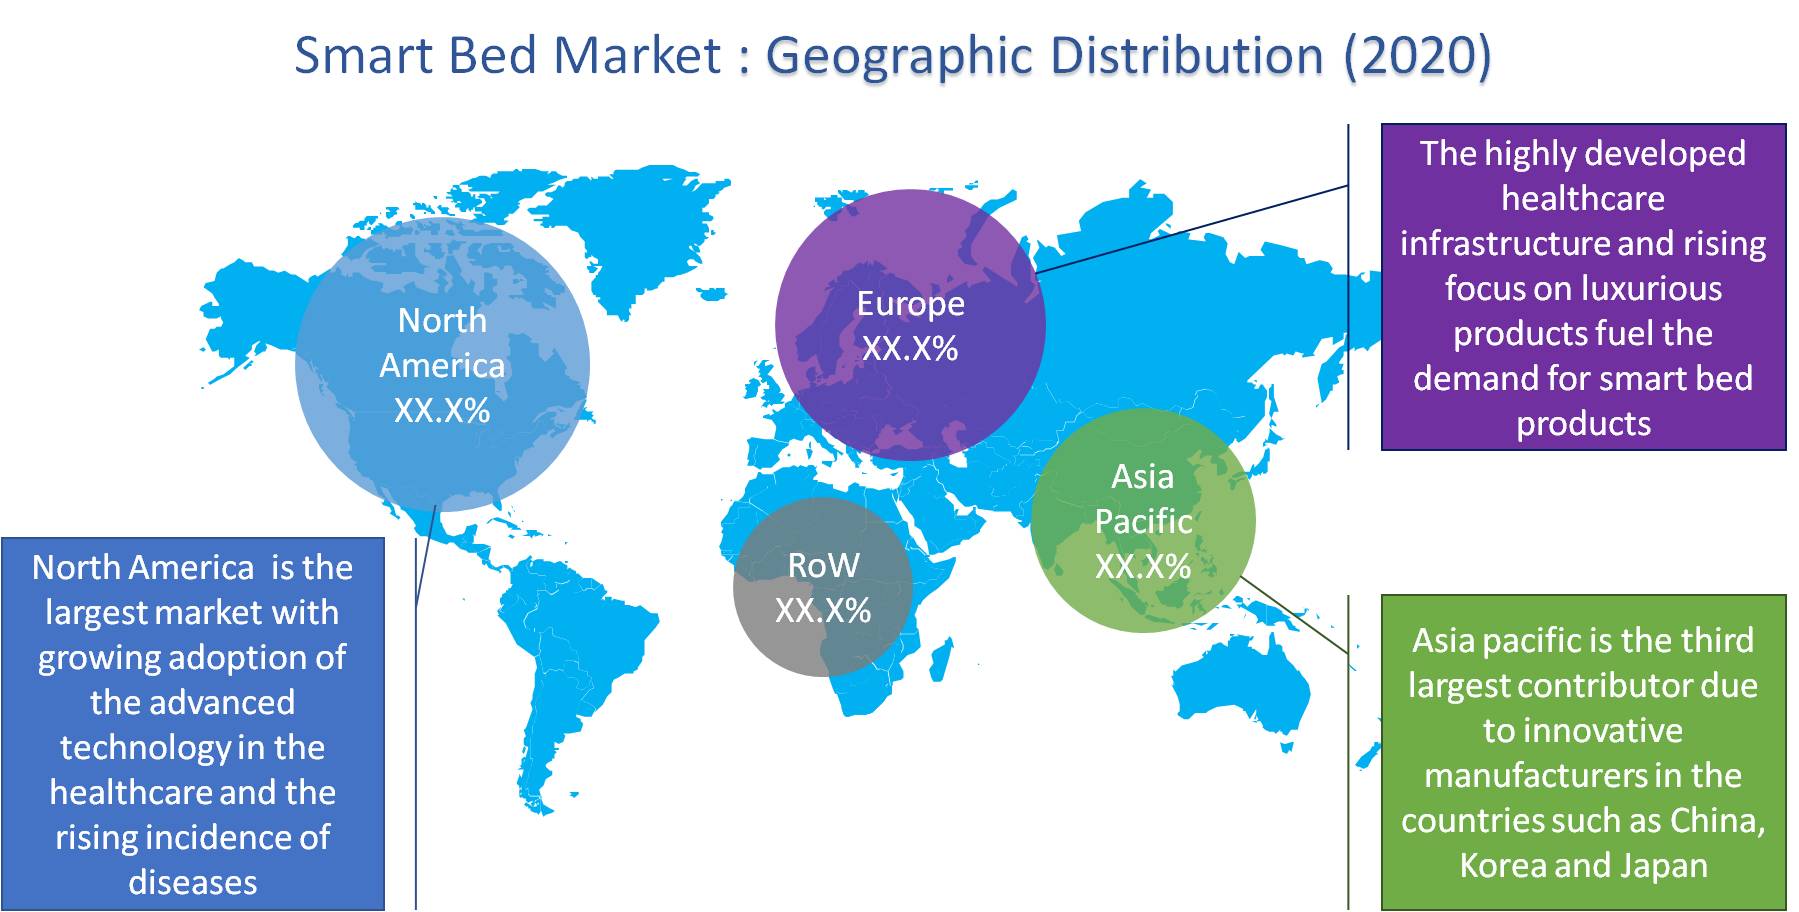
As per the geographical analysis, North America is said to acquire a major part of the market share as it is observed the growing adoption of advanced technology in the healthcare and the rising incidence of diseases and the increasing elderly population. On the other hand, the Asia Pacific is also expected to be a lucrative market due to the innovative manufacturers in countries such as China, Korea, and Japan.
Globally, smart beds are majorly used in the medical sector for the easy and effective monitoring of the patients. The major aspects impelling the smart bed market growth include the increasing rate of diseases results in the growing number of patients; increasing investments in the healthcare facilities in the healthcare sector, and the increasing preference of the smart bed for the athletes to self monitor their sleep. The dearth of the skilled manufacturer in some countries in this field is a constraint in the market growth.
The smart bed market also provides the analysis of major players of the market include Stryker Corporation, Responsive Surface Technology, Paramount Bed Co, BodiTrak, ArjoHuntleigh AB, Sleepnumber, Invacare Corporation, Hi-Interiors SRL, BAM Labs and Balluga Limited, and Hill Rom Holdings Inc
However, the scope of the smart bed market is increasing globally as the preference is given for the comfortable and for health in the emerging regions. The increasing technological improvements in the smart bed manufacture are solidifying market growth. This report gives the smart bed market analysis based on the qualitative and quantitative for the better experience of the user.
- This report provides an in-depth analysis of the smart bed industry and the market trends, opportunities.
- This report also gives the analysis of the product innovation in the smart bed market and the investments of the leading players in the research and development.
- This report helps the research and development industry of the smart bed market for the innovative development in the product.
- This research also provides the analysis of market spread all over the world.
1. Executive Summary
2. Industry Outlook
2.1. Industry Overview
2.2. Industry Trends
3. Market Snapshot
3.1. Total Addressable Market
3.2. Segment Addressable Market
3.2.1. PEST Analysis
3.2.2. Porter Five Forces
3.3. Related Markets
3.4. Ecosystem
4. Market Outlook
4.1. Overview
4.1.1. Market Evolution
4.2. Market Trends and Impact
4.3. Pricing Analysis
4.4. Market Segmentation
4.5. Market Dynamics
4.5.1. Drivers
4.5.2. Restraints
4.5.3. Opportunities
4.6. DRO - Impact Analysis
5. Product: Market Size & Analysis
5.1. Manual
5.2. Semi-automatic
5.3. Fully -automatic
6. End-user: Market Size & Analysis
6.1. Residential
6.2. Healthcare
6.3. Other End Users
7. Geography: Market Size & Analysis
7.1. North America
7.2. Europe
7.3. Asia Pacific
7.4. Rest of the World
8. Competitive Landscape
8.1. Competitor Comparison Analysis
8.2. Market Developments
8.3. Mergers and Acquisitions, Legal, Awards, Partnerships
8.4. Product Launches and execution
9. Vendor Profiles
9.1. Paramount Bed Co
9.1.1. Overview
9.1.2. Business Units
9.1.3. Geographic Revenue
9.1.4. Product Offerings
9.1.5. Developments
9.1.6. Business Strategy
9.2. Stryker Corporation
9.2.1. Overview
9.2.2. Business Units
9.2.3. Geographic Revenue
9.2.4. Product Offerings
9.2.5. Developments
9.2.6. Business Strategy
9.3. BodiTrak
9.3.1. Overview
9.3.2. Business Units
9.3.3. Geographic Revenue
9.3.4. Product Offerings
9.3.5. Developments
9.3.6. Business Strategy
9.4. ArjoHuntleigh AB
9.4.1. Overview
9.4.2. Business Units
9.4.3. Geographic Revenue
9.4.4. Product Offerings
9.4.5. Developments
9.4.6. Business Strategy
9.5. Hill Rom Holdings Inc
9.5.1. Overview
9.5.2. Business Units
9.5.3. Geographic Revenue
9.5.4. Product Offerings
9.5.5. Developments
9.5.6. Business Strategy
9.6. Sleepnumber
9.6.1. Overview
9.6.2. Business Units
9.6.3. Geographic Revenue
9.6.4. Product Offerings
9.6.5. Developments
9.6.6. Business Strategy
9.7. Invacare Corporation
9.7.1. Overview
9.7.2. Business Units
9.7.3. Geographic Revenue
9.7.4. Product Offerings
9.7.5. Developments
9.7.6. Business Strategy
9.8. Responsive Surface Technology
9.8.1. Overview
9.8.2. Business Units
9.8.3. Geographic Revenue
9.8.4. Product Offerings
9.8.5. Developments
9.8.6. Business Strategy
9.9. Hi-Interiors SRL.
9.9.1. Overview
9.9.2. Business Units
9.9.3. Geographic Revenue
9.9.4. Product Offerings
9.9.5. Developments
9.9.6. Business Strategy
9.10. BAM Labs
9.10.1. Overview
9.10.2. Business Units
9.10.3. Geographic Revenue
9.10.4. Product Offerings
9.10.5. Developments
9.10.6. Business Strategy
10. Analyst Opinion
11. Annexure
11.1. Report Scope
11.2. Market Definitions
11.3. Research Methodology
11.3.1. Data Collation and In-house Estimation
11.3.2. Market Triangulation
11.3.3. Forecasting
11.4. Report Assumptions
11.5. Declarations
11.6. Stakeholders
11.7. Abbreviation
TABLE 1. GLOBAL SMART BED MARKET VALUE, BY PRODUCT, 2020-2026 (USD MILLION)
TABLE 2. GLOBAL SMART BED MARKET VALUE FOR MANUAL, BY GEOGRAPHY, 2020-2026 (USD MILLION)
TABLE 3. GLOBAL SMART BED MARKET VALUE FOR SEMI-AUTOMATIC, BY GEOGRAPHY, 2020-2026 (USD MILLION)
TABLE 4. GLOBAL SMART BED MARKET VALUE FOR FULLY -AUTOMATIC, BY GEOGRAPHY, 2020-2026 (USD MILLION)
TABLE 5. GLOBAL SMART BED MARKET VALUE, BY END USER, 2020-2026 (USD MILLION)
TABLE 6. GLOBAL SMART BED MARKET VALUE FOR RESIDENTIAL, BY GEOGRAPHY, 2020-2026 (USD MILLION)
TABLE 7. GLOBAL SMART BED MARKET VALUE FOR HOSPITAL, BY GEOGRAPHY, 2020-2026 (USD MILLION)
TABLE 8. GLOBAL SMART BED MARKET VALUE FOR OTHER END USERS, BY GEOGRAPHY, 2020-2026 (USD MILLION)
TABLE 9. NORTH AMERICA SMART BED MARKET VALUE, BY COUNTRY, 2020-2026 (USD MILLION)
TABLE 10. NORTH AMERICA SMART BED MARKET VALUE, BY PRODUCT, 2020-2026 (USD MILLION)
TABLE 11. NORTH AMERICA SMART BED MARKET VALUE, BY END USER, 2020-2026 (USD MILLION)
TABLE 12. U.S SMART BED MARKET VALUE, BY COUNTRY, 2020-2026 (USD MILLION)
TABLE 13. U.S SMART BED MARKET VALUE, BY PRODUCT, 2020-2026 (USD MILLION)
TABLE 14. U.S SMART BED MARKET VALUE, BY END USER, 2020-2026 (USD MILLION)
TABLE 15. CANADA SMART BED MARKET VALUE, BY COUNTRY, 2020-2026 (USD MILLION)
TABLE 16. CANADA SMART BED MARKET VALUE, BY PRODUCT, 2020-2026 (USD MILLION)
TABLE 17. CANADA SMART BED MARKET VALUE, BY END USER, 2020-2026 (USD MILLION)
TABLE 18. EUROPE SMART BED MARKET VALUE, BY COUNTRY, 2020-2026 (USD MILLION)
TABLE 19. EUROPE SMART BED MARKET VALUE, BY PRODUCT, 2020-2026 (USD MILLION)
TABLE 20. EUROPE SMART BED MARKET VALUE, BY END USER, 2020-2026 (USD MILLION)
TABLE 21. GERMANY SMART BED MARKET VALUE, BY COUNTRY, 2020-2026 (USD MILLION)
TABLE 22. GERMANY SMART BED MARKET VALUE, BY PRODUCT, 2020-2026 (USD MILLION)
TABLE 23. GERMANY SMART BED MARKET VALUE, BY END USER, 2020-2026 (USD MILLION)
TABLE 24. U.K SMART BED MARKET VALUE, BY COUNTRY, 2020-2026 (USD MILLION)
TABLE 25. U.K SMART BED MARKET VALUE, BY PRODUCT, 2020-2026 (USD MILLION)
TABLE 26. U.K SMART BED MARKET VALUE, BY END USER, 2020-2026 (USD MILLION)
TABLE 27. FRANCE SMART BED MARKET VALUE, BY COUNTRY, 2020-2026 (USD MILLION)
TABLE 28. FRANCE SMART BED MARKET VALUE, BY PRODUCT, 2020-2026 (USD MILLION)
TABLE 29. FRANCE SMART BED MARKET VALUE, BY END USER, 2020-2026 (USD MILLION)
TABLE 30. ITALY SMART BED MARKET VALUE, BY COUNTRY, 2020-2026 (USD MILLION)
TABLE 31. ITALY SMART BED MARKET VALUE, BY PRODUCT, 2020-2026 (USD MILLION)
TABLE 32. ITALY SMART BED MARKET VALUE, BY END USER, 2020-2026 (USD MILLION)
TABLE 33. SPAIN SMART BED MARKET VALUE, BY COUNTRY, 2020-2026 (USD MILLION)
TABLE 34. SPAIN SMART BED MARKET VALUE, BY PRODUCT, 2020-2026 (USD MILLION)
TABLE 35. SPAIN SMART BED MARKET VALUE, BY END USER, 2020-2026 (USD MILLION)
TABLE 36. ROE SMART BED MARKET VALUE, BY COUNTRY, 2020-2026 (USD MILLION)
TABLE 37. ROE SMART BED MARKET VALUE, BY PRODUCT, 2020-2026 (USD MILLION)
TABLE 38. ROE SMART BED MARKET VALUE, BY END USER, 2020-2026 (USD MILLION)
TABLE 39. ASIA PACIFIC SMART BED MARKET VALUE, BY COUNTRY, 2020-2026 (USD MILLION)
TABLE 40. ASIA PACIFIC SMART BED MARKET VALUE, BY PRODUCT, 2020-2026 (USD MILLION)
TABLE 41. ASIA PACIFIC SMART BED MARKET VALUE, BY END USER, 2020-2026 (USD MILLION)
TABLE 42. CHINA SMART BED MARKET VALUE, BY COUNTRY, 2020-2026 (USD MILLION)
TABLE 43. CHINA SMART BED MARKET VALUE, BY PRODUCT, 2020-2026 (USD MILLION)
TABLE 44. CHINA SMART BED MARKET VALUE, BY END USER, 2020-2026 (USD MILLION)
TABLE 45. INDIA SMART BED MARKET VALUE, BY COUNTRY, 2020-2026 (USD MILLION)
TABLE 46. INDIA SMART BED MARKET VALUE, BY PRODUCT, 2020-2026 (USD MILLION)
TABLE 47. INDIA SMART BED MARKET VALUE, BY END USER, 2020-2026 (USD MILLION)
TABLE 48. JAPAN SMART BED MARKET VALUE, BY COUNTRY, 2020-2026 (USD MILLION)
TABLE 49. JAPAN SMART BED MARKET VALUE, BY PRODUCT, 2020-2026 (USD MILLION)
TABLE 50. JAPAN SMART BED MARKET VALUE, BY END USER, 2020-2026 (USD MILLION)
TABLE 51. REST OF APACP SMART BED MARKET VALUE, BY COUNTRY, 2020-2026 (USD MILLION)
TABLE 52. REST OF APACP SMART BED MARKET VALUE, BY PRODUCT, 2020-2026 (USD MILLION)
TABLE 53. REST OF APACP SMART BED MARKET VALUE, BY END USER, 2020-2026 (USD MILLION)
TABLE 54. REST OF WORLD SMART BED MARKET VALUE, BY COUNTRY, 2020-2026 (USD MILLION)
TABLE 55. REST OF WORLD SMART BED MARKET VALUE, BY PRODUCT, 2020-2026 (USD MILLION)
TABLE 56. REST OF WORLD SMART BED MARKET VALUE, BY END USER, 2020-2026 (USD MILLION)
TABLE 57. PARAMOUNT BED CO.: OVERVIEW
TABLE 58. PARAMOUNT BED CO.: STRATEGIC SNAPSHOT
TABLE 59. PARAMOUNT BED CO.: BUSINESS OPPORTUNITIES AND OUTLOOK
TABLE 60. PARAMOUNT BED CO.: PRODUCT/SERVICE PORTFOLIO
TABLE 61. STRYKER CORPORATION: OVERVIEW
TABLE 62. STRYKER CORPORATION: STRATEGIC SNAPSHOT
TABLE 63. STRYKER CORPORATION: BUSINESS OPPORTUNITIES AND OUTLOOK
TABLE 64. STRYKER CORPORATION: PRODUCT/SERVICE PORTFOLIO
TABLE 65. BODITRAK: OVERVIEW
TABLE 66. BODITRAK: STRATEGIC SNAPSHOT
TABLE 67. BODITRAK: BUSINESS OPPORTUNITIES AND OUTLOOK
TABLE 68. BODITRAK: PRODUCT/SERVICE PORTFOLIO
TABLE 69. ARJOHUNTLEIGH AB.: OVERVIEW
TABLE 70. ARJOHUNTLEIGH AB.: STRATEGIC SNAPSHOT
TABLE 71. ARJOHUNTLEIGH AB.: BUSINESS OPPORTUNITIES AND OUTLOOK
TABLE 72. ARJOHUNTLEIGH AB.: PRODUCT/SERVICE PORTFOLIO
TABLE 73. HILL ROM HOLDINGS INC: OVERVIEW
TABLE 74. HILL ROM HOLDINGS INC: STRATEGIC SNAPSHOT
TABLE 75. HILL ROM HOLDINGS INC: BUSINESS OPPORTUNITIES AND OUTLOOK
TABLE 76. HILL ROM HOLDINGS INC: PRODUCT/SERVICE PORTFOLIO
TABLE 77. SLEEPNUMBER.: OVERVIEW
TABLE 78. SLEEPNUMBER.: STRATEGIC SNAPSHOT
TABLE 79. SLEEPNUMBER.: BUSINESS OPPORTUNITIES AND OUTLOOK
TABLE 80. SLEEPNUMBER.: PRODUCT/SERVICE PORTFOLIO
TABLE 81. INVACARE CORPORATION: OVERVIEW
TABLE 82. INVACARE CORPORATION: STRATEGIC SNAPSHOT
TABLE 83. INVACARE CORPORATION: BUSINESS OPPORTUNITIES AND OUTLOOK
TABLE 84. INVACARE CORPORATION: PRODUCT/SERVICE PORTFOLIO
TABLE 85. RESPONSIVE SURFACE TECHNOLOGY.: OVERVIEW
TABLE 86. RESPONSIVE SURFACE TECHNOLOGY.: STRATEGIC SNAPSHOT
TABLE 87. RESPONSIVE SURFACE TECHNOLOGY.: BUSINESS OPPORTUNITIES AND OUTLOOK
TABLE 88. RESPONSIVE SURFACE TECHNOLOGY.: PRODUCT/SERVICE PORTFOLIO
TABLE 89. HI-INTERIORS SRL.: OVERVIEW
TABLE 90. HI-INTERIORS SRL.: STRATEGIC SNAPSHOT
TABLE 91. HI-INTERIORS SRL.: BUSINESS OPPORTUNITIES AND OUTLOOK
TABLE 92. HI-INTERIORS SRL.: PRODUCT/SERVICE PORTFOLIO
TABLE 93. BAM LABS.: OVERVIEW
TABLE 94. BAM LABS.: STRATEGIC SNAPSHOT
TABLE 95. BAM LABS.: BUSINESS OPPORTUNITIES AND OUTLO
TABLE 96. BAM LABS.: PRODUCT/SERVICE PORTFOLIO
Research Framework
Infoholic Research works on a holistic 360° approach in order to deliver high quality, validated and reliable information in our market reports. The Market estimation and forecasting involves following steps:
- Data Collation (Primary & Secondary)
- In-house Estimation (Based on proprietary data bases and Models)
- Market Triangulation
- Forecasting

Market related information is congregated from both primary and secondary sources.
Primary sources
Involved participants from all global stakeholders such as Solution providers, service providers, Industry associations, thought leaders etc. across levels such as CXOs, VPs and managers. Plus, our in-house industry experts having decades of industry experience contribute their consulting and advisory services.
Secondary sources
Include public sources such as regulatory frameworks, government IT spending, government demographic indicators, industry association statistics, and company publications along with paid sources such as Factiva, OneSource, Bloomberg among others.
![]()


