
Shale Gas Market on the basis of Technology (Exploration & Drilling and Fracturing Fluid), Application (Power Generation, Industrial, Residential, Commercial, and Transportation), and Geography – Global Forecast up to 2027
- July, 2021
- Domain: Chemicals, Materials & Food - Specialty Chemicals
- Get Free 10% Customization in this Report
Shale gas is a type of natural gas which is found below the shale rock. Shale is a compressed fine-grained sedimentary rock created from mud silt, clay, and organic matter. Shale gas is confined within tiny pore spaces in sediment formations. It majorly consists of methane with other hydrocarbons such as propane, ethane, butane, carbon dioxide, nitrogen, and hydrogen sulphide. The advantages associated with shale gas, including lesser natural gas prices, a cleaner environmental footprint than some other fossil fuels, which include coal, fuel oil or natural gas, intensified energy security & the availability of energy fuels, and local economic development are significant factors which are primarily driving the growth of the global shale gas market. The rising awareness about the environment elevates the utilization of clean fuels, including natural gas, which is surging demand for shale gas. On the other hand, shale gas production can be economically not feasible at times and negatively impact the environment, which are the key factors restricting the shale gas market growth. The Shale Gas Market is anticipated to grow at the rate of 8.5% CAGR by 2027.
Research Methodology:
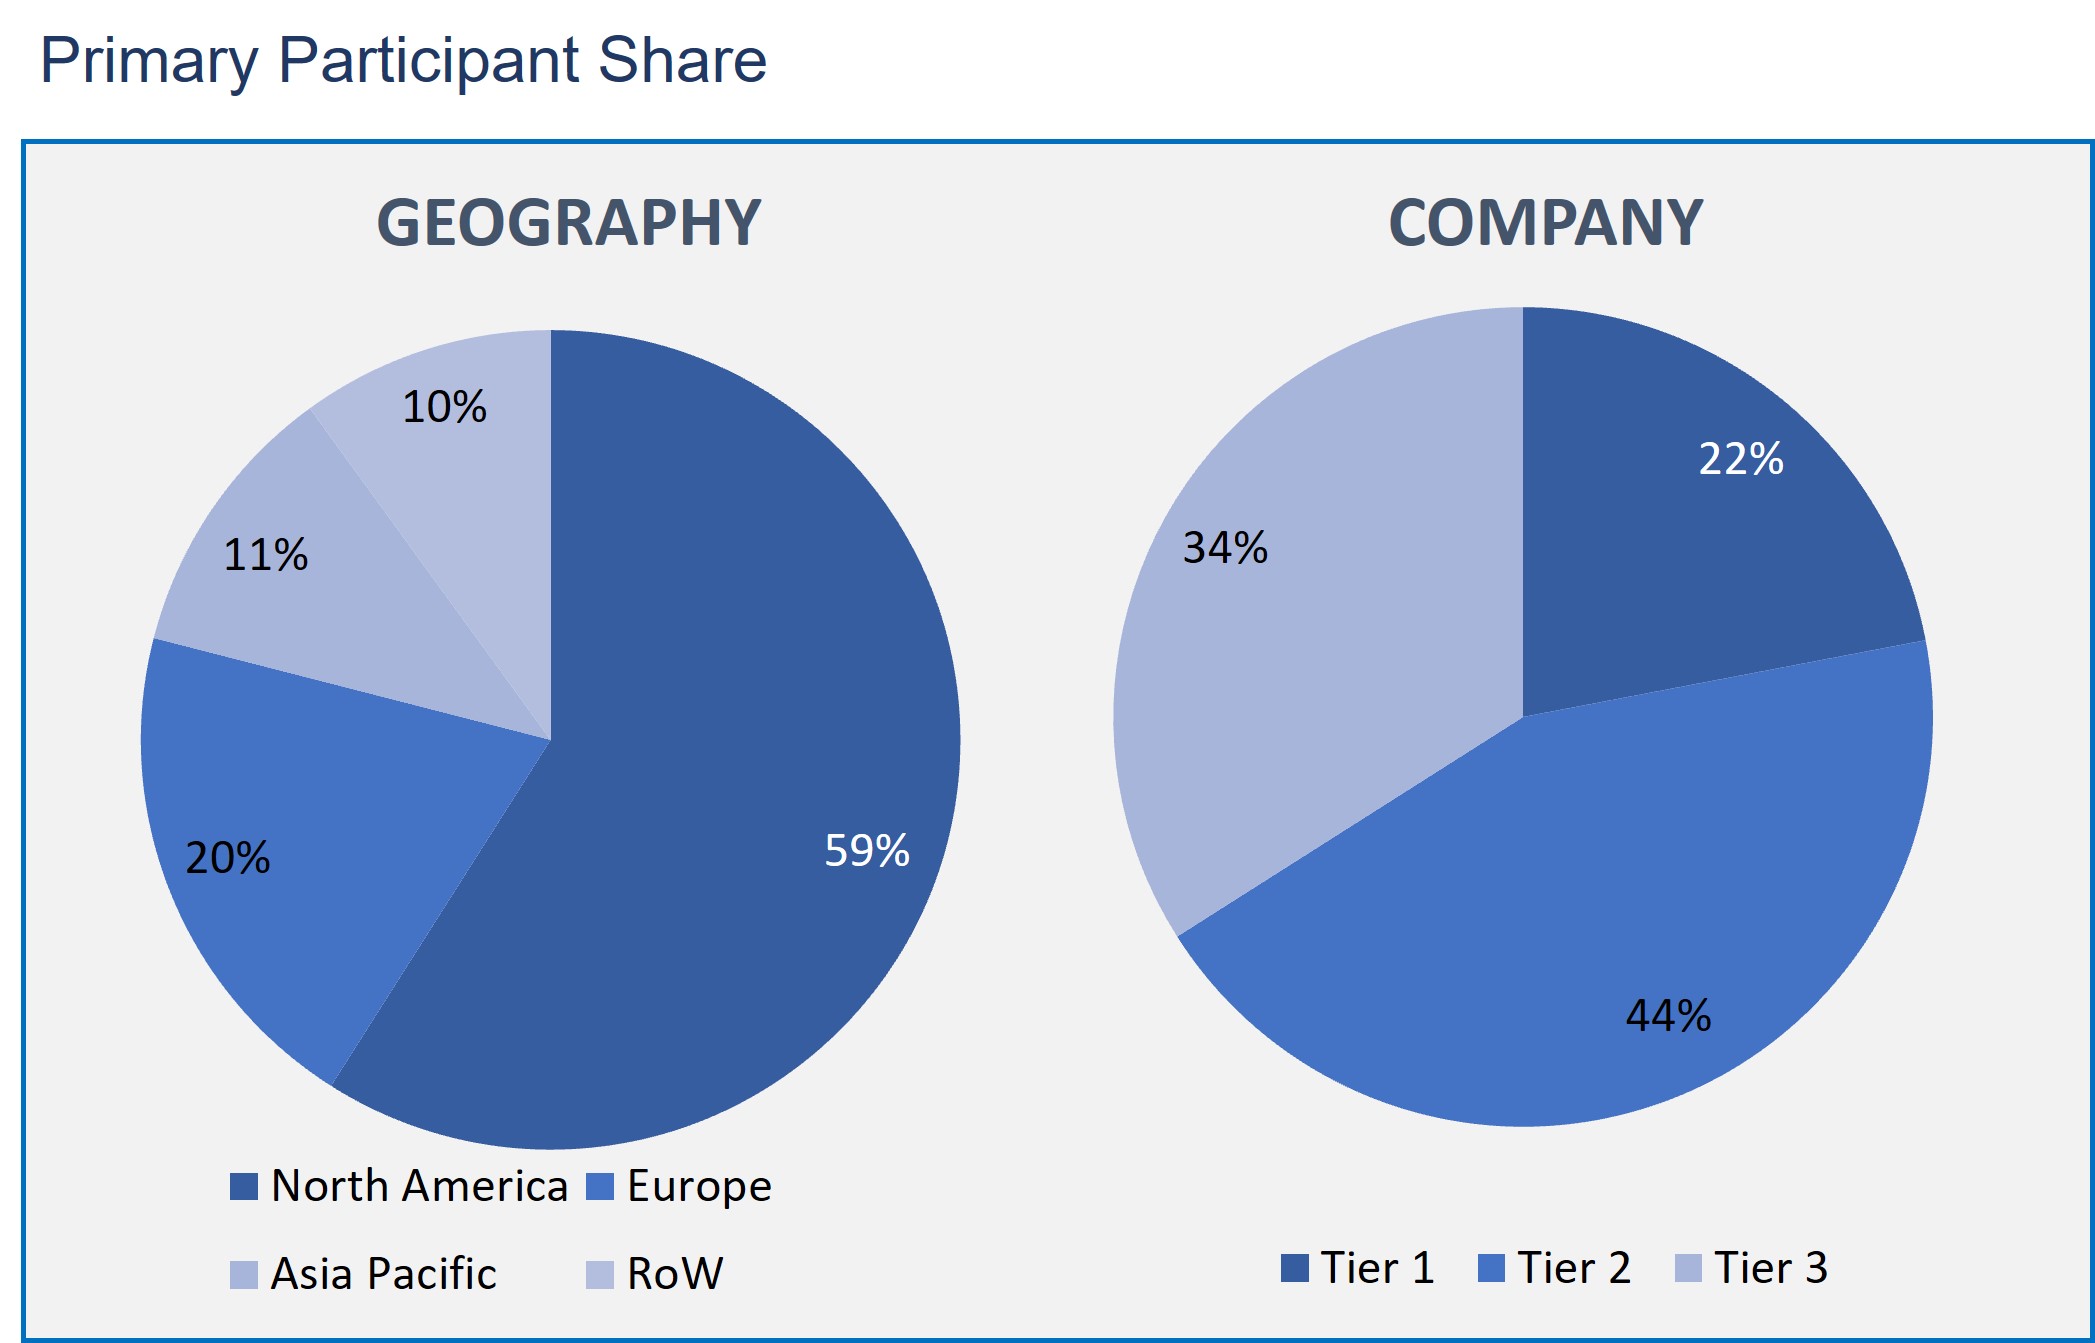
The shale gas market has been analyzed by using the optimum combination of secondary sources and in-house methodology and a unique balance of primary insights. The real-time valuation of the market is an integral part of our forecasting and market sizing methodology. Industry experts and our primary participants have helped to compile related aspects with accurate parametric estimations for a complete study. The primary participants share is given below:
Shale Gas Market on the basis of Technology
- Exploration & Drilling
- Fracturing Fluid
Shale Gas Market on the basis of Application
- Power Generation
- Industrial
- Residential
- Commercial
- Transportation
Shale Gas Market on the basis of Geography
- North America
- Europe
- Asia Pacific
- Rest of the World
Based on technology, the shale gas market is divided into exploration & drilling and fracturing fluid. The fracturing fluid segment is projected to witness a higher CAGR rate over the forecasted period. The segment's growth is ascribed to the rising popularity of fracturing technology because of its outstanding cost-efficiency and great hydrocarbon recovery technique for extraction. In addition, the adoption of hydraulic fracturing with horizontal drilling for piercing ultra-hard shale deep underground reserves and the use of watery fluids such as water, gel, brines, and acid, as the base fluid in the abstraction of shale gas is further enhancing the growth of the market.
As per the application-based segments, the shale gas market is categorized into power generation, industrial, residential, commercial, and transportation. The power generation segment is likely to hold the highest share in the shale gas market. The highest share is credited to the rising use of natural gas in power generation, coupled with the lower price and minimum carbon emission of shale gas. The rising demand for power among industrial verticals and the rising inclination towards cleaner combustion quality of shale gas when compared to other fossil fuels further augment the market growth over the forecast period.
In terms of geographical analysis, the regions are divided accordingly, such as North America, Europe, Asia Pacific, and the rest of the world. Among them, North America is expected to hold a substantial market share. This is majorly due to the enormous of technically regained shale reserves, along with the active commercial production of shale in the region are the key factors.
Furthermore, the emerging advances in technology such as advances in horizontal drilling, the use of multi-well drilling pads, and multi-stage hydraulic fracturing enable the efficient production of shale gas, which is majorly driving the global market's growth. The hydraulic fracturing disturbs the local stress field and causes slid or shearing in naturally broken shale formations. Since monitoring this process utilizing microseismic techniques offers a valuable tool helping to detect the drilling result and understand the operation's efficacy. Hence, it improves shale gas production.
This report also includes the key vendor’s profiles of the shale gas market - Polskie Gornictwo Naftowe I Gazownictwo Sa, Marathon Oil Corp, Baker Hughes Inc., Beach Energy Ltd, Bnk Petroleum Inc, Lng Energy Ltd., Chesapeake Energy Corp, Southwestern Energy Company, Quicksilver Resources Inc. and Petrohawk Energy Corp.
Hence, natural gas, especially shale gas, is a copious energy resource playing a prominent role in future energy demand and allowing the world to transition to higher support on renewable energy sources. And also, shale gas has a wide range of applications.
- This report offers analysis for changing competitive dynamics along with the forward-looking perspective on various factors driving or restraining market growth
- The report gives the forecast analysis on the basis of how the market is predicted to grow
- Further report provides a pin-point analysis of changing competition dynamics and keeps the users ahead of competitors
- This report also helps in making informed business decisions by having complete insights of market and by making in-depth analysis of market segments
- Executive Summary
- Industry Outlook
- Industry Overview
- Industry Trends
- Market Snapshot
- Market Definition
- Market Outlook
- Porter Five Forces
- Related Markets
- Market characteristics
- Market Overview
- Market Segmentation
- Market Dynamics
- Drivers
- Restraints
- Opportunities
- DRO - Impact Analysis
- Technology: Market Size & Analysis
- Overview
- Exploration & Drilling
- Fracturing Fluid
- Application: Market Size & Analysis
- Overview
- Power Generation
- Industrial
- Residential
- Commercial
- Transportation
- Geography: Market Size & Analysis
- Overview
- North America
- Europe
- Asia Pacific
- Rest of the World
- Competitive Landscape
- Competitor Comparison Analysis
- Market Developments
- Mergers and Acquisitions, Legal, Awards, Partnerships
- Product Launches and execution
- Vendor Profiles
- Polskie Gornictwo Naftowe I Gazownictwo Sa
- Overview
- Financial Overview
- Product Offerings
- Developments
- Business Strategy
- Marathon Oil Corp
- Overview
- Financial Overview
- Product Offerings
- Developments
- Business Strategy
- Baker Hughes Inc.
- Overview
- Financial Overview
- Product Offerings
- Developments
- Business Strategy
- Beach Energy Ltd
- Overview
- Financial Overview
- Product Offerings
- Developments
- Business Strategy
- Bnk Petroleum Inc
- Overview
- Financial Overview
- Product Offerings
- Developments
- Business Strategy
- Lng Energy Ltd.
- Overview
- Financial Overview
- Product Offerings
- Developments
- Business Strategy
- Chesapeake Energy Corp
- Overview
- Financial Overview
- Product Offerings
- Developments
- Business Strategy
- Southwestern Energy Company
- Overview
- Financial Overview
- Product Offerings
- Developments
- Business Strategy
- Quicksilver Resources Inc.
- Overview
- Financial Overview
- Product Offerings
- Developments
- Business Strategy
- Petrohawk Energy Corp.
- Overview
- Financial Overview
- Product Offerings
- Developments
- Business Strategy
- Polskie Gornictwo Naftowe I Gazownictwo Sa
- Analyst Opinion
- Annexure
- Report Scope
- Market Definitions
- Research Methodology
- Data Collation and In-house Estimation
- Market Triangulation
- Forecasting
- Report Assumptions
- Declarations
- Stakeholders
- Abbreviations
TABLE 1. GLOBAL SHALE GAS MARKET VALUE, BY TECHNOLOGY, 2021-2026 (USD BILLION)
TABLE 2. GLOBAL SHALE GAS MARKET VALUE FOR EXPLORATION & DRILLING, BY GEOGRAPHY, 2021-2027 (USD BILLION)
TABLE 3. GLOBAL SHALE GAS MARKET VALUE FOR FRACTURING FLUID, BY GEOGRAPHY, 2021-2027 (USD BILLION)
TABLE 4. GLOBAL SHALE GAS MARKET VALUE, BY APPLICATION, 2021-2027 (USD BILLION)
TABLE 5. GLOBAL SHALE GAS MARKET VALUE FOR POWER GENERATION, 2021-2027 (USD BILLION)
TABLE 6. GLOBAL SHALE GASMARKET VALUE FOR INDUSTRIAL, BY GEOGRAPHY, 2021-2027 (USD BILLION)
TABLE 7. GLOBAL SHALE GASMARKET VALUE FOR RESIDENTIAL, BY GEOGRAPHY, 2021-2027 (USD BILLION)
TABLE 8. GLOBAL SHALE GASMARKET VALUE FOR COMMERCIAL, BY GEOGRAPHY, 2021-2027 (USD BILLION)
TABLE 9. GLOBAL SHALE GAS MARKET VALUE FOR TRANSPORTATION, BY GEOGRAPHY, 2021-2027 (USD BILLION)
TABLE 10. NORTH AMERICA SHALE GAS MARKET VALUE, BY COUNTRY, 2021-2027 (USD BILLION)
TABLE 11. NORTH AMERICA SHALE GAS MARKET VALUE, BY TECHNOLOGY, 2021-2027 (USD BILLION)
TABLE 12. NORTH AMERICA SHALE GAS MARKET VALUE, BY APPLICATION, 2021-2027 (USD BILLION)
TABLE 13. U.S SHALE GAS MARKET VALUE, BY TECHNOLOGY, 2021-2027 (USD BILLION)
TABLE 14. U.S SHALE GAS MARKET VALUE, BY APPLICATION, 2021-2027 (USD BILLION)
TABLE 15. CANADA SHALE GAS MARKET VALUE, BY TECHNOLOGY, 2021-2027 (USD BILLION)
TABLE 16. CANADA SHALE GAS MARKET VALUE, BY APPLICATION, 2021-2027 (USD BILLION)
TABLE 17. EUROPE SHALE GAS MARKET VALUE, BY COUNTRY, 2021-2027 (USD BILLION)
TABLE 18. EUROPE SHALE GAS MARKET VALUE, BY TECHNOLOGY, 2021-2027 (USD BILLION)
TABLE 19. EUROPE SHALE GAS MARKET VALUE, APPLICATION, 2021-2027 (USD BILLION)
TABLE 20. GERMANY SHALE GAS MARKET VALUE, BY TECHNOLOGY, 2021-2027 (USD BILLION)
TABLE 21. GERMANY SHALE GAS MARKET VALUE, BY APPLICATION, 2021-2027 (USD BILLION)
TABLE 22. U.K SHALE GAS MARKET VALUE, BY TECHNOLOGY, 2021-2027 (USD BILLION)
TABLE 23. U.K SHALE GAS MARKET VALUE, BY APPLICATION, 2021-2027 (USD BILLION)
TABLE 24. FRANCE SHALE GAS MARKET VALUE, BY TECHNOLOGY, 2021-2027 (USD BILLION)
TABLE 25. FRANCE SHALE GAS MARKET VALUE, BY APPLICATION, 2021-2027 (USD BILLION)
TABLE 26. ITALY SHALE GAS MARKET VALUE, BY TECHNOLOGY, 2021-2027 (USD BILLION)
TABLE 27. ITALY SHALE GAS MARKET VALUE, BY APPLICATION, 2021-2027 (USD BILLION)
TABLE 28. SPAIN SHALE GAS MARKET VALUE, BY TECHNOLOGY, 2021-2027 (USD BILLION)
TABLE 29. SPAIN SHALE GAS MARKET VALUE, BY APPLICATION, 2021-2027 (USD BILLION)
TABLE 30. ROE SHALE GAS MARKET VALUE, BY TECHNOLOGY, 2021-2027 (USD BILLION)
TABLE 31. ROE SHALE GAS MARKET VALUE, BY APPLICATION, 2021-2027 (USD BILLION)
TABLE 32. ASIA PACIFIC SHALE GAS MARKET VALUE, BY COUNTRY, 2021-2027 (USD BILLION)
TABLE 33. ASIA PACIFIC SHALE GAS MARKET VALUE, BY TECHNOLOGY, 2021-2027 (USD BILLION)
TABLE 34. ASIA PACIFIC SHALE GAS MARKET VALUE, BY APPLICATION, 2021-2027 (USD BILLION)
TABLE 35. CHINA SHALE GAS MARKET VALUE, BY TECHNOLOGY, 2021-2027 (USD BILLION)
TABLE 36. CHINA SHALE GAS MARKET VALUE, BY APPLICATION, 2021-2027 (USD BILLION)
TABLE 37. INDIA SHALE GAS MARKET VALUE, BY TECHNOLOGY, 2021-2027 (USD BILLION)
TABLE 38. INDIA SHALE GAS MARKET VALUE, BY APPLICATION, 2021-2027 (USD BILLION)
TABLE 39. JAPAN SHALE GAS MARKET VALUE, BY TECHNOLOGY, 2021-2027 (USD BILLION)
TABLE 40. JAPAN SHALE GAS MARKET VALUE, BY APPLICATION, 2021-2027 (USD BILLION)
TABLE 41. REST OF APAC SHALE GAS MARKET VALUE, BY TECHNOLOGY, 2021-2027 (USD BILLION)
TABLE 42. REST OF APAC SHALE GAS MARKET VALUE, BY APPLICATION, 2021-2027 (USD BILLION)
TABLE 43. REST OF WORLD SHALE GAS MARKET VALUE, BY TECHNOLOGY, 2021-2027 (USD BILLION)
TABLE 44. REST OF WORLD SHALE GAS MARKET VALUE, BY APPLICATION, 2021-2027 (USD BILLION)
TABLE 45. POLSKIE GORNICTWO NAFTOWE I GAZOWNICTWO SA: FINANCIALS
TABLE 46. POLSKIE GORNICTWO NAFTOWE I GAZOWNICTWO SA: PRODUCTS & SERVICES
TABLE 47. POLSKIE GORNICTWO NAFTOWE I GAZOWNICTWO SA: RECENT DEVELOPMENTS
TABLE 48. MARATHON OIL CORP: FINANCIALS
TABLE 49. MARATHON OIL CORP: PRODUCTS & SERVICES
TABLE 50. MARATHON OIL CORP: RECENT DEVELOPMENTS
TABLE 51. BAKER HUGHES INC: FINANCIALS
TABLE 52. BAKER HUGHES INC: PRODUCTS & SERVICES
TABLE 53. BAKER HUGHES INC: RECENT DEVELOPMENTS
TABLE 54. BEACH ENERGY LTD: FINANCIALS
TABLE 55. BEACH ENERGY LTD: PRODUCTS & SERVICES
TABLE 56. BEACH ENERGY LTD: RECENT DEVELOPMENTS
TABLE 57. BNK PETROLEUM INC: FINANCIALS
TABLE 58. BNK PETROLEUM INC: PRODUCTS & SERVICES
TABLE 59. BNK PETROLEUM INC: RECENT DEVELOPMENTS
TABLE 60. LNG ENERGY LTD: FINANCIALS
TABLE 61. LNG ENERGY LTD: PRODUCTS & SERVICES
TABLE 62. LNG ENERGY LTD: RECENT DEVELOPMENTS
TABLE 63. CHESAPEAKE ENERGY CORP: FINANCIALS
TABLE 64. CHESAPEAKE ENERGY CORP: PRODUCTS & SERVICES
TABLE 65. CHESAPEAKE ENERGY CORP: RECENT DEVELOPMENTS
TABLE 66. SOUTHWESTERN ENERGY COMPANY: FINANCIALS
TABLE 67. SOUTHWESTERN ENERGY COMPANY: PRODUCTS & SERVICES
TABLE 68. SOUTHWESTERN ENERGY COMPANY: RECENT DEVELOPMENTS
TABLE 69. QUICKSILVER RESOURCES INC: FINANCIALS
TABLE 70. QUICKSILVER RESOURCES INC: PRODUCTS & SERVICES
TABLE 71. QUICKSILVER RESOURCES INC: RECENT DEVELOPMENTS
TABLE 72. PETROHAWK ENERGY CORP: FINANCIALS
TABLE 73. PETROHAWK ENERGY CORP: PRODUCTS & SERVICES
TABLE 74. PETROHAWK ENERGY CORP: RECENT DEVELOPMENTS
Research Framework
Infoholic Research works on a holistic 360° approach in order to deliver high quality, validated and reliable information in our market reports. The Market estimation and forecasting involves following steps:
- Data Collation (Primary & Secondary)
- In-house Estimation (Based on proprietary data bases and Models)
- Market Triangulation
- Forecasting

Market related information is congregated from both primary and secondary sources.
Primary sources
Involved participants from all global stakeholders such as Solution providers, service providers, Industry associations, thought leaders etc. across levels such as CXOs, VPs and managers. Plus, our in-house industry experts having decades of industry experience contribute their consulting and advisory services.
Secondary sources
Include public sources such as regulatory frameworks, government IT spending, government demographic indicators, industry association statistics, and company publications along with paid sources such as Factiva, OneSource, Bloomberg among others.
![]()


