
Revenue Cycle Management Market by Function (Claims & Denial Management, Consumables, Medical Coding & Billing, Patient Insurance Eligibility Verification, Payment Remittance, Electronic Health Record, Clinical Documentation Improvement and Other Functions) Offering (Software and Services), Product (Integrated Solutions and Standalone Solutions), End-User (Physicians, Hospitals, Laboratories, and Other End Users), Geography (North America, Europe, Asia Pacific and Rest of the World)
- August, 2020
- Domain: ICT - Verticals - Healthcare
- Get Free 10% Customization in this Report
Revenue cycle management is the financial process of the medical bills and utilized by the healthcare systems, mostly in developed countries such as the United States, Europe, and other parts the world. This process helps to track the revenue generated from the healthcare services by registering all the payment processes on the revenue cycle management platform. The revenue cycle management is a complex process; hence, healthcare providers can outsource their revenue cycle management process to other companies to handle the complex process with the help of professional agents. The major factors boosting the market growth is decreased reimbursements in the healthcare industry, electronic medical record, or electronic health records became mandatory in the healthcare industry. Somehow, the lack of skilled IT professionals in the revenue cycle management is hindering the market growth. The revenue cycle management market is estimated to grow at a CAGR of 12.9% in the forecasting period, from a base value of $71.11 billion in 2020 to $147.27 billion in 2026.
The scope of the study on the revenue cycle management market has been defined based on function, offering, product, end-user, and geography.
Based on Function:
- Claims & Denial Management
- Medical Coding & Billing
- Patient Insurance Eligibility Verification
- Payment Remittance
- Electronic Health Record
- Clinical Documentation Improvement
- Other Functions
Based on Offering:
- Software
- Services
Based on Product:
- Integrated Solutions
- Standalone Solutions
Based on End User:
- Physicians
- Hospitals
- Laboratories
- Other End Users
Based on Geography:
- North America
- Europe
- Asia Pacific
- Rest of the World
On the basis of function, the claim and denial management segment is expected to lead the market share due to the increasing progress in the reimbursement structure, and the growing prevalence of claim denials or errors in the medical claims are the reasons for the great demand for claim and denial management.
Based on the offering, the service segment is expected to exhibit the highest market share in the market due to the lack of skilled resources in the financial process in the healthcare industry resulted in increasing adoption of outsourcing the revenue cycle management process to the outsourced party.
In the market, based on the product categorization, the integrated solution is expected to have the largest share in the market with the growing demand for value-based payment systems and the rising adoption of cost-effective data management solutions.
Further market based on the end-user is segmented by physicians, hospitals, laboratories, and other end-users. The physicians segment is expected to have the largest share in the market because adoption management systems such as consolidated practice among the physicians boost the market growth in this segment.
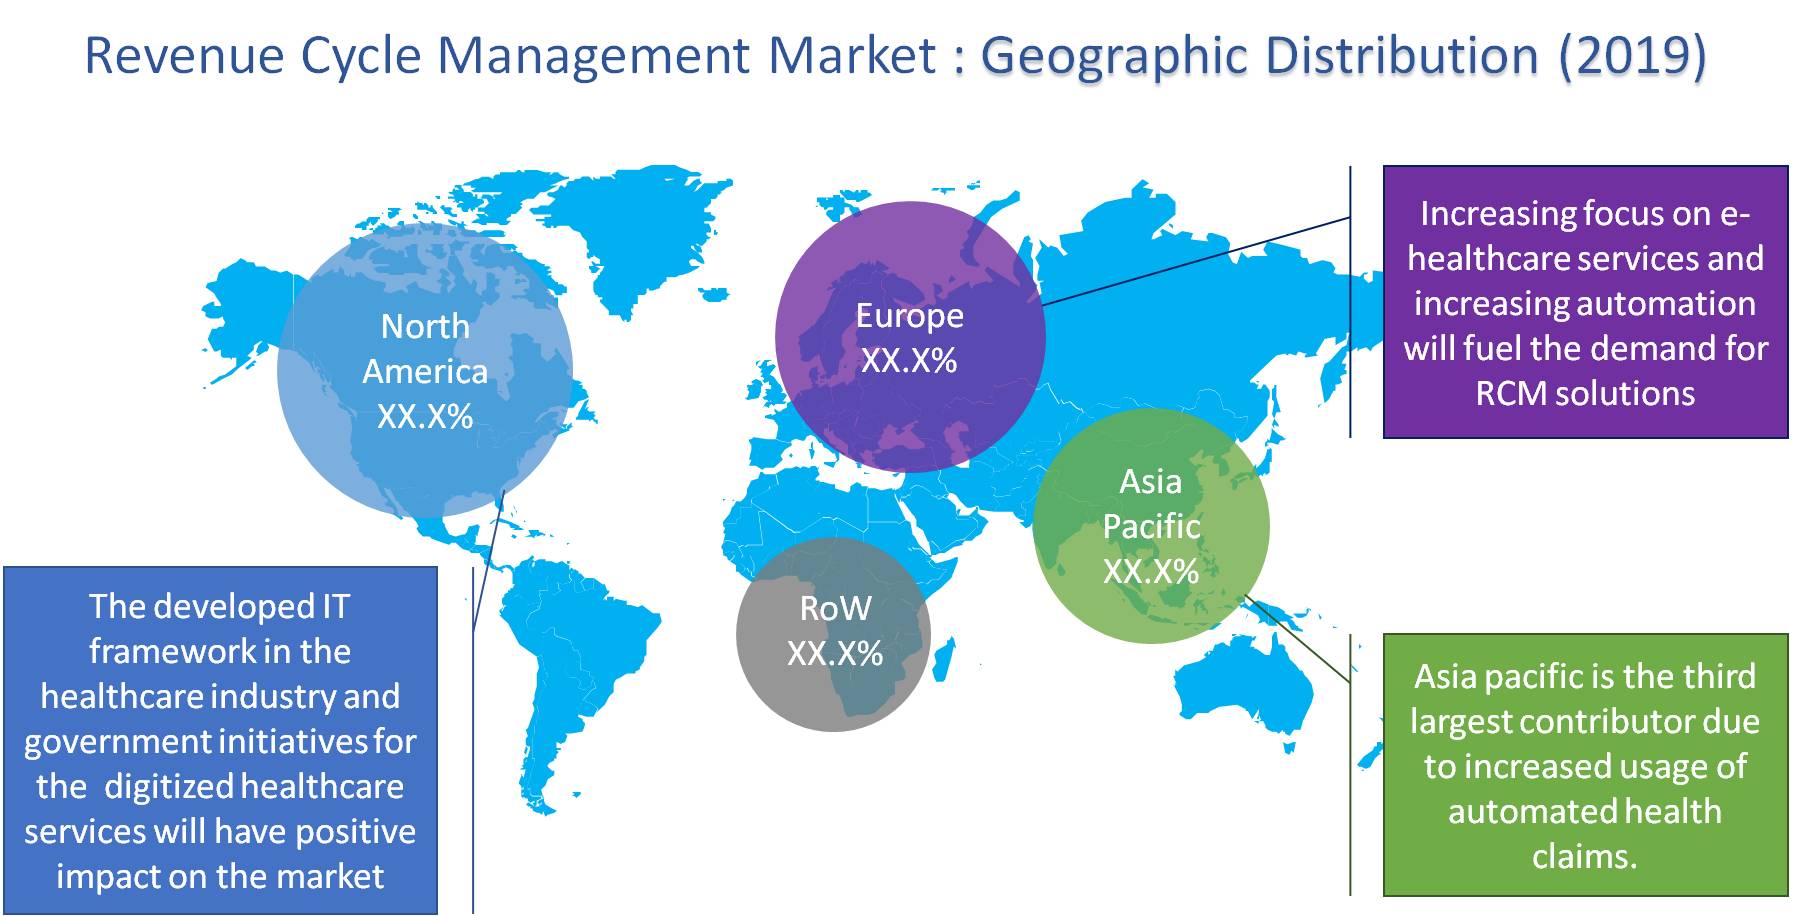
In the revenue cycle management market, North America accounted for the largest share due to the developed IT framework in the healthcare industry, the large numbers of hospitals, and efficient healthcare systems in this region. Europe accounted the second largest market share in the market due to the government initiatives for e-health and improved overall efficient healthcare organizations system in this region.
The key players in the market of Revenue cycle management are Cerner, Mckesson, Quest Diagnostics, Allscripts Healthcare Solutions, Athenahealth, Ge Healthcare, ECLINICALWORKS, Conifer Health Solutions, Epic Systems, Gebbs Healthcare Solutions, Experian, Agilent Technologies, Inc, Constellation Software, The Ssi Group, and Nthrive.
Globally, the demand for the revenue cycle management is increasing, and the major factors affecting the market growth are apprised regulatory mandates for the adoption of the electronic health records of the patients in the healthcare organizations and government is also taking the initiative towards the adoption of the revenue cycle management solutions in the healthcare industry. However, the risk in data security and privacy is a challenging factor for the market growth.
Moreover, the revenue cycle management process has a great impact on the healthcare industry for the easy management of healthcare services bills and fewer occurrence of errors in the revenue management process. The qualitative and quantitative analysis of the market enables users to develop effective strategies to solidify their presence in the market.
- The competitive landscape includes the analysis of leading players strategic initiatives including product innovations, joint ventures, collaborations, and mergers and acquisitions.
- This report also provides the portfolio analysis and capability analysis of the leading players.
- Quantitative analysis of the market enables users to understand the actual facts of the market across four major regions.
1. Executive Summary
2. Industry Outlook
2.1. Industry Overview
2.2. Industry Trends
3. Market Snapshot
3.1. Total Adressable Market
3.2. Segment Addressable Market
3.2.1. PEST Analysis
3.2.2. Porter Five Forces
3.3. Related Markets
3.4. Ecosystem
4. Market Outlook
4.1. Overview
4.1.1. Market Evolution
4.2. Market Trends and Impact
4.3. Pricing Analysis
4.4. Market Segmentation
4.5. Market Dynamics
4.5.1. Drivers
4.5.2. Restraints
4.5.3. Opportunities
4.6. DRO - Impact Analysis
5. Function: Market Size & Analysis
5.1. Overview
5.2. Claims & Denial Management
5.3. Medical Coding & Billing
5.4. Patient Insurance Eligibility Verification
5.5. Payment Remittance
5.6. Electronic Health Record
5.7. Clinical Documentation Improvement
5.8. Other Functions
6. Offering: Market Size & Analysis
6.1. Overview
6.2. Software
6.3. Services
7. Product: Market Size & Analysis
7.1. Overview
7.2. Integrated Solutions
7.3. Standalone Solutions
8. End-user: Market Size & Analysis
8.1. Overview
8.2. Physicians
8.3. Hospitals
8.4. Laboratories
8.5. Other End Users
9. Geography: Market Size & Analysis
9.1. Overview
9.2. North America
9.3. Europe
9.4. Asia Pacific
9.5. Rest of the World
10. Competitive Landscape
10.1. Competitor Comparison Analysis
10.2. Market Developments
10.3. Mergers and Acquisitions, Legal, Awards, Partnerships
10.4. Product Launches and execution
11. Vendor Profiles
11.1. Cerner
11.1.1. Overview
11.1.2. Business Units
11.1.3. Geographic Revenue
11.1.4. Product Offerings
11.1.5. Developments
11.1.6. Business Strategy
11.2. Mckesson
11.2.1. Overview
11.2.2. Business Units
11.2.3. Geographic Revenue
11.2.4. Product Offerings
11.2.5. Developments
11.2.6. Business Strategy
11.3. Quest Diagnostics
11.3.1. Overview
11.3.2. Business Units
11.3.3. Geographic Revenue
11.3.4. Product Offerings
11.3.5. Developments
11.3.6. Business Strategy
11.4. Allscripts Healthcare Solutions
11.4.1. Overview
11.4.2. Business Units
11.4.3. Geographic Revenue
11.4.4. Product Offerings
11.4.5. Developments
11.4.6. Business Strategy
11.5. Athenahealth
11.5.1. Overview
11.5.2. Business Units
11.5.3. Geographic Revenue
11.5.4. Product Offerings
11.5.5. Developments
11.5.6. Business Strategy
11.6. Ge Healthcare
11.6.1. Overview
11.6.2. Business Units
11.6.3. Geographic Revenue
11.6.4. Product Offerings
11.6.5. Developments
11.6.6. Business Strategy
11.7. ECLINICALWORKS
11.7.1. Overview
11.7.2. Business Units
11.7.3. Geographic Revenue
11.7.4. Product Offerings
11.7.5. Developments
11.7.6. Business Strategy
11.8. Conifer Health Solutions
11.8.1. Overview
11.8.2. Business Units
11.8.3. Geographic Revenue
11.8.4. Product Offerings
11.8.5. Developments
11.8.6. Business Strategy
11.9. Epic Systems
11.9.1. Overview
11.9.2. Business Units
11.9.3. Geographic Revenue
11.9.4. Product Offerings
11.9.5. Developments
11.9.6. Business Strategy
11.10. Gebbs Healthcare Solutions
11.10.1. Overview
11.10.2. Business Units
11.10.3. Geographic Revenue
11.10.4. Product Offerings
11.10.5. Developments
11.10.6. Business Strategy
12. Companies to Watch
12.1. Experian
12.1.1. Overview
12.1.2. Market
12.1.3. Business Strategy
12.2. Agilent Technologies, Inc
12.2.1. Overview
12.2.2. Market
12.2.3. Business Strategy
12.3. Constellation Software
12.3.1. Overview
12.3.2. Market
12.3.3. Business Strategy
12.4. The Ssi Group
12.4.1. Overview
12.4.2. Market
12.4.3. Business Strategy
12.5. Nthrive
12.5.1. Overview
12.5.2. Market
12.5.3. Business Strategy
13. Analyst Opinion
14. Annexure
14.1. Report Scope
14.2. Market Definitions
14.3. Research Methodology
14.3.1. Data Collation and In-house Estimation
14.3.2. Market Triangulation
14.3.3. Forecasting
14.4. Report Assumptions
14.5. Declarations
14.6. Stakeholders
14.7. Abbreviations
TABLE 1. GLOBAL REVENUE CYCLE MANAGEMENTMARKET VALUE, BY FUNCTION, 2020-2026 (USD
MILLION)
TABLE 2. GLOBAL REVENUE CYCLE MANAGEMENTMARKET VALUE FOR CLAIMS & DENIAL
MANAGEMENT, BY GEOGRAPHY, 2020-2026 (USD MILLION)
TABLE 3. GLOBAL REVENUE CYCLE MANAGEMENTMARKET VALUE FOR MEDICAL CODING & BILLING, BY
GEOGRAPHY, 2020-2026 (USD MILLION)
TABLE 4. GLOBAL REVENUE CYCLE MANAGEMENTMARKET VALUE FOR PATIENT INSURANCE
ELIGIBILITY VERIFICATION, BY GEOGRAPHY, 2020-2026 (USD MILLION)
TABLE 5. GLOBAL REVENUE CYCLE MANAGEMENTMARKET VALUE FOR PCR CLINICAL DOCUMENTATION
IMPROVEMENT, BY GEOGRAPHY, 2020-2026 (USD MILLION)
TABLE 6. GLOBAL REVENUE CYCLE MANAGEMENTMARKET VALUE FOR PAYMENT REMITTANCE, BY
GEOGRAPHY, 2020-2026 (USD MILLION)
TABLE 7. GLOBAL REVENUE CYCLE MANAGEMENTMARKET VALUE FOR ELECTRONIC HEALTH RECORD,
BY GEOGRAPHY, 2020-2026 (USD MILLION)
TABLE 8. GLOBAL REVENUE CYCLE MANAGEMENTMARKET VALUE FOR CLINICAL DOCUMENTATION
IMPROVEMENT, BY GEOGRAPHY, 2020-2026 (USD MILLION)
TABLE 9. GLOBAL REVENUE CYCLE MANAGEMENTMARKET VALUE FOR OTHER FUNCTIONS, BY
GEOGRAPHY, 2020-2026 (USD MILLION)
TABLE 10. GLOBAL REVENUE CYCLE MANAGEMENTMARKET VALUE, BY OFFERING, 2020-2026 (USD
MILLION)
TABLE 11. GLOBAL REVENUE CYCLE MANAGEMENTMARKET VALUE FOR SOFTWARE, BY GEOGRAPHY,
2020-2026 (USD MILLION)
TABLE 12. GLOBAL REVENUE CYCLE MANAGEMENTMARKET VALUE FOR SERVICES, BY GEOGRAPHY,
2020-2026 (USD MILLION)
TABLE 13. GLOBAL REVENUE CYCLE MANAGEMENTMARKET VALUE FOR PRODUCT, BY GEOGRAPHY,
2020-2026 (USD MILLION)
TABLE 14. GLOBAL REVENUE CYCLE MANAGEMENTMARKET VALUE FOR INTEGRATED SOLUTIONS, BY
GEOGRAPHY, 2020-2026 (USD MILLION)
TABLE 15. GLOBAL REVENUE CYCLE MANAGEMENT MARKET VALUE FOR STANDALONE SOLUTIONS, BY
GEOGRAPHY, 2020-2026 (USD MILLION)
TABLE 16. GLOBAL REVENUE CYCLE MANAGEMENT MARKET VALUE FOR END USER, BY GEOGRAPHY,
2020-2026 (USD MILLION)
TABLE 17. GLOBAL REVENUE CYCLE MANAGEMENT MARKET VALUE FOR PHYSICIANS, BY GEOGRAPHY,
2020-2026 (USD MILLION)
TABLE 18. GLOBAL REVENUE CYCLE MANAGEMENT MARKET VALUE FOR HOSPITALS, BY GEOGRAPHY,
2020-2026 (USD MILLION)
TABLE 19. GLOBAL REVENUE CYCLE MANAGEMENT MARKET VALUE FOR LABORATORIES, BY
GEOGRAPHY, 2020-2026 (USD MILLION)
TABLE 20. GLOBAL REVENUE CYCLE MANAGEMENT MARKET VALUE FOR OTHER END USERS, BY
GEOGRAPHY, 2020-2026 (USD MILLION)
TABLE 21. NORTH AMERICA REVENUE CYCLE MANAGEMENTMARKET VALUE, BY COUNTRY, 2020-2026
(USD MILLION)
TABLE 22. NORTH AMERICA REVENUE CYCLE MANAGEMENTMARKET VALUE, BY FUNCTION, 2020-2026
(USD MILLION)
TABLE 23. NORTH AMERICA REVENUE CYCLE MANAGEMENTMARKET VALUE, BY OFFERING, 2020-2026
(USD MILLION)
TABLE 24. NORTH AMERICA REVENUE CYCLE MANAGEMENTMARKET VALUE FOR PRODUCT, BY
GEOGRAPHY, 2020-2026 (USD MILLION)
TABLE 25. NORTH AMERICA REVENUE CYCLE MANAGEMENTMARKET VALUE FOR END USER, BY
GEOGRAPHY, 2020-2026 (USD MILLION)
TABLE 26. U.S REVENUE CYCLE MANAGEMENTMARKET VALUE, BY FUNCTION, 2020-2026 (USD
MILLION)
TABLE 27. U.S REVENUE CYCLE MANAGEMENTMARKET VALUE, BY OFFERING, 2020-2026 (USD
MILLION)
TABLE 28. U.S REVENUE CYCLE MANAGEMENTMARKET VALUE FOR PRODUCT, BY GEOGRAPHY, 2020-
2026 (USD MILLION)
TABLE 29. U.S REVENUE CYCLE MANAGEMENTMARKET VALUE FOR END USER, BY GEOGRAPHY, 2020-
2026 (USD MILLION)
TABLE 30. CANADA REVENUE CYCLE MANAGEMENTMARKET VALUE, BY FUNCTION, 2020-2026 (USD
MILLION)
TABLE 31. CANADA REVENUE CYCLE MANAGEMENTMARKET VALUE, BY OFFERING, 2020-2026 (USD
MILLION)
TABLE 32. CANADA REVENUE CYCLE MANAGEMENTMARKET VALUE FOR PRODUCT, BY GEOGRAPHY,
2020-2026 (USD MILLION)
TABLE 33. CANADA REVENUE CYCLE MANAGEMENTMARKET VALUE FOR END USER, BY GEOGRAPHY,
2020-2026 (USD MILLION)
TABLE 34. EUROPE REVENUE CYCLE MANAGEMENTMARKET VALUE, BY COUNTRY, 2020-2026 (USD
MILLION)
TABLE 35. EUROPE REVENUE CYCLE MANAGEMENTMARKET VALUE, BY FUNCTION, 2020-2026 (USD
MILLION)
TABLE 36. EUROPE REVENUE CYCLE MANAGEMENTMARKET VALUE, BY OFFERING, 2020-2026 (USD
MILLION)
TABLE 37. EUROPE REVENUE CYCLE MANAGEMENTMARKET VALUE FOR PRODUCT, BY GEOGRAPHY,
2020-2026 (USD MILLION)
TABLE 38. EUROPE REVENUE CYCLE MANAGEMENTMARKET VALUE FOR END USER, BY GEOGRAPHY,
2020-2026 (USD MILLION)
TABLE 39. GERMANY REVENUE CYCLE MANAGEMENTMARKET VALUE, BY FUNCTION, 2020-2026 (USD
MILLION)
TABLE 40. GERMANY REVENUE CYCLE MANAGEMENTMARKET VALUE, BY OFFERING, 2020-2026 (USD
MILLION)
TABLE 41. GERMANY REVENUE CYCLE MANAGEMENTMARKET VALUE FOR PRODUCT, BY GEOGRAPHY,
2020-2026 (USD MILLION)
TABLE 42. GERMANY REVENUE CYCLE MANAGEMENTMARKET VALUE FOR END USER, BY GEOGRAPHY,
2020-2026 (USD MILLION)
TABLE 43. U.K REVENUE CYCLE MANAGEMENTMARKET VALUE, BY FUNCTION, 2020-2026 (USD
MILLION)
TABLE 44. U.K REVENUE CYCLE MANAGEMENTMARKET VALUE, BY OFFERING, 2020-2026 (USD
MILLION)
TABLE 45. U.K REVENUE CYCLE MANAGEMENTMARKET VALUE FOR PRODUCT, BY GEOGRAPHY, 2020-
2026 (USD MILLION)
TABLE 46. U.K REVENUE CYCLE MANAGEMENTMARKET VALUE FOR END USER, BY GEOGRAPHY, 2020-
2026 (USD MILLION)
TABLE 47. FRANCE REVENUE CYCLE MANAGEMENTMARKET VALUE, BY FUNCTION, 2020-2026 (USD
MILLION)
TABLE 48. FRANCE REVENUE CYCLE MANAGEMENTMARKET VALUE, BY OFFERING, 2020-2026 (USD
MILLION)
TABLE 49. FRANCE REVENUE CYCLE MANAGEMENTMARKET VALUE FOR PRODUCT, BY GEOGRAPHY,
2020-2026 (USD MILLION)
TABLE 50. FRANCE REVENUE CYCLE MANAGEMENTMARKET VALUE FOR END USER, BY GEOGRAPHY,
2020-2026 (USD MILLION)
TABLE 51. ROE REVENUE CYCLE MANAGEMENTMARKET VALUE, BY FUNCTION, 2020-2026 (USD
MILLION)
TABLE 52. ROE REVENUE CYCLE MANAGEMENTMARKET VALUE, BY OFFERING, 2020-2026 (USD
MILLION)
TABLE 53. ROE REVENUE CYCLE MANAGEMENTMARKET VALUE FOR PRODUCT, BY GEOGRAPHY, 2020-
2026 (USD MILLION)
TABLE 54. ROE REVENUE CYCLE MANAGEMENTMARKET VALUE FOR END USER, BY GEOGRAPHY, 2020-
2026 (USD MILLION)
TABLE 55. ASIA PACIFIC REVENUE CYCLE MANAGEMENTMARKET VALUE, BY COUNTRY, 2020-2026 (USD
MILLION)
TABLE 56. ASIA PACIFIC REVENUE CYCLE MANAGEMENTMARKET VALUE, BY FUNCTION, 2020-2026
(USD MILLION)
TABLE 57. ASIA PACIFIC REVENUE CYCLE MANAGEMENTMARKET VALUE, BY OFFERING, 2020-2026
(USD MILLION)
TABLE 58. ASIA PACIFIC REVENUE CYCLE MANAGEMENTMARKET VALUE FOR PRODUCT, BY
GEOGRAPHY, 2020-2026 (USD MILLION)
TABLE 59. ASIA PACIFIC REVENUE CYCLE MANAGEMENTMARKET VALUE FOR END USER, BY
GEOGRAPHY, 2020-2026 (USD MILLION)
TABLE 60. CHINA REVENUE CYCLE MANAGEMENTMARKET VALUE, BY FUNCTION, 2020-2026 (USD
MILLION)
TABLE 61. CHINA REVENUE CYCLE MANAGEMENTMARKET VALUE, BY OFFERING, 2020-2026 (USD
MILLION)
TABLE 62. CHINA REVENUE CYCLE MANAGEMENTMARKET VALUE FOR PRODUCT, BY GEOGRAPHY, 2020-
2026 (USD MILLION)
TABLE 63. CHINA REVENUE CYCLE MANAGEMENTMARKET VALUE FOR END USER, BY GEOGRAPHY,
2020-2026 (USD MILLION)
TABLE 64. JAPAN REVENUE CYCLE MANAGEMENTMARKET VALUE, BY FUNCTION, 2020-2026 (USD
MILLION)
TABLE 65. JAPAN REVENUE CYCLE MANAGEMENTMARKET VALUE, BY OFFERING, 2020-2026 (USD
MILLION)
TABLE 66. JAPAN REVENUE CYCLE MANAGEMENTMARKET VALUE FOR PRODUCT, BY GEOGRAPHY, 2020-
2026 (USD MILLION)
TABLE 67. JAPAN REVENUE CYCLE MANAGEMENTMARKET VALUE FOR END USER, BY GEOGRAPHY, 2020-
2026 (USD MILLION)
TABLE 68. REST OF APAC REVENUE CYCLE MANAGEMENTMARKET VALUE, BY FUNCTION, 2020-2026
(USD MILLION)
TABLE 69. REST OF APAC REVENUE CYCLE MANAGEMENTMARKET VALUE, BY OFFERING, 2020-2026
(USD MILLION)
TABLE 70. REST OF APAC REVENUE CYCLE MANAGEMENTMARKET VALUE FOR PRODUCT, BY
GEOGRAPHY, 2020-2026 (USD MILLION)
TABLE 71. REST OF APAC REVENUE CYCLE MANAGEMENTMARKET VALUE FOR END USER, BY
GEOGRAPHY, 2020-2026 (USD MILLION)
TABLE 72. REST OF WORLD REVENUE CYCLE MANAGEMENTMARKET VALUE, BY FUNCTION, 2020-2026
(USD MILLION)
TABLE 73. REST OF WORLD REVENUE CYCLE MANAGEMENTMARKET VALUE, BY OFFERING, 2020-2026
(USD MILLION)
TABLE 74. REST OF WORLD REVENUE CYCLE MANAGEMENTMARKET VALUE FOR PRODUCT, BY
GEOGRAPHY, 2020-2026 (USD MILLION)
TABLE 75. REST OF WORLD REVENUE CYCLE MANAGEMENTMARKET VALUE FOR END USER, BY
GEOGRAPHY, 2020-2026 (USD MILLION)
TABLE 76. CERNER.: OVERVIEW
TABLE 77. CERNER.: STRATEGIC SNAPSHOT
TABLE 78. CERNER.: BUSINESS OPPORTUNITIES AND OUTLOOK
TABLE 79. CERNER.: FUNCTION/SERVICE PORTFOLIO
TABLE 80. MCKESSON: OVERVIEW
TABLE 81. MCKESSON: STRATEGIC SNAPSHOT
TABLE 82. MCKESSON: BUSINESS OPPORTUNITIES AND OUTLOOK
TABLE 83. MCKESSON: FUNCTION/SERVICE PORTFOLIO
TABLE 84. QUEST DIAGNOSTICS: OVERVIEW
TABLE 85. QUEST DIAGNOSTICS: STRATEGIC SNAPSHOT
TABLE 86. QUEST DIAGNOSTICS: BUSINESS OPPORTUNITIES AND OUTLOOK
TABLE 87. QUEST DIAGNOSTICS: FUNCTION/SERVICE PORTFOLIO
TABLE 88. ALLSCRIPTS HEALTHCARE SOLUTIONS.: OVERVIEW
TABLE 89. ALLSCRIPTS HEALTHCARE SOLUTIONS.: STRATEGIC SNAPSHOT
TABLE 90. ALLSCRIPTS HEALTHCARE SOLUTIONS.: BUSINESS OPPORTUNITIES AND OUTLOOK
TABLE 91. ALLSCRIPTS HEALTHCARE SOLUTIONS.: FUNCTION/SERVICE PORTFOLIO
TABLE 92. ATHENAHEALTH: OVERVIEW
TABLE 93. ATHENAHEALTH: STRATEGIC SNAPSHOT
TABLE 94. ATHENAHEALTH: BUSINESS OPPORTUNITIES AND OUTLOOK
TABLE 95. ATHENAHEALTH: FUNCTION/SERVICE PORTFOLIO
TABLE 96. Ge Healthcare.: OVERVIEW
TABLE 97. Ge Healthcare.: STRATEGIC SNAPSHOT
TABLE 98. Ge Healthcare.: BUSINESS OPPORTUNITIES AND OUTLOOK
TABLE 99. Ge Healthcare.: FUNCTION/SERVICE PORTFOLIO
TABLE 100. ECLINICALWORKS: OVERVIEW
TABLE 101. ECLINICALWORKS: STRATEGIC SNAPSHOT
TABLE 102. ECLINICALWORKS: BUSINESS OPPORTUNITIES AND OUTLOOK
TABLE 103. ECLINICALWORKS: FUNCTION/SERVICE PORTFOLIO
TABLE 104. CONIFER HEALTH SOLUTIONS.: OVERVIEW
TABLE 105. CONIFER HEALTH SOLUTIONS.: STRATEGIC SNAPSHOT
TABLE 106. CONIFER HEALTH SOLUTIONS.: BUSINESS OPPORTUNITIES AND OUTLOOK
TABLE 107. CONIFER HEALTH SOLUTIONS.: FUNCTION/SERVICE PORTFOLIO
TABLE 108. EPIC SYSTEMS.: OVERVIEW
TABLE 109. EPIC SYSTEMS.: STRATEGIC SNAPSHOT
TABLE 110. EPIC SYSTEMS.: BUSINESS OPPORTUNITIES AND OUTLOOK
TABLE 111. EPIC SYSTEMS.: FUNCTION/SERVICE PORTFOLIO
TABLE 112. GEBBS HEALTHCARE SOLUTIONS.: OVERVIEW
TABLE 113. GEBBS HEALTHCARE SOLUTIONS.: STRATEGIC SNAPSHOT
TABLE 114. GEBBS HEALTHCARE SOLUTIONS.: BUSINESS OPPORTUNITIES AND OUTLO
TABLE 115. GEBBS HEALTHCARE SOLUTIONS.: FUNCTION/SERVICE PORTFOLIO
Research Framework
Infoholic Research works on a holistic 360° approach in order to deliver high quality, validated and reliable information in our market reports. The Market estimation and forecasting involves following steps:
- Data Collation (Primary & Secondary)
- In-house Estimation (Based on proprietary data bases and Models)
- Market Triangulation
- Forecasting

Market related information is congregated from both primary and secondary sources.
Primary sources
Involved participants from all global stakeholders such as Solution providers, service providers, Industry associations, thought leaders etc. across levels such as CXOs, VPs and managers. Plus, our in-house industry experts having decades of industry experience contribute their consulting and advisory services.
Secondary sources
Include public sources such as regulatory frameworks, government IT spending, government demographic indicators, industry association statistics, and company publications along with paid sources such as Factiva, OneSource, Bloomberg among others.
![]()


