
Recycled Plastics Market By Type (PET, HDPE, LDPE, PP, PS, PVC, and Others), By Application (Bottles, Films, Fibers, Foams, and Others), and By Geography – Global Drivers, Restraints, Opportunities, Trends, and Forecast up to 2025
- October, 2019
- Domain: Chemicals, Materials & Food - Petrochemicals
- Get Free 10% Customization in this Report
Overview
The boon of plastic turned to bane with the nuisance of irresponsible waste management. While the usage of plastic has increased to more than 300 million tons per year, the recycling of the same, even with dedicated efforts from various stakeholders, has been hovering around 10% of it. Low crude oil prices, resulting in lower virgin polymer prices, have made recycled plastics less attractive. With no significant improvement in waste collection, sorting, and recycling technologies, the market for recycled plastics has faced relative lackluster in the past five years.
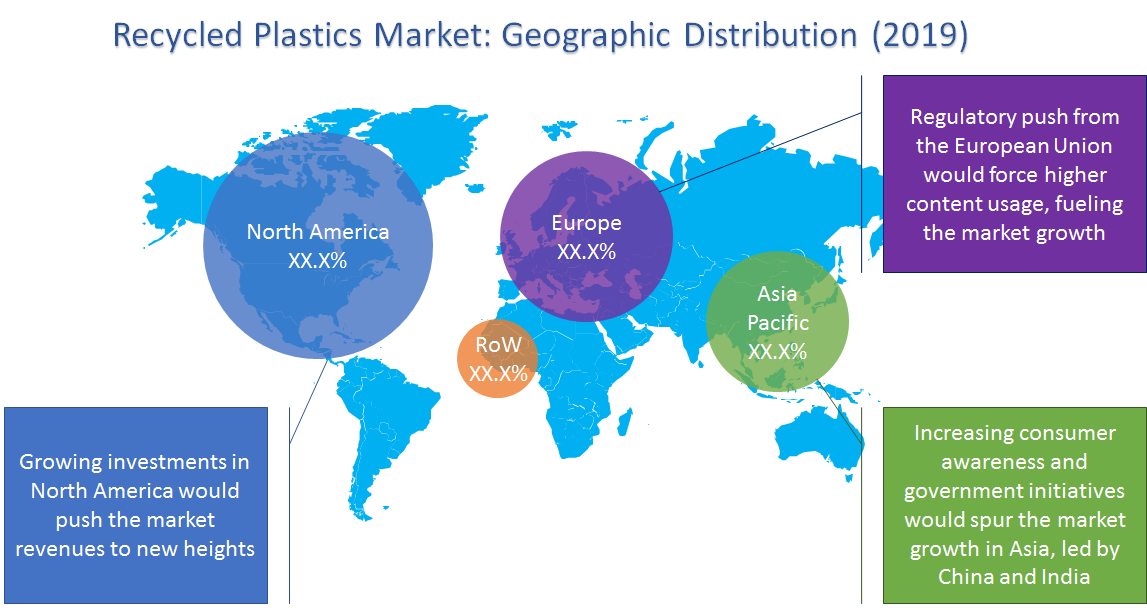
According to Infoholic Research, the global recycled plastics market is expected to grow at a CAGR of 6.8% during the forecast period to reach a value of $66.73 billion by 2025. Regulatory changes by the European Union and China are expected to lead the market growth in the next five years; to be adopted by the US in the later stage. Among applications, bottling is expected to maintain its dominance, while films are expected to witness relatively higher growth.
Research Methodology
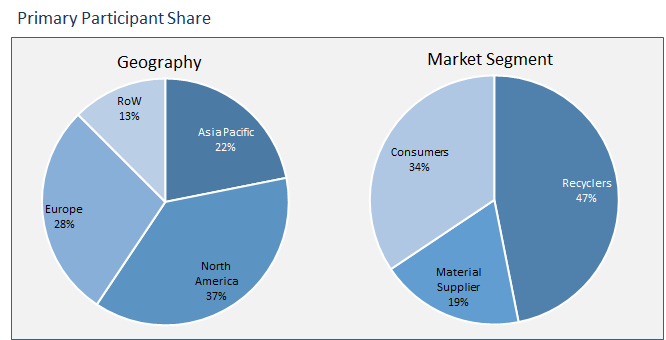
The recycled plastics market has been analyzed by utilizing the optimum combination of secondary sources and in-house methodology, along with an irreplaceable blend of primary insights. The real-time assessment of the market is an integral part of our market sizing and forecasting methodology. Our industry experts and panel of primary participants have helped in compiling relevant aspects with realistic parametric estimations for a comprehensive study. The participation share of different categories of primary participants is given below:
Key Market Insights
Traditionally, the recycled plastic was used in low-value applications wherein contaminated recycled pellets of mixed plastic were used. However, with increased investment in waste collection, sorting, and recycling technologies, it was possible to recycle plastic to near virgin purity, thus opening up the market for high-value applications, competing with virgin polymers. Globally, the US leads the market with the highest per capita consumption and collection of waste plastic, paving the way for the largest recycled plastics market. On the other hand, the Chinese market has been witnessing sweeping changes driven by the regulatory hard hand of banning the contaminated plastic import and forcing the domestic recyclers to either redirect their resources towards domestic waste management or abandon the business. It is too early to comment on the results of such changes; however, the change is directed with the aim of developing environment-friendly image for the Chinese chemical sector. On the third front, the European Union circular economy legislation will push the recycled plastic demand via setting minimum recycled content limits for the plastic packaging industry. The efforts are to create enough demand for recyclers to develop more competitive business opportunities to attract corporates and pushing technological breakthroughs.
Among applications, bottles has been the leading segment with most of the polyethylene terephthalate (PET) moving across the industrial supply chain. The beverage consumer brands, such as Coca-Cola and PepsiCo, have been taking initiatives to coordinate with recyclers via establishing collection & sorting channels along with creating demand for recycled PET. Further, the consumer brands with polypropylene (PP) bottles have also been opening up towards packaged bottles with recycled content, enabling a higher contribution from bottles. Films, the second largest segment, are largely used for secondary packaging applications where they do not come in direct contact with consumables.
The study of the global recycled plastics market provides the market size information and industry trends along with the parameters and factors impacting it in both short- and long-term. The study also covers the competitive scenario of the market with respect to major players with their branding strategies and differentiating factors among others. The study ensures a 360° view, bringing out the complete key insights of the industry. These insights help the business decision-makers to make better business plans and informed decisions for the future business. In addition, the study helps venture capitalists and investment professionals in understanding the companies better and take informed decisions.
The competitive scenario is very fragmented, with a large number of players competing in almost all segments. The real competition of the recyclers is not among each other, but with the virgin polymer producers. Costly waste collection, sorting, and cleaning are the biggest challenges limiting the feedstock availability for plastic recyclers. Increased competitive advantage against virgin plastic is expected to attract more players, creating an opportunity for technological development and overall market growth. Few of the prominent players in the global recycled plastics market are Suez S.A., MBA Polymers, Inc., KW Plastics Recycling, B. Schoenberg & Co., Inc., Waste Management, Inc., Merlin Plastics Supply, Inc., B&B Plastics, and Green Line Polymers among others
Report Scope:
- Types
- Polyethylene Terephthalate (PET)
- High-density Polyethylene (HDPE)
- Low-density Polyethylene (LDPE)
- Polypropylene (PP)
- Polystyrene (PS)
- Polyvinyl Chloride (PVC)
- Others (Polyamide; Linear Low-density Polyethylene; Silicone Rubber, etc.)
- Applications
- Bottles
- Films
- Fibers
- Foams
- Others (Fillers, Construction, etc.)
- Regions
- Asia Pacific
- Europe
- North America
- Middle East & Africa
- Latin America
- Industry outlook: Market trends, drivers, restraints, and opportunities
1 Executive Summary
1.1 Transforming Europe & Emerging Asia to Challenge Leader North America
1.2 Bottles to Remain Preferential Application Segment
2 Market Positioning
2.1 Industry Snapshot
2.1.1 Industry Overview
2.1.2 Key Trends
2.2 Related Markets
3 Market Outlook
3.1 Introduction
3.1.1 Need for Recycling
3.1.2 Industry Dynamics for Plastic Recycling
3.2 Value Chain Analysis
3.3 Market Segmentation
4 Market Characteristics
4.1 PESTLE Analysis
4.2 Porter’s Five Force Analysis
4.3 Market Dynamics
4.3.1 Drivers
4.3.1.1 Changing regulatory requirements globally
4.3.1.2 Growing consumer awareness & changing preferences
4.3.1.3 Technological advancements enabling newer options
4.3.2 Restraints
4.3.2.1 Costlier waste collection and sorting, limiting market growth
4.3.2.2 Technical limitations limiting the cost-effective production for high-value applications
4.3.3 Opportunities
4.3.3.1 Changing policies enabling higher potential market
4.3.3.2 Ballooning R&D investment with the entry of cash-rich companies
4.3.4 DRO – Impact Analysis
4.4 Patent Analysis
5 Recycled Plastics Market, By Type
5.1 Overview
5.2 Recycled Polyethylene Terephthalate (PET)
5.3 Recycled High-density Polyethylene
5.4 Recycled Low-density Polyethylene
5.5 Recycled Polypropylene
5.6 Recycled Polystyrene
5.7 Recycled Polyvinyl Chloride
6 Recycled Plastics Market, By Application
6.1 Overview
6.2 Bottles
6.3 Films
6.4 Fibers
6.5 Foams
7 Recycled Plastics Market, By Geography
7.1 Overview
7.2 Asia Pacific
7.2.1 Asia Pacific Recycled Plastics Market, By Country
7.2.2 Asia Pacific Recycled Plastics Market, By Type
7.2.3 Asia Pacific Recycled Plastics Market, By Applications
7.3 North America
7.3.1 North America Recycled Plastics Market, By Country
7.3.2 North America Recycled Plastics Market, By Type
7.3.3 North America Recycled Plastics Market, By Applications
7.4 Europe
7.4.1 Europe Recycled Plastics Market, By Country
7.4.2 Europe Recycled Plastics Market, By Type
7.4.3 Europe Recycled Plastics Market, By Applications
7.5 Middle East & Africa
7.5.1 Middle East & Africa Recycled Plastics Market, By Country
7.5.2 Middle East & Africa Recycled Plastics Market, By Type
7.5.3 Middle East & Africa Recycled Plastics Market, By Applications
7.6 Latin America
7.6.1 Latin America Recycled Plastics Market, By Country
7.6.2 Latin America Recycled Plastics Market, By Type
7.6.3 Latin America Recycled Plastics Market, By Applications
8 Competitive Landscape
8.1 Competitive Regional Exposure Analysis
8.2 Comparative SWOT Analysis
9 Vendors Profile
9.1 MBA Polymers
9.1.1 Analyst Opinion
9.1.2 Business Analysis
9.1.2.1 Strategic snapshot
9.1.2.2 Business impact analysis
9.1.2.3 Product/service portfolio
9.2 SUEZ Environment S.A.
9.2.1 Analyst Opinion
9.2.2 Business Analysis
9.2.2.1 Strategic snapshot
9.2.2.2 Business impact analysis
9.2.2.3 Product/service portfolio
9.3 KW Plastics Recycling
9.3.1 Analyst Opinion
9.3.2 Business Analysis
9.3.2.1 Strategic snapshot
9.3.2.2 Business impact analysis
9.3.2.3 Product/service portfolio
9.4 B. Schoenberg & Co. Inc.
9.4.1 Analyst Opinion
9.4.2 Business Analysis
9.4.2.1 Strategic snapshot
9.4.2.2 Business impact analysis
9.4.2.3 Product/service portfolio
9.5 Waste Management, Inc.
9.5.1 Analyst Opinion
9.5.2 Business Analysis
9.5.2.1 Strategic snapshot
9.5.2.2 Business impact analysis
9.5.2.3 Product/service portfolio
9.6 Merlin Plastics Supply Inc.
9.6.1 Analyst Opinion
9.6.2 Business Analysis
9.6.2.1 Strategic snapshot
9.6.2.2 Business impact analysis
9.6.2.3 Product/service portfolio
9.7 B&B Plastics
9.7.1 Analyst Opinion
9.7.2 Business Analysis
9.7.2.1 Strategic snapshot
9.7.2.2 Business impact analysis
9.7.2.3 Product/service portfolio
9.8 Green Line Polymers
9.8.1 Analyst Opinion
9.8.2 Business Analysis
9.8.2.1 Strategic snapshot
9.8.2.2 Business impact analysis
9.8.2.3 Product/service portfolio
9.9 Clean Tech Inc.
9.9.1 Analyst Opinion
9.9.2 Business Analysis
9.9.2.1 Strategic snapshot
9.9.2.2 Business impact analysis
9.9.2.3 Product/service portfolio
9.10 Custom Polymers Inc.
9.10.1 Analyst Opinion
9.10.2 Business Analysis
9.10.2.1 Strategic snapshot
9.10.2.2 Business impact analysis
9.10.2.3 Product/service portfolio
9.11 Greenpath Recovery Inc.
9.11.1 Analyst Opinion
9.11.2 Business Analysis
9.11.2.1 Strategic snapshot
9.11.2.2 Business impact analysis
9.11.2.3 Product/service portfolio
10 Companies to Watch for
10.1 China Forestry Group Corporation
10.1.1 Overview
10.1.2 Strategic Partnerships and Recycled PP with Virgin-like Properties, Opening New Dimensions
11 Annexure
11.1 Report Scope
11.2 Market Definition
11.3 Research Methodology
11.3.1 Data Collation & In-house Estimation
11.3.2 Market Triangulation
11.3.3 Forecasting
11.4 Study Declarations
11.5 Report Assumptions
11.6 Stakeholders
11.7 Abbreviations
TABLE 1 GLOBAL RECYCLED PLASTICS MARKET VALUE, BY TYPE, 2018–2025 ($MILLION)
TABLE 2 GLOBAL RECYCLED PLASTICS MARKET VOLUME, BY TYPE, 2018–2025 (KILOTONS)
TABLE 3 GLOBAL RECYCLED POLYETHYLENE TEREPHTHALATE MARKET VALUE, BY GEOGRAPHY, 2018–2025 ($MILLION)
TABLE 4 GLOBAL RECYCLED POLYETHYLENE TEREPHTHALATE MARKET VOLUME, BY GEOGRAPHY, 2018–2025 (KILOTONS)
TABLE 5 GLOBAL RECYCLED HIGH-DENSITY POLYETHYLENE MARKET VALUE, BY GEOGRAPHY, 2018–2025 ($MILLION)
TABLE 6 GLOBAL RECYCLED HIGH-DENSITY POLYETHYLENE MARKET VOLUME, BY GEOGRAPHY, 2018–2025 (KILOTONS)
TABLE 7 GLOBAL RECYCLED LOW-DENSITY POLYETHYLENE MARKET VALUE, BY GEOGRAPHY, 2018–2025 ($MILLION)
TABLE 8 GLOBAL RECYCLED LOW-DENSITY POLYETHYLENE MARKET VOLUME, BY GEOGRAPHY, 2018–2025 (KILOTONS)
TABLE 9 GLOBAL RECYCLED POLYPROPYLENE MARKET VALUE, BY GEOGRAPHY, 2018–2025 ($MILLION)
TABLE 10 GLOBAL RECYCLED POLYPROPYLENE MARKET VOLUME, BY GEOGRAPHY, 2018–2025 (KILOTONS)
TABLE 11 GLOBAL RECYCLED POLYSTYRENE MARKET VALUE, BY GEOGRAPHY, 2018–2025 ($MILLION)
TABLE 12 GLOBAL RECYCLED POLYSTYRENE MARKET VOLUME, BY GEOGRAPHY, 2018–2025 (KILOTONS)
TABLE 13 GLOBAL RECYCLED POLYVINYL CHLORIDE MARKET VALUE, BY GEOGRAPHY, 2018–2025 ($MILLION)
TABLE 14 GLOBAL RECYCLED POLYVINYL CHLORIDE MARKET VOLUME, BY GEOGRAPHY, 2018–2025 (KILOTONS)
TABLE 15 GLOBAL RECYCLED PLASTICS MARKET VALUE, BY APPLICATION, 2018–2025 ($MILLION)
TABLE 16 GLOBAL RECYCLED PLASTICS MARKET VOLUME, BY APPLICATION, 2018–2025 (KILOTONS)
TABLE 17 GLOBAL RECYCLED PLASTICS FOR BOTTLES MARKET VALUE, BY GEOGRAPHY, 2018–2025 ($MILLION)
TABLE 18 GLOBAL RECYCLED PLASTICS FOR BOTTLES MARKET VOLUME, BY GEOGRAPHY, 2018–2025 (KILOTONS)
TABLE 19 GLOBAL RECYCLED PLASTICS MARKET FOR FILMS MARKET VALUE, BY GEOGRAPHY, 2018–2025 ($MILLION)
TABLE 20 GLOBAL RECYCLED PLASTICS MARKET FOR FILMS MARKET VOLUME, BY GEOGRAPHY, 2018–2025 (KILOTONS)
TABLE 21 GLOBAL RECYCLED PLASTICS FOR FIBERS MARKET VALUE, BY GEOGRAPHY, 2018–2025 ($MILLION)
TABLE 22 GLOBAL RECYCLED PLASTICS FOR FIBERS MARKET VOLUME, BY GEOGRAPHY, 2018–2025 (KILOTONS)
TABLE 23 GLOBAL RECYCLED PLASTICS FOR FOAMS MARKET VALUE, BY GEOGRAPHY, 2018–2025 ($MILLION)
TABLE 24 GLOBAL RECYCLED PLASTICS FOR FOAMS MARKET VOLUME, BY GEOGRAPHY, 2018–2025 (KILOTONS)
TABLE 25 GLOBAL RECYCLED PLASTICS MARKET VALUE, BY GEOGRAPHY, 2018–2025 ($MILLION)
TABLE 26 GLOBAL RECYCLED PLASTICS MARKET VOLUME, BY GEOGRAPHY, 2018–2025 (KILOTONS)
TABLE 27 ASIA PACIFIC RECYCLED PLASTICS MARKET VALUE, BY GEOGRAPHY, 2018–2025 ($MILLION)
TABLE 28 ASIA PACIFIC RECYCLED PLASTICS MARKET VOLUME, BY GEOGRAPHY, 2018–2025 (KILOTONS)
TABLE 29 ASIA PACIFIC RECYCLED PLASTICS MARKET VALUE, BY TYPE, 2018–2025 ($MILLION)
TABLE 30 ASIA PACIFIC RECYCLED PLASTICS MARKET VOLUME, BY TYPE, 2018–2025 (KILOTONS)
TABLE 31 ASIA PACIFIC RECYCLED PLASTICS MARKET VALUE, BY APPLICATION, 2018–2025 ($MILLION)
TABLE 32 ASIA PACIFIC RECYCLED PLASTICS MARKET VOLUME, BY APPLICATION, 2018–2025 (KILOTONS)
TABLE 33 NORTH AMERICA RECYCLED PLASTICS MARKET VALUE, BY GEOGRAPHY, 2018–2025 ($MILLION)
TABLE 34 NORTH AMERICA RECYCLED PLASTICS MARKET VOLUME, BY GEOGRAPHY, 2018–2025 (KILOTONS)
TABLE 35 NORTH AMERICA RECYCLED PLASTICS MARKET VALUE, BY TYPE, 2018–2025 ($MILLION)
TABLE 36 NORTH AMERICA RECYCLED PLASTICS MARKET VOLUME, BY TYPE, 2018–2025 (KILOTONS)
TABLE 37 NORTH AMERICA RECYCLED PLASTICS MARKET VALUE, BY APPLICATION, 2018–2025 ($MILLION)
TABLE 38 NORTH AMERICA RECYCLED PLASTICS MARKET VOLUME, BY APPLICATION, 2018–2025 (KILOTONS)
TABLE 39 EUROPE RECYCLED PLASTICS MARKET VALUE, BY GEOGRAPHY, 2018–2025 ($MILLION)
TABLE 40 EUROPE RECYCLED PLASTICS MARKET VOLUME, BY GEOGRAPHY, 2018–2025 (KILOTONS)
TABLE 41 EUROPE RECYCLED PLASTICS MARKET VALUE, BY TYPE, 2018–2025 ($MILLION)
TABLE 42 EUROPE RECYCLED PLASTICS MARKET VOLUME, BY TYPE, 2018–2025 (KILOTONS)
TABLE 43 EUROPE RECYCLED PLASTICS MARKET VALUE, BY APPLICATION, 2018–2025 ($MILLION)
TABLE 44 EUROPE RECYCLED PLASTICS MARKET VOLUME, BY APPLICATION, 2018–2025 (KILOTONS)
TABLE 45 MIDDLE EAST & AFRICA RECYCLED PLASTICS MARKET VALUE, BY GEOGRAPHY, 2018–2025 ($MILLION)
TABLE 46 MIDDLE EAST & AFRICA RECYCLED PLASTICS MARKET VOLUME, BY GEOGRAPHY, 2018–2025 (KILOTONS)
TABLE 47 MIDDLE EAST & AFRICA RECYCLED PLASTICS MARKET VALUE, BY TYPE, 2018–2025 ($MILLION)
TABLE 48 MIDDLE EAST & AFRICA RECYCLED PLASTICS MARKET VOLUME, BY TYPE, 2018–2025 (KILOTONS)
TABLE 49 MIDDLE EAST & AFRICA RECYCLED PLASTICS MARKET VALUE, BY APPLICATIONS, 2018–2025 ($MILLION)
TABLE 50 MIDDLE EAST & AFRICA RECYCLED PLASTICS MARKET VOLUME, BY APPLICATIONS, 2018–2025 (KILOTONS)
TABLE 51 LATIN AMERICA RECYCLED PLASTICS MARKET VALUE, BY GEOGRAPHY, 2018–2025 ($MILLION)
TABLE 52 LATIN AMERICA RECYCLED PLASTICS MARKET VOLUME, BY GEOGRAPHY, 2018–2025 (KILOTONS)
TABLE 53 LATIN AMERICA RECYCLED PLASTICS MARKET VALUE, BY TYPE, 2018–2025 ($MILLION)
TABLE 54 LATIN AMERICA RECYCLED PLASTICS MARKET VOLUME, BY TYPE, 2018–2025 (KILOTONS)
TABLE 55 LATIN AMERICA RECYCLED PLASTICS MARKET VALUE, BY APPLICATION, 2018–2025 ($MILLION)
TABLE 56 LATIN AMERICA RECYCLED PLASTICS MARKET VOLUME, BY APPLICATION, 2018–2025 (KILOTONS)
TABLE 57 CORPORATE RESTRUCTURING & DIVESTMENTS, 2014–2020
TABLE 58 EXPANSION & ACQUISITION, 2014–2020
TABLE 59 LINEAR INTEGRATION, 2014–2020
TABLE 60 PRODUCT LAUNCH, 2014–2020
TABLE 61 RESEARCH & DEVELOPMENT, 2014–2020
TABLE 62 MBA POLYMERS: OVERVIEW
TABLE 63 MBA POLYMERS: STRATEGIC SNAPSHOT
TABLE 64 MBA POLYMERS: BUSINESS OPPORTUNITIES AND OUTLOOK
TABLE 65 MBA POLYMERS: PRODUCT/SERVICE PORTFOLIO
TABLE 66 SUEZ ENVIRONMENT: OVERVIEW
TABLE 67 SUEZ ENVIRONMENT: STRATEGIC SNAPSHOT
TABLE 68 SUEZ ENVIRONMENT: BUSINESS OPPORTUNITIES AND OUTLOOK
TABLE 69 SUEZ ENVIRONMENT: PRODUCT/SERVICE PORTFOLIO
TABLE 70 KW PLASTICS RECYCLING: OVERVIEW
TABLE 71 KW PLASTICS RECYCLING: STRATEGIC SNAPSHOT
TABLE 72 KW PLASTICS RECYCLING: BUSINESS OPPORTUNITIES AND OUTLOOK
TABLE 73 KW PLASTICS RECYCLING: PRODUCT/SERVICE PORTFOLIO
TABLE 74 B. SCHOENBERG & CO. INC.: OVERVIEW
TABLE 75 B. SCHOENBERG & CO. INC.: STRATEGIC SNAPSHOT
TABLE 76 B. SCHOENBERG & CO. INC.: BUSINESS OPPORTUNITIES AND OUTLOOK
TABLE 77 B. SCHOENBERG & CO. INC.: PRODUCT/SERVICE PORTFOLIO
TABLE 78 WASTE MANAGEMENT INC.: OVERVIEW
TABLE 79 WASTE MANAGEMENT INC.: STRATEGIC SNAPSHOT
TABLE 80 WASTE MANAGEMENT INC.: BUSINESS OPPORTUNITIES AND OUTLOOK
TABLE 81 WASTE MANAGEMENT INC.: PRODUCT/SERVICE PORTFOLIO
TABLE 82 MERLIN PLASTICS SUPPLY INC.: OVERVIEW
TABLE 83 MERLIN PLASTICS SUPPLY INC.: STRATEGIC SNAPSHOT
TABLE 84 MERLIN PLASTICS SUPPLY INC.: BUSINESS OPPORTUNITIES AND OUTLOOK
TABLE 85 MERLIN PLASTICS SUPPLY INC.: PRODUCT/SERVICE PORTFOLIO
TABLE 86 B&B PLASTICS: OVERVIEW
TABLE 87 B&B PLASTICS: STRATEGIC SNAPSHOT
TABLE 88 B&B PLASTICS: BUSINESS OPPORTUNITIES AND OUTLOOK
TABLE 89 B&B PLASTICS: PRODUCT/SERVICE PORTFOLIO
TABLE 90 GREEN LINE POLYMERS: OVERVIEW
TABLE 91 GREEN LINE POLYMERS: STRATEGIC SNAPSHOT
TABLE 92 GREEN LINE POLYMERS: BUSINESS OPPORTUNITIES AND OUTLOOK
TABLE 93 GREEN LINE POLYMERS: PRODUCT/SERVICE PORTFOLIO
TABLE 94 CLEAN TECH INC.: OVERVIEW
TABLE 95 CLEAN TECH INC.: STRATEGIC SNAPSHOT
TABLE 96 CLEAN TECH INC.: BUSINESS OPPORTUNITIES AND OUTLOOK
TABLE 97 CLEAN TECH INC.: PRODUCT/SERVICE PORTFOLIO
TABLE 98 CUSTOM POLYMERS INC.: OVERVIEW
TABLE 99 CUSTOM POLYMERS INC.: STRATEGIC SNAPSHOT
TABLE 100 CUSTOM POLYMERS INC.: BUSINESS OPPORTUNITIES AND OUTLOOK
TABLE 101 CUSTOM POLYMERS INC.: PRODUCT/SERVICE PORTFOLIO
TABLE 102 GREENPATH RECOVERY INC.: OVERVIEW
TABLE 103 GREENPATH RECOVERY INC.: STRATEGIC SNAPSHOT
TABLE 104 GREENPATH RECOVERY INC.: BUSINESS OPPORTUNITIES AND OUTLOOK
TABLE 105 GREENPATH RECOVERY INC.: PRODUCT/SERVICE PORTFOLIO
Research Framework
Infoholic Research works on a holistic 360° approach in order to deliver high quality, validated and reliable information in our market reports. The Market estimation and forecasting involves following steps:
- Data Collation (Primary & Secondary)
- In-house Estimation (Based on proprietary data bases and Models)
- Market Triangulation
- Forecasting

Market related information is congregated from both primary and secondary sources.
Primary sources
Involved participants from all global stakeholders such as Solution providers, service providers, Industry associations, thought leaders etc. across levels such as CXOs, VPs and managers. Plus, our in-house industry experts having decades of industry experience contribute their consulting and advisory services.
Secondary sources
Include public sources such as regulatory frameworks, government IT spending, government demographic indicators, industry association statistics, and company publications along with paid sources such as Factiva, OneSource, Bloomberg among others.
![]()


