
Polymer foam Market By Type (Polyurethane, Polystyrene, PVC, Phenolic, Polyolefin, Melamine and Others) By End Users (Building & Construction, Packaging, Automotive, Furniture and Bedding and others) and By Geography – Global Driver, Restraints, Opportunities, Trends, and Forecast to 2023
- November, 2018
- Domain: Chemicals, Materials & Food - Petrochemicals
- Get Free 10% Customization in this Report
The growing usage of polymer foam in construction and building applications is fostering the market growth of polymer foam. The companies are indulged in R&D activities to innovate and develop new products, which can open new paths of applications.
Research Methodology
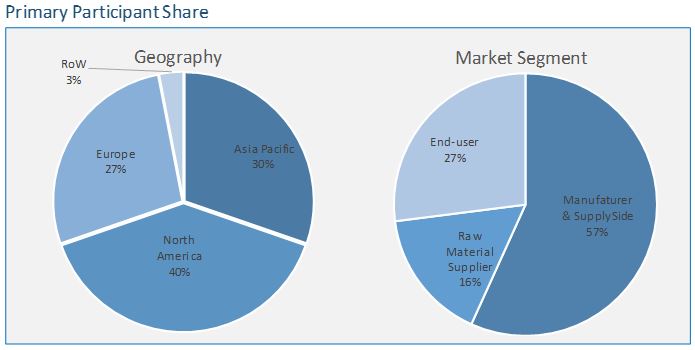
The polymer foam market has been analyzed by utilizing the optimum combination of secondary sources and in-house methodology along with an irreplaceable blend of primary insights. The real-time assessment of the market is an integral part of our market sizing and forecasting methodology. Our industry experts and panel of primary participants have helped in compiling relevant aspects with realistic parametric estimations for a comprehensive study. The participation share of different categories of primary participants is given below:
Key Market Insights
The increasing awareness across the globe, especially in developed regions along with increasing demand from end-user industries is accelerating the growth of polymer foam. On the other hand, growing economies and increasing per capita income along with technological innovations to bring down the prices are making polymer foam more affordable & efficient. The increased innovation and R&D is helping in the expansion of polymer foam application areas providing additional growth opportunities to the market.
Increasing demand for polymer foam from the automotive, packaging, and building and construction industries is driving the polymer foam market globally. The Asia Pacific is dominating the market of polymer foam during the forecast period, followed by North America and Europe. Polymer foam is used in various applications. The growth of the end-user industries is likely to drive the growth of the polymer foam market during the forecast period. The companies working in the manufacturing of polymer foam are actively participating to increase their product ranges along with improvements in supply networks and thus enhancing their positions in the polymer foam market.
Few of the prominent companies operating in the polymer foam market are BASF, LANXESS, Huntsman, DowDuPont, and SABIC. Some of the major customers are FIAT, UFP Technologies, VINCI, Volkswagen Group, and Sika AG.
Types -
- Polyurethane
- Polystyrene
- PVC
- Phenolic
- Polyolefin
- Melamine
- Others
End-users -
- Building and Construction
- Automotive
- Packaging
- Furniture and Bedding
- Others
Geography -
- Asia Pacific
- North America
- Europe
- Rest of the World
1 Executive Summary
1.1 Asia Pacific has the highest dominance in the polymer foam market
1.2 By End user, Building and Construction dominates the market
2 Market Positioning
2.1 Industry Snapshot
2.1.1 Industry Overview
2.1.2 Key Trends
2.2 Related Markets
3 Market Outlook
3.1 Introduction
3.2 Value Chain Analysis
3.3 Market Segmentation
4 Market Characteristics
4.1 PESTLE Analysis
4.2 Porter’s Five Force Analysis
4.3 Market Dynamics
4.3.1 Drivers
4.3.1.1 Growing automotive and packaging industry
4.3.1.2 Increased demand from Asia Pacific
4.3.2 Restraints
4.3.2.1 Increasingly stringent regulations by regulatory bodies
4.3.2.2 Fluctuations in raw material prices
4.3.3 Opportunities
4.3.3.1 Growing end-use industry manufacturers in Asia Pacific
4.3.3.2 Large untapped market in developing and underdeveloped countries
4.3.4 DRO – Impact Analysis
4.4 Patent Analysis
5 Polymer Foam, By Type
5.1 Overview
5.2 Polyurethane Foam
5.3 Polystyrene Foam
5.4 Polyvinyl Chloride (PVC) Foam
5.5 Phenolic Foam
5.6 Polyolefin Foam
5.7 Melamine Foam
6 Polymer Foam, By End Users
6.1 Overview
6.2 Building & Construction
6.3 Automotive
6.4 Packaging
6.5 Furniture & Bedding
7 Polymer Foam, By Geography
7.1 Overview
7.2 Asia Pacific
7.3 North America
7.4 Europe
7.5 Rest of the World
(Market segmentation done by country, by type, by end user)
8 Competitive Landscape
8.1 Competitive Regional Exposure Analysis
8.2 Market Developments
8.2.1 Mergers & Acquisitions (M&A)
8.2.2 Expansions
8.2.3 Product launches
9 Vendor Profiles
9.1 BASF
9.2 Huntsman
9.3 Sabic
9.4 DowDuPont
9.5 Lanxess
9.5.1 Overview
( Includes Overview, Product profile, Business units, Geographic revenue, Recent developments, Business focus, Business strategies)
10 Customers Profile
10.1 Volkswagen Group
10.2 Fiat Chrysler Automobiles N.V. (FCA)
10.3 VINCI
10.4 UFP Technology
10.5 Sika AG
(Includes Overview,Product profile, SWOT Analysis,Business strategies
11 Companies to Watch for
11.1 BASF
12 Annexure
12.1 Report Scope
12.2 Market Definition
12.3 Research Methodology
12.3.1 Data Collation & In-house Estimation
12.3.2 Market Triangulation
12.3.3 Forecasting
12.4 Study Declarations
12.5 Report Assumptions
12.6 Stakeholders
12.7 Abbreviations
TABLE 1 GLOBAL POLYMER FOAM MARKET VALUE, BY TYPE, 2016–2023 ($MILLION)
TABLE 2 GLOBAL POLYMER FOAM MARKET VOLUME, BY TYPE, 2016–2023 (KILOTONS)
TABLE 3 GLOBAL POLYURETHANE FOAM MARKET VALUE, BY GEOGRAPHY, 2016–2023 ($MILLION)
TABLE 4 GLOBAL POLYURETHANE FOAM MARKET VOLUME, BY GEOGRAPHY, 2016–2023 (KILOTONS)
TABLE 5 GLOBAL POLYSTYRENE FOAM MARKET VALUE, BY GEOGRAPHY, 2016–2023 ($MILLION)
TABLE 6 GLOBAL POLYSTYRENE FOAM MARKET VOLUME, BY GEOGRAPHY, 2016–2023 (KILOTONS)
TABLE 7 GLOBAL PVC FOAM MARKET VALUE, BY GEOGRAPHY, 2016–2023 ($MILLION)
TABLE 8 GLOBAL PVC FOAM MARKET VOLUME, BY GEOGRAPHY, 2016–2023 (KILOTONS)
TABLE 9 GLOBAL PHENOLIC FOAM MARKET VALUE, BY GEOGRAPHY, 2016–2023 ($MILLION)
TABLE 10 GLOBAL PHENOLIC FOAM IN POLYMER FOAM MARKET VOLUME, BY GEOGRAPHY, 2016–2023 (KILOTONS)
TABLE 11 GLOBAL POLYOLEFIN FOAM MARKET VALUE, BY GEOGRAPHY, 2016–2023 ($MILLION)
TABLE 12 GLOBAL POLYOLEFIN FOAM IN POLYMER FOAM MARKET VOLUME, BY GEOGRAPHY, 2016–2023 (KILOTONS)
TABLE 13 GLOBAL MELAMINE FOAM MARKET VALUE, BY GEOGRAPHY, 2016–2023 ($MILLION)
TABLE 14 GLOBAL MELAMINE FOAM POLYMER FOAM MARKET VOLUME, BY GEOGRAPHY, 2016–2023 (KILOTONS)
TABLE 15 GLOBAL POLYMER FOAM VALUE, BY END USERS, 2016–2023 ($MILLION)
TABLE 16 GLOBAL POLYMER FOAM MARKET VOLUME, BY END USERS, 2016–2023 (KILOTONS)
TABLE 17 GLOBAL POLYMER FOAM IN BUILDING & CONSTRUCTION MARKET VALUE, BY GEOGRAPHY, 2016–2023 ($MILLION)
TABLE 18 GLOBAL POLYMER FOAM IN BUILDING & CONSTRUCTION MARKET VOLUME, BY GEOGRAPHY, 2016–2023 (KILOTONS)
TABLE 19 GLOBAL POLYMER FOAM IN AUTOMOTIVE MARKET VALUE, BY GEOGRAPHY, 2016–2023 ($MILLION)
TABLE 20 GLOBAL POLYMER FOAM IN AUTOMOTIVE MARKET VOLUME, BY GEOGRAPHY, 2016–2023 (KILOTONS)
TABLE 21 GLOBAL POLYMER FOAM IN PACKAGING MARKET VALUE, BY GEOGRAPHY, 2016–2023 ($MILLION)
TABLE 22 GLOBAL POLYMER FOAM IN PACKAGING MARKET VOLUME, BY GEOGRAPHY, 2016–2023 (KILOTONS)
TABLE 23 GLOBAL POLYMER FOAM IN FURNITURE & BEDDING MARKET VALUE, BY GEOGRAPHY, 2016–2023 ($MILLION)
TABLE 24 GLOBAL POLYMER FOAM IN FURNITURE & BEDDING MARKET VOLUME, BY GEOGRAPHY, 2016–2023 (KILOTONS)
TABLE 25 GLOBAL POLYMER FOAM MARKET VALUE, BY GEOGRAPHY, 2016–2023 ($MILLION)
TABLE 26 GLOBAL POLYMER FOAM MARKET VOLUME, BY GEOGRAPHY, 2016–2023 (KILOTONS)
TABLE 27 ASIA PACIFIC POLYMER FOAM MARKET VALUE, BY GEOGRAPHY, 2016–2023 ($MILLION)
TABLE 28 ASIA PACIFIC POLYMER FOAM MARKET VOLUME, BY GEOGRAPHY, 2016–2023 (KILOTONS)
TABLE 29 ASIA PACIFIC POLYMER FOAM MARKET VALUE, BY TYPE, 2016–2023 ($MILLION)
TABLE 30 ASIA PACIFIC POLYMER FOAM MARKET VOLUME, BY TYPE, 2016–2023 (KILOTONS)
TABLE 31 ASIA PACIFIC POLYMER FOAM MARKET VALUE, BY END USER, 2016–2023 ($MILLION)
TABLE 32 ASIA PACIFIC POLYMER FOAM MARKET VOLUME, BY END USER, 2016–2023 (KILOTONS)
TABLE 33 NORTH AMERICA POLYMER FOAM MARKET VALUE, BY GEOGRAPHY, 2016–2023 ($MILLION)
TABLE 34 NORTH AMERICA POLYMER FOAM MARKET VOLUME, BY GEOGRAPHY, 2016–2023 (KILOTONS)
TABLE 35 NORTH AMERICA POLYMER FOAM MARKET VALUE, BY TYPE, 2016–2023 ($MILLION)
TABLE 36 NORTH AMERICA POLYMER FOAM MARKET VOLUME, BY TYPE, 2016–2023 (KILOTONS)
TABLE 37 NORTH AMERICA POLYMER FOAM MARKET VALUE, BY END USER, 2016–2023 ($MILLION)
TABLE 38 NORTH AMERICA POLYMER FOAM MARKET VOLUME, BY END USER, 2016–2023 (KILOTONS)
TABLE 39 EUROPE POLYMER FOAM MARKET VALUE, BY GEOGRAPHY, 2016–2023 ($MILLION)
TABLE 40 EUROPE POLYMER FOAM MARKET VOLUME, BY GEOGRAPHY, 2016–2023 (KILOTONS)
TABLE 41 EUROPE POLYMER FOAM MARKET VALUE, BY TYPE, 2016–2023 ($MILLION)
TABLE 42 EUROPE POLYMER FOAM MARKET VOLUME, BY TYPE, 2016–2023 (KILOTONS)
TABLE 43 EUROPE POLYMER FOAM VALUE, BY END USER, 2016–2023 ($MILLION)
TABLE 44 EUROPE POLYMER FOAM MARKET VOLUME, BY END USER, 2016–2023 (KILOTONS)
TABLE 45 REST OF THE WORLD POLYMER FOAM MARKET VALUE, BY GEOGRAPHY, 2016–2023 ($MILLION)
TABLE 46 REST OF THE WORLD POLYMER FOAM MARKET VOLUME, BY GEOGRAPHY, 2016–2023 (KILOTONS)
TABLE 47 REST OF THE WORLD POLYMER FOAM MARKET VALUE, BY TYPE, 2016–2023 ($MILLION)
TABLE 48 REST OF THE WORLD POLYMER FOAM MARKET VOLUME, BY TYPE, 2016–2023 (KILOTONS)
TABLE 49 REST OF THE WORLD POLYMER FOAM MARKET VALUE, BY NED USER, 2016–2023 ($MILLION)
TABLE 50 REST OF THE WORLD POLYMER FOAM MARKET VOLUME, BY END USER, 2016–2023 (KILOTONS)
TABLE 51 MERGER & ACQUISITION, 2013–2017
TABLE 52 EXPANSIONS, 2013–2017
TABLE 53 PRODUCT LAUNCHES, 2013–2017
TABLE 54 BASF: PRODUCT PROFILE
TABLE 55 HUNTSMAN: PRODUCT PROFILE
TABLE 56 SABIC: PRODUCT PROFILE
TABLE 57 DOWDUPONT: PRODUCT PROFILE
TABLE 58 LANXESS: PRODUCT PROFILE
TABLE 59 LANXESS: RECENT DEVELOPMENTS
TABLE 60 VOLKSWAGEN GROUP: PRODUCT PROFILE
TABLE 61 FIAT CHRYSLER AUTOMOBILES N.V. (FCA): SUBSIDIARIES
TABLE 62 VINCI: BUSINESS SEGMENTS
TABLE 63 UPF TEHNOLOGY: PRODUCT PROFILE
TABLE 64 SIKA AG: PRODUCT PROFILE
TABLE 65 BASF: PRODUCT PROFILE
Research Framework
Infoholic Research works on a holistic 360° approach in order to deliver high quality, validated and reliable information in our market reports. The Market estimation and forecasting involves following steps:
- Data Collation (Primary & Secondary)
- In-house Estimation (Based on proprietary data bases and Models)
- Market Triangulation
- Forecasting

Market related information is congregated from both primary and secondary sources.
Primary sources
Involved participants from all global stakeholders such as Solution providers, service providers, Industry associations, thought leaders etc. across levels such as CXOs, VPs and managers. Plus, our in-house industry experts having decades of industry experience contribute their consulting and advisory services.
Secondary sources
Include public sources such as regulatory frameworks, government IT spending, government demographic indicators, industry association statistics, and company publications along with paid sources such as Factiva, OneSource, Bloomberg among others.
![]()


