
Plasma Fractionation Market by Product, Application (Hematology, Immunology, Neurology, Critical care, Pulmonology, Hemato-oncology, Rheumatology, and Other Applications), End-User, and Geography – Global Forecast up to 2026
- March, 2021
- Domain: Healthcare - Health and Hygiene
- Get Free 10% Customization in this Report
Fractionation is a procedure referred to as the segregation of a certain quantity of a mixture. Moreover, plasma is the fluid element of blood, separated to attain different plasma derivatives, including albumin and immunoglobulins. These obtained plasma products have remedial effects and are used to treat several disorders associated with blood plasma. The rising population of older people worldwide is resulting in several rare diseases that needed plasma derivatives, which is the key aspect that fuels the plasma fractionation market growth. Moreover, an increase in the usage of immunoglobulins and alpha-1-antitrypsin in medical fields worldwide also drives the plasma fractionation market's development. But somehow, enormous costs and minimum reimbursements in this field are likely to hamper the plasma fractionation market growth. The Plasma Fractionation Market will grow at the rate of 6.8% CAGR by 2026.
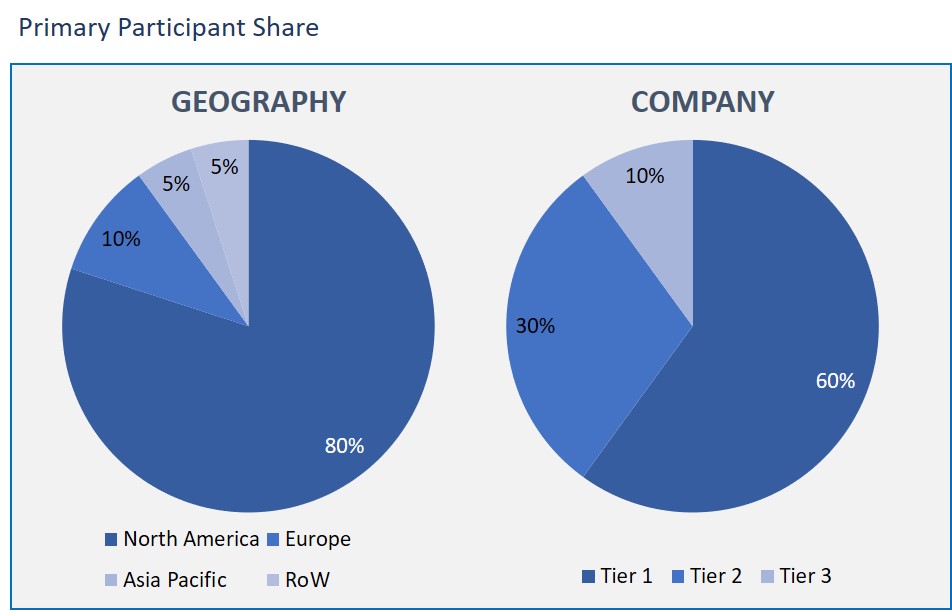
Research Methodology:
The Plasma Fractionation market has been analyzed by utilizing the optimum combination of secondary sources and in-house methodology and a unique balance of primary insights. The real-time valuation of the market is an integral part of our forecasting and market sizing methodology. Industry experts and our primary participants have helped to compile related aspects with accurate parametric estimations for a complete study. The primary participants share is given below:
Plasma Fractionation Market by Product
- Immunoglobulins
- Intravenous Immunoglobulins
- Subcutaneous Immunoglobulins
- Other Immunoglobulins
- Coagulation Factor Concentrates
- Factor VIII
- Factor IX
- Von Willebrand Factor
- Prothrombin Complex Concentrate
- Fibrinogen Concentrates
- Factor XIII
- Albumin
- Protease Inhibitors
- Other Products
Plasma Fractionation Market by Application
- Hematology
- Immunology
- Neurology
- Critical care
- Pulmonology
- Hemato-oncology
- Rheumatology
- Other Applications
Plasma Fractionation Market by End User
- Hospitals & Clinics
- Clinical Research Laboratories
- Academic Institutes
Plasma Fractionation Market by Geography
- North America
- Europe
- Asia Pacific
- Rest of the World
Based on the product, the immunoglobulins segment is happening to hold a significant share in the plasma fractionation market. This segment growth is ascribed to immunoglobulins' different uses in several disorders, including primary and secondary immune deficiencies and inflammatory diseases. Globally, an increase in the R&D associated with immunology is another factor boosting the demand for immunoglobulins.
In terms of application, the plasma fractionation applications consist of hematology, immunology, neurology, critical care, pulmonology, hemato-oncology, rheumatology, and other applications. The neurology segment is registered the maximum share in the market due to intravenous immunoglobulin in less time than steroids and its efficacy on several peripheral and central nervous system disorders.
The plasma fractionation market's end-users are hospitals and clinics, clinical research laboratories, and academic institutes. The significant end-users of plasma fractionation are hospitals and clinics. Hospitals require plasma products to treat acute diseases, and the increasing number of patients in hospitals is the reason for fueling the demand for plasma fractionation.
The North American region is leading the plasma fractionation market share during the forecast period. This is due to well-developed healthcare facilities, beneficial government regulations, and rising research and development in plasma fractionation are the factors responsible for the enormous expansion of the market in this region.
Immunoglobulins are employed as the primary remedy for several neurologic, immunologic and hematologic conditions. The most usual immunoglobulin therapy usage is to treat primary immune deficiencies and chronic inflammatory demyelinating polyradiculoneuropathy (CIDP). The diagnosis percentage of several immunological diseases has increased over the past few years due to technological advancements. Besides, globally increasing genetic research for identifying and diagnosing immunodeficiency will surge in the clinical requirement for immunoglobulins, increasing the global plasma fractionation market growth.
The profiles of companies leading the plasma fractionation market include Bharat Serums and Vaccines Limited, Shanghai RAAS Blood Products, Japan Blood Products Organization, Green Cross Corporation, Grifols, Shire, Octapharma, LFB, Biotest, CSL, Sanquin, China Biologic Products, Bio Products Laboratory, Kedrion, Emergent BioSolutions and Intas Biopharmaceuticals.
As a result, plasma fractionation is a vital class of remedies often utilized as the only choice available to prevent, manage, and treat fatal health conditions such as trauma, hereditary deficiencies, immunologic disorders, or infections.
- This report delivers a comprehensive analysis of the plasma fractionation market growth drivers, restraints, opportunities, and other related challenges.
- This report depicts the market developments such as new product launches, mergers and acquisitions, diversification, and joint ventures of the market players.
- This report also describes all potential segments and sub-segments present in the market to help the companies in strategic business planning.
This report also gives the regional analysis of the plasma fractionation market in terms of market penetration across the world.
- Executive Summary
- Industry Outlook
- Industry Overview
- Industry Trends
- Market Snapshot
- Market Definition
- Market Outlook
- PEST Analysis
- Porter Five Forces
- Related Markets
- Market characteristics
- Market Evolution
- Market Trends and Impact
- Advantages/Disadvantages of Market
- Regulatory Impact
- Market Offerings
- Market Segmentation
- Market Dynamics
- Drivers
- Restraints
- Opportunities
- DRO - Impact Analysis
- Product: Market Size & Analysis
- Overview
- Immunoglobulins
- Intravenous Immunoglobulins
- Subcutaneous Immunoglobulins
- Other Immunoglobulins
- Coagulation Factor Concentrates
- Factor VIII
- Factor IX
- Von Willebrand Factor
- Prothrombin Complex Concentrate
- Fibrinogen Concentrates
- Factor XIII
- Albumin
- Protease Inhibitors
- Other Products
- Application: Market Size & Analysis
- Overview
- Hematology
- Immunology
- Neurology
- Critical care
- Pulmonology
- Hemato-oncology
- Rheumatology
- Other Applications
- End-User: Market Size & Analysis
- Overview
- Hospitals & Clinics
- Clinical Research Laboratories
- Academic Institutes
- Geography: Market Size & Analysis
- Overview
- North America
- Europe
- Asia Pacific
- Rest of the World
- Competitive Landscape
- Competitor Comparison Analysis
- Market Developments
- Mergers and Acquisitions, Legal, Awards, Partnerships
- Product Launches and execution
- Vendor Profiles
- Bharat Serums and Vaccines Limited
- Overview
- Financial Overview
- Product Offerings
- Developments
- Business Strategy
- Shanghai RAAS Blood Products
- Overview
- Financial Overview
- Product Offerings
- Developments
- Business Strategy
- Japan Blood Products Organization
- Overview
- Financial Overview
- Product Offerings
- Developments
- Business Strategy
- Green Cross Corporation
- Overview
- Financial Overview
- Product Offerings
- Developments
- Business Strategy
- Grifols
- Overview
- Financial Overview
- Product Offerings
- Developments
- Business Strategy
- Shire
- Overview
- Financial Overview
- Product Offerings
- Developments
- Business Strategy
- Octapharma
- Overview
- Financial Overview
- Product Offerings
- Developments
- Business Strategy
- LFB
- Overview
- Financial Overview
- Product Offerings
- Developments
- Business Strategy
- Biotest
- Overview
- Financial Overview
- Product Offerings
- Developments
- Business Strategy
- CSL
- Overview
- Financial Overview
- Product Offerings
- Developments
- Business Strategy
- Bharat Serums and Vaccines Limited
- Companies to Watch
- Sanquin
- Overview
- Market
- Business Strategy
- China Biologic Products
- Overview
- Market
- Business Strategy
- Bio Products Laboratory
- Overview
- Market
- Business Strategy
- Kedrion
- Overview
- Market
- Business Strategy
- Emergent BioSolutions
- Overview
- Market
- Business Strategy
- Intas Biopharmaceuticals
- Overview
- Market
- Business Strategy
- Sanquin
- Analyst Opinion
- Annexure
- Report Scope
- Market Definitions
- Research Methodology
- Data Collation and In-house Estimation
- Market Triangulation
- Forecasting
- Report Assumptions
- Declarations
- Stakeholders
- Abbreviations
TABLE 1. GLOBAL PLASMA FRACTIONATION MARKET VALUE, BY PRODUCT, 2020-2026 (USD BILLION)
TABLE 2. GLOBAL PLASMA FRACTIONATION MARKET VALUE FOR IMMUNOGLOBULINS, BY GEOGRAPHY, 2020-2026 (USD BILLION)
TABLE 3. GLOBAL PLASMA FRACTIONATION MARKET VALUE FOR INTRAVENOUS IMMUNOGLOBULINS, BY GEOGRAPHY, 2020-2026 (USD BILLION)
TABLE 4. GLOBAL PLASMA FRACTIONATION MARKET VALUE FOR SUBCUTANEOUS IMMUNOGLOBULINS, BY GEOGRAPHY, 2020-2026 (USD BILLION)
TABLE 5. GLOBAL PLASMA FRACTIONATION MARKET VALUE FOR OTHER IMMUNOGLOBULINS, BY GEOGRAPHY, 2020-2026 (USD BILLION)
TABLE 6. GLOBAL PLASMA FRACTIONATION MARKET VALUE FOR COAGULATION FACTOR CONCENTRATES, BY GEOGRAPHY, 2020-2026 (USD BILLION)
TABLE 7. GLOBAL PLASMA FRACTIONATION MARKET VALUE FOR FACTOR VIII, BY GEOGRAPHY, 2020-2026 (USD BILLION)
TABLE 8. GLOBAL PLASMA FRACTIONATION MARKET VALUE FOR FACTOR IX, BY GEOGRAPHY, 2020-2026 (USD BILLION)
TABLE 9. GLOBAL PLASMA FRACTIONATION MARKET VALUE FOR VON WILLEBRAND FACTOR, BY GEOGRAPHY, 2020-2026 (USD BILLION)
TABLE 10. GLOBAL PLASMA FRACTIONATION MARKET VALUE FOR PROTHROMBIN COMPLEX CONCENTRATE, BY GEOGRAPHY, 2020-2026 (USD BILLION)
TABLE 11. GLOBAL PLASMA FRACTIONATION MARKET VALUE FOR FIBRINOGEN CONCENTRATES, BY GEOGRAPHY, 2020-2026 (USD BILLION)
TABLE 12. GLOBAL PLASMA FRACTIONATION MARKET VALUE FOR FACTOR XIII, BY GEOGRAPHY, 2020-2026 (USD BILLION)
TABLE 13. GLOBAL PLASMA FRACTIONATION MARKET VALUE FOR ALBUMIN, BY GEOGRAPHY, 2020-2026 (USD BILLION)
TABLE 14. GLOBAL PLASMA FRACTIONATION MARKET VALUE FOR PROTEASE INHIBITORS, BY GEOGRAPHY, 2020-2026 (USD BILLION)
TABLE 15. GLOBAL PLASMA FRACTIONATION MARKET VALUE FOR OTHER PRODUCTS, BY GEOGRAPHY, 2020-2026 (USD BILLION)
TABLE 16. GLOBAL PLASMA FRACTIONATION MARKET VALUE, BY APPLICATION, 2020-2026 (USD BILLION)
TABLE 17. GLOBAL PLASMA FRACTIONATION MARKET VALUE FOR HEMATOLOGY, BY GEOGRAPHY, 2020-2026 (USD BILLION)
TABLE 18. GLOBAL PLASMA FRACTIONATION MARKET VALUE FOR IMMUNOLOGY, BY GEOGRAPHY, 2020-2026 (USD BILLION)
TABLE 19. GLOBAL PLASMA FRACTIONATION MARKET VALUE FOR NEUROLOGY, BY GEOGRAPHY, 2020-2026 (USD BILLION)
TABLE 20. GLOBAL PLASMA FRACTIONATION MARKET VALUE FOR CRITICAL CARE, BY GEOGRAPHY, 2020-2026 (USD BILLION)
TABLE 21. GLOBAL PLASMA FRACTIONATION MARKET VALUE FOR PULMONOLOGY, BY GEOGRAPHY, 2020-2026 (USD BILLION)
TABLE 22. GLOBAL PLASMA FRACTIONATION MARKET VALUE FOR HEMATO-ONCOLOGY, BY GEOGRAPHY, 2020-2026 (USD BILLION)
TABLE 23. GLOBAL PLASMA FRACTIONATION MARKET VALUE FOR RHEUMATOLOGY, BY GEOGRAPHY, 2020-2026 (USD BILLION)
TABLE 24. GLOBAL PLASMA FRACTIONATION MARKET VALUE FOR OTHER APPLICATIONS, BY GEOGRAPHY, 2020-2026 (USD BILLION)
TABLE 25. GLOBAL PLASMA FRACTIONATION MARKET VALUE, BY END-USER, 2020-2026 (USD BILLION)
TABLE 26. GLOBAL PLASMA FRACTIONATION MARKET VALUE FOR HOSPITALS & CLINICS, 2020-2026 (USD BILLION)
TABLE 27. GLOBAL PLASMA FRACTIONATION MARKET VALUE FOR CLINICAL RESEARCH LABORATORIES, BY GEOGRAPHY, 2020-2026 (USD BILLION)
TABLE 28. GLOBAL PLASMA FRACTIONATION MARKET VALUE FOR ACADEMIC INSTITUTES, BY GEOGRAPHY, 2020-2026 (USD BILLION)
TABLE 29. NORTH AMERICA PLASMA FRACTIONATION MARKET VALUE, BY COUNTRY, 2020-2026 (USD BILLION)
TABLE 30. NORTH AMERICA PLASMA FRACTIONATION MARKET VALUE, BY PRODUCT, 2020-2026 (USD BILLION)
TABLE 31. NORTH AMERICA PLASMA FRACTIONATION MARKET VALUE, BY APPLICATION, 2020-2026 (USD BILLION)
TABLE 32. NORTH AMERICA PLASMA FRACTIONATION MARKET VALUE, BY END-USER, 2020-2026 (USD BILLION)
TABLE 33. U.S PLASMA FRACTIONATION MARKET VALUE, BY PRODUCT, 2020-2026 (USD BILLION)
TABLE 34. U.S PLASMA FRACTIONATION MARKET VALUE, BY APPLICATION, 2020-2026 (USD BILLION)
TABLE 35. U.S PLASMA FRACTIONATION MARKET VALUE, BY END-USER, 2020-2026 (USD BILLION)
TABLE 36. CANADA PLASMA FRACTIONATION MARKET VALUE, BY PRODUCT, 2020-2026 (USD BILLION)
TABLE 37. CANADA PLASMA FRACTIONATION MARKET VALUE, BY APPLICATION, 2020-2026 (USD BILLION)
TABLE 38. CANADA PLASMA FRACTIONATION MARKET VALUE, BY END-USER, 2020-2026 (USD BILLION)
TABLE 39. EUROPE PLASMA FRACTIONATION MARKET VALUE, BY COUNTRY, 2020-2026 (USD BILLION)
TABLE 40. EUROPE PLASMA FRACTIONATION MARKET VALUE, BY PRODUCT, 2020-2026 (USD BILLION)
TABLE 41. EUROPE PLASMA FRACTIONATION MARKET VALUE, BY APPLICATION, 2020-2026 (USD BILLION)
TABLE 42. EUROPE PLASMA FRACTIONATION MARKET VALUE, END-USER, 2020-2026 (USD BILLION)
TABLE 43. GERMANY PLASMA FRACTIONATION MARKET VALUE, BY PRODUCT, 2020-2026 (USD BILLION)
TABLE 44. GERMANY PLASMA FRACTIONATION MARKET VALUE, BY APPLICATION, 2020-2026 (USD BILLION)
TABLE 45. GERMANY PLASMA FRACTIONATION MARKET VALUE, BY END-USER, 2020-2026 (USD BILLION)
TABLE 46. U.K PLASMA FRACTIONATION MARKET VALUE, BY PRODUCT, 2020-2026 (USD BILLION)
TABLE 47. U.K PLASMA FRACTIONATION MARKET VALUE, BY APPLICATION, 2020-2026 (USD BILLION)
TABLE 48. U.K PLASMA FRACTIONATION MARKET VALUE, BY END-USER, 2020-2026 (USD BILLION)
TABLE 49. FRANCE PLASMA FRACTIONATION MARKET VALUE, BY PRODUCT, 2020-2026 (USD BILLION)
TABLE 50. FRANCE PLASMA FRACTIONATION MARKET VALUE, BY APPLICATION, 2020-2026 (USD BILLION)
TABLE 51. FRANCE PLASMA FRACTIONATION MARKET VALUE, BY END-USER, 2020-2026 (USD BILLION)
TABLE 52. ITALY PLASMA FRACTIONATION MARKET VALUE, BY PRODUCT, 2020-2026 (USD BILLION)
TABLE 53. ITALY PLASMA FRACTIONATION MARKET VALUE, BY APPLICATION, 2020-2026 (USD BILLION)
TABLE 54. ITALY PLASMA FRACTIONATION MARKET VALUE, BY END-USER, 2020-2026 (USD BILLION)
TABLE 55. SPAIN PLASMA FRACTIONATION MARKET VALUE, BY PRODUCT, 2020-2026 (USD BILLION)
TABLE 56. SPAIN PLASMA FRACTIONATION MARKET VALUE, BY APPLICATION, 2020-2026 (USD BILLION)
TABLE 57. SPAIN PLASMA FRACTIONATION MARKET VALUE, BY END-USER, 2020-2026 (USD BILLION)
TABLE 58. ROE PLASMA FRACTIONATION MARKET VALUE, BY PRODUCT, 2020-2026 (USD BILLION)
TABLE 59. ROE PLASMA FRACTIONATION MARKET VALUE, BY APPLICATION, 2020-2026 (USD BILLION)
TABLE 60. ROE PLASMA FRACTIONATION MARKET VALUE, BY END-USER, 2020-2026 (USD BILLION)
TABLE 61. ASIA PACIFIC PLASMA FRACTIONATION MARKET VALUE, BY COUNTRY, 2020-2026 (USD BILLION)
TABLE 62. ASIA PACIFIC PLASMA FRACTIONATION MARKET VALUE, BY PRODUCT, 2020-2026 (USD BILLION)
TABLE 63. ASIA PACIFIC PLASMA FRACTIONATION MARKET VALUE, BY APPLICATION, 2020-2026 (USD BILLION)
TABLE 64. ASIA PACIFIC PLASMA FRACTIONATION MARKET VALUE, BY END-USER, 2020-2026 (USD BILLION)
TABLE 65. CHINA PLASMA FRACTIONATION MARKET VALUE, BY PRODUCT, 2020-2026 (USD BILLION)
TABLE 66. CHINA PLASMA FRACTIONATION MARKET VALUE, BY APPLICATION, 2020-2026 (USD BILLION)
TABLE 67. CHINA PLASMA FRACTIONATION MARKET VALUE, BY END-USER, 2020-2026 (USD BILLION)
TABLE 68. INDIA PLASMA FRACTIONATION MARKET VALUE, BY PRODUCT, 2020-2026 (USD BILLION)
TABLE 69. INDIA PLASMA FRACTIONATION MARKET VALUE, BY APPLICATION, 2020-2026 (USD BILLION)
TABLE 70. INDIA PLASMA FRACTIONATION MARKET VALUE, BY END-USER, 2020-2026 (USD BILLION)
TABLE 71. JAPAN PLASMA FRACTIONATION MARKET VALUE, BY PRODUCT, 2020-2026 (USD BILLION)
TABLE 72. JAPAN PLASMA FRACTIONATION MARKET VALUE, BY APPLICATION, 2020-2026 (USD BILLION)
TABLE 73. JAPAN PLASMA FRACTIONATION MARKET VALUE, BY END-USER, 2020-2026 (USD BILLION)
TABLE 74. REST OF APAC PLASMA FRACTIONATION MARKET VALUE, BY PRODUCT, 2020-2026 (USD BILLION)
TABLE 75. REST OF APAC PLASMA FRACTIONATION MARKET VALUE, BY APPLICATION, 2020-2026 (USD BILLION)
TABLE 76. REST OF APAC PLASMA FRACTIONATION MARKET VALUE, BY END-USER, 2020-2026 (USD BILLION)
TABLE 77. REST OF WORLD PLASMA FRACTIONATION MARKET VALUE, BY PRODUCT, 2020-2026 (USD BILLION)
TABLE 78. REST OF WORLD PLASMA FRACTIONATION MARKET VALUE, BY APPLICATION, 2020-2026 (USD BILLION)
TABLE 79. REST OF WORLD PLASMA FRACTIONATION MARKET VALUE, BY END-USER, 2020-2026 (USD BILLION)
TABLE 80. BHARAT SERUMS AND VACCINES LIMITED: FINANCIALS
TABLE 81. BHARAT SERUMS AND VACCINES LIMITED: PRODUCTS & SERVICES
TABLE 82. BHARAT SERUMS AND VACCINES LIMITED: RECENT DEVELOPMENTS
TABLE 83. SHANGHAI RAAS BLOOD PRODUCTS: FINANCIALS
TABLE 84. SHANGHAI RAAS BLOOD PRODUCTS: PRODUCTS & SERVICES
TABLE 85. SHANGHAI RAAS BLOOD PRODUCTS: RECENT DEVELOPMENTS
TABLE 86. JAPAN BLOOD PRODUCTS ORGANIZATION: FINANCIALS
TABLE 87. JAPAN BLOOD PRODUCTS ORGANIZATION: PRODUCTS & SERVICES
TABLE 88. JAPAN BLOOD PRODUCTS ORGANIZATION: RECENT DEVELOPMENTS
TABLE 89. GREEN CROSS CORPORATION: FINANCIALS
TABLE 90. GREEN CROSS CORPORATION: PRODUCTS & SERVICES
TABLE 91. GREEN CROSS CORPORATION: RECENT DEVELOPMENTS
TABLE 92. GRIFOLS: FINANCIALS
TABLE 93. GRIFOLS: PRODUCTS & SERVICES
TABLE 94. GRIFOLS: RECENT DEVELOPMENTS
TABLE 95. SHIRE: FINANCIALS
TABLE 96. SHIRE: PRODUCTS & SERVICES
TABLE 97. SHIRE: RECENT DEVELOPMENTS
TABLE 98. OCTAPHARMA: FINANCIALS
TABLE 99. OCTAPHARMA: PRODUCTS & SERVICES
TABLE 100. OCTAPHARMA: RECENT DEVELOPMENTS
TABLE 101. LFB: FINANCIALS
TABLE 102. LFB: PRODUCTS & SERVICES
TABLE 103. LFB: RECENT DEVELOPMENTS
TABLE 104. BIOTEST: FINANCIALS
TABLE 105. BIOTEST: PRODUCTS & SERVICES
TABLE 106. BIOTEST: RECENT DEVELOPMENTS
TABLE 107. CSL: FINANCIALS
TABLE 108. CSL: PRODUCTS & SERVICES
TABLE 109. CSL: RECENT DEVELOPMENTS
TABLE 110. SANQUIN: PRODUCTS & SERVICES
TABLE 111. CHINA BIOLOGIC PRODUCTS: PRODUCTS & SERVICES
TABLE 112. BIO PRODUCTS LABORATORY: PRODUCTS & SERVICES
TABLE 113. KEDRION: PRODUCTS & SERVICES
TABLE 114. EMERGENT BIOSOLUTIONS: PRODUCTS & SERVICES
TABLE 115. INTAS BIOPHARMACEUTICALS: PRODUCTS & SERVICES
Research Framework
Infoholic Research works on a holistic 360° approach in order to deliver high quality, validated and reliable information in our market reports. The Market estimation and forecasting involves following steps:
- Data Collation (Primary & Secondary)
- In-house Estimation (Based on proprietary data bases and Models)
- Market Triangulation
- Forecasting

Market related information is congregated from both primary and secondary sources.
Primary sources
Involved participants from all global stakeholders such as Solution providers, service providers, Industry associations, thought leaders etc. across levels such as CXOs, VPs and managers. Plus, our in-house industry experts having decades of industry experience contribute their consulting and advisory services.
Secondary sources
Include public sources such as regulatory frameworks, government IT spending, government demographic indicators, industry association statistics, and company publications along with paid sources such as Factiva, OneSource, Bloomberg among others.
![]()


