
Open Source Services Market by Industry (Banking, Financial Services and Insurance, Manufacturing, Healthcare and Life Sciences, Retail and Distribution, Others), Service Type (Consulting Services, Implementation, Support, Maintenance and Management, and Training Service), and Geography (North America, Europe, APAC and RoW) - Global Forecast to 2026
- July, 2020
- Domain: ICT - Telecommunications
- Get Free 10% Customization in this Report
Open source service is a type of software where source code is released by the copyright holders for users to utilize, study, and also can modify it. The users can deliver the software to anyone on any Platform. Globally, the open-source services help the firm to achieve IT strategic goals and help to improve the performance, productivity, and maximize the efficiency of the organization. The major factors driving the open source services market are accessibility to the source code to all the firms, and low cost than the proprietary solutions as well as simple interoperability.
Research Methodology:
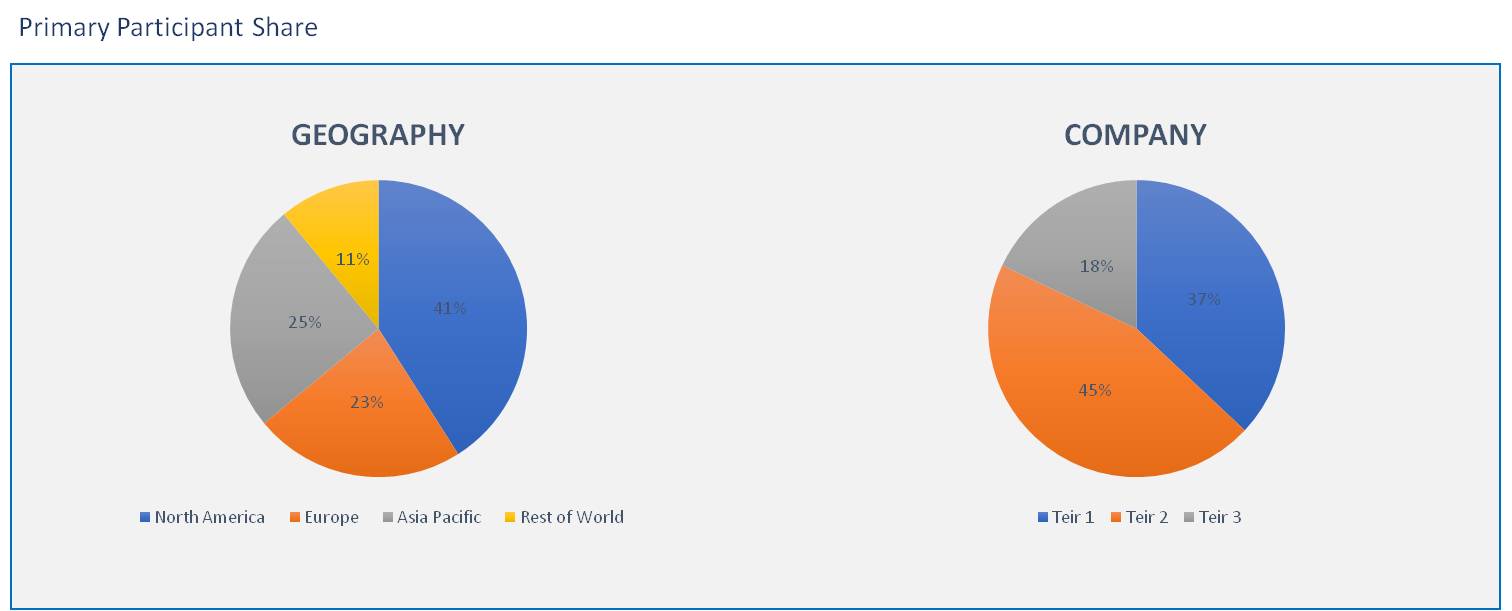
The Open source services market has been analyzed by utilizing the optimum combination of secondary sources and in-house methodology, along with an irreplaceable blend of primary insights. The real-time assessment of the market is an integral part of our market sizing and forecasting methodology. Our industry experts and panel of primary participants have helped in compiling relevant aspects with realistic parametric estimations for a comprehensive study. The participation share of different categories of primary participants is given below:
The demand for the open-source services market is supporting the market growth. Somehow, the open-source services have certain security challenges that are drawing down on market growth. Open Source Services Market is predicted to grow at a CAGR of ~21.75% with a value expecting to reach $66.84 billion by 2026.
The scope of the Open Source Services Market is defined in the market analysis as follows:
- Based on Industry:
· Banking, Financial Services, and Insurance
· Manufacturing
· Healthcare and Life Sciences
· Retail and Distribution
· Others
- Based on Service:
· Consulting Services
· Implementation
· Support, Maintenance, and Management Services
· Training Services
- Based on Geography:
· North America
· Europe
· Asia Pacific
· Rest of the World
The open-source services market based on industry – In industry segment, the manufacturing industry is having the largest share in the open-source market due to the adoption of open source in the manufacturing industry as well as due to the high adoption of production planning, inventory planning and estimation of demand in the manufacturing industry. The banking, financial services, and insurance industry are also expected to have the next large share in the market as this industry adopted the customer relationship management solutions to approach the customers.
Further, the open-source services market based on service is segmented into consulting services, implementation, support, maintenance and management services, and training services. The consulting service has acquired the largest share in the open-source services market as many players competing in the open-source services market are highly developing strategies to promote the awareness about Linux and other open-source operating systems for the developers.
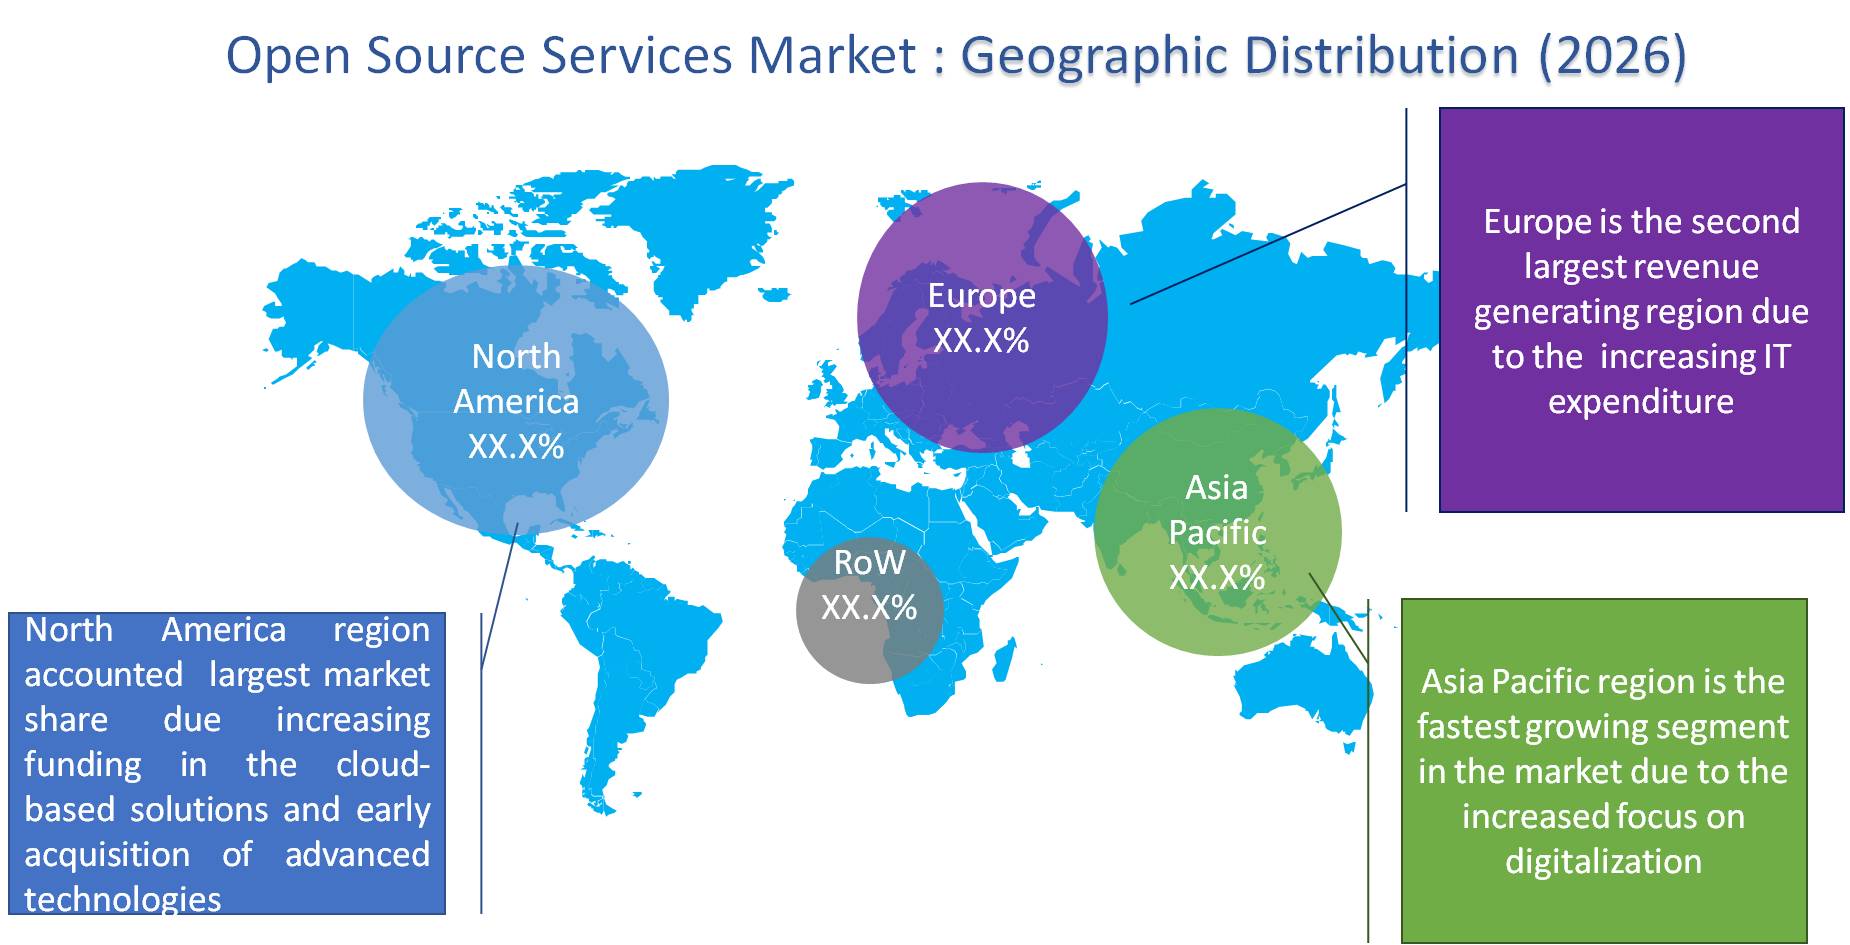
The open-source services market based on regional segmentation is divided into North America, Europe, Asia Pacific, and RoW. North America has been the largest contributor in the open-source market growth due to the high funding in the cloud-based solutions and early acquisition of advanced technologies and solutions for the better performance of the enterprise. Asia Pacific is also a region, which is contributing towards the market share growth, especially in China, where a lot of companies are dependent on IT technology, which is increasing the utilization of the open-source.
Globally, the Open Source Services Market is growing at a CAGR of ~21.75% during the forecast period of 2020-2026. The factors driving this market are cost-effective service, accessible software to everyone in the business for providing valuable solutions for the enterprise. In addition, the open-source service gives the secured data. Rapidly increasing demand for real-time important data and requirement of the open-source intelligence market gives support in the growth of the open-source market. However, highly complicated open-source intelligence is a restrain to the open-source market growth.
The report also includes the analysis of major players in the Open Source services market. Some of the major players consist of Red Hat, Wipro, Accenture, Infosys, IBM, ATOS, Cisco Systems, HPE, HCL, and Oracle.
Globally, the demand for the open-source services market is increasing, especially in IT-oriented firms, for the enhancement of operational effectiveness. This report will help the market players to understand the key market trends, market dynamics, and dynamic need of the end-users. The qualitative and quantitative analysis enhances the user experience of the report.
- The competitive analysis of the major players enables users to understand the dynamic strategies such as product innovation, partnerships, merger & acquisitions and joint ventures of the key players
- This report also provides the portfolio analysis, capability analysis of the leading players
- Quantitative analysis of the market enables users to understand the actual facts of the market across four major regions
1. Executive Summary
2. Industry Outlook
2.1. Industry Overview
2.2. Industry Trends
3. Market Snapshot
3.1. Total Adressable Market
3.2. Segment Addressable Market
3.2.1. PEST Analysis
3.2.2. Porter Five Forces
3.3. Related Markets
3.4. Ecosystem
4. Market Outlook
4.1. Overview
4.1.1. Market Evolution
4.2. Market Trends and Impact
4.3. Pricing Analysis
4.4. Market Segmentation
4.5. Market Dynamics
4.5.1. Drivers
4.5.2. Restraints
4.5.3. Opportunities
4.6. DRO - Impact Analysis
5. Industry: Market Size & Analysis
5.1. Overview
5.2. Banking, Financial Services, and Insurance
5.3. Manufacturing
5.4. Healthcare and Life Sciences
5.5. Retail and Distribution
5.6. Others
6. Service: Market Size & Analysis
6.1. Overview
6.2. Consulting Services
6.3. Implementation
6.4. Support, Maintenance, and Management Services
6.5. Training Services
7. Geography: Market Size & Analysis
7.1. Overview
7.2. North America
7.3. Europe
7.4. Asia Pacific
7.5. Rest of the World
8. Competitive Landscape
8.1. Competitor Comparison Analysis
8.2. Market Developments
8.3. Mergers and Acquisitions, Legal, Awards, Partnerships
8.4. Product Launches and execution
9. Vendor Profiles
9.1. Red Hat
9.1.1. Overview
9.1.2. Business Units
9.1.3. Geographic Revenue
9.1.4. Product Offerings
9.1.5. Developments
9.1.6. Business Strategy
9.2. Accenture
9.2.1. Overview
9.2.2. Business Units
9.2.3. Geographic Revenue
9.2.4. Product Offerings
9.2.5. Developments
9.2.6. Business Strategy
9.3. Wipro
9.3.1. Overview
9.3.2. Business Units
9.3.3. Geographic Revenue
9.3.4. Product Offerings
9.3.5. Developments
9.3.6. Business Strategy
9.4. IBM
9.4.1. Overview
9.4.2. Business Units
9.4.3. Geographic Revenue
9.4.4. Product Offerings
9.4.5. Developments
9.4.6. Business Strategy
9.5. Infosys
9.5.1. Overview
9.5.2. Business Units
9.5.3. Geographic Revenue
9.5.4. Product Offerings
9.5.5. Developments
9.5.6. Business Strategy
9.6. Cisco Systems
9.6.1. Overview
9.6.2. Business Units
9.6.3. Geographic Revenue
9.6.4. Product Offerings
9.6.5. Developments
9.6.6. Business Strategy
9.7. ATOS
9.7.1. Overview
9.7.2. Business Units
9.7.3. Geographic Revenue
9.7.4. Product Offerings
9.7.5. Developments
9.7.6. Business Strategy
9.8. HCL
9.8.1. Overview
9.8.2. Business Units
9.8.3. Geographic Revenue
9.8.4. Product Offerings
9.8.5. Developments
9.8.6. Business Strategy
9.9. HPE
9.9.1. Overview
9.9.2. Business Units
9.9.3. Geographic Revenue
9.9.4. Product Offerings
9.9.5. Developments
9.9.6. Business Strategy
9.10. Oracle
9.10.1. Overview
9.10.2. Business Units
9.10.3. Geographic Revenue
9.10.4. Product Offerings
9.10.5. Developments
9.10.6. Business Strategy
10. Analyst Opinion
11. Annexure
11.1. Report Scope
11.2. Market Definitions
11.3. Research Methodology
11.3.1. Data Collation and In-house Estimation
11.3.2. Market Triangulation
11.3.3. Forecasting
11.4. Report Assumptions
11.5. Declarations
11.6. Stakeholders
11.7. Abbreviations
TABLE 1. GLOBAL OPEN SOURCE SERVICES MARKET VALUE, BY INDUSTRY, 2020-2026 (USD BILLION)
TABLE 2. GLOBAL OPEN SOURCE SERVICES MARKET VALUE FOR BANKING, FINANCIAL SERVICES, AND INSURANCE, BY GEOGRAPHY, 2020-2026 (USD BILLION)
TABLE 3. GLOBAL OPEN SOURCE SERVICES MARKET VALUE FOR MANUFACTURING, BY GEOGRAPHY, 2020-2026 (USD BILLION)
TABLE 4. GLOBAL OPEN SOURCE SERVICES MARKET VALUE FOR HEALTHCARE AND LIFE SCIENCES, BY GEOGRAPHY, 2020-2026 (USD BILLION)
TABLE 5. GLOBAL OPEN SOURCE SERVICES MARKET VALUE FOR RETAIL AND DISTRIBUTION, BY GEOGRAPHY, 2020-2026 (USD BILLION)
TABLE 6. GLOBAL OPEN SOURCE SERVICES MARKET VALUE, BY OTHERS, 2020-2026 (USD BILLION)
TABLE 7. GLOBAL OPEN SOURCE SERVICES MARKET VALUE, BY SERVICE, 2020-2026 (USD BILLION)
TABLE 8. GLOBAL OPEN SOURCE SERVICES MARKET VALUE FOR CONSULTING SERVICES, BY GEOGRAPHY, 2020-2026 (USD BILLION)
TABLE 9. GLOBAL OPEN SOURCE SERVICES MARKET VALUE FOR IMPLEMENTATION, BY GEOGRAPHY, 2020-2026 (USD BILLION)
TABLE 10. GLOBAL OPEN SOURCE SERVICES MARKET VALUE FOR SUPPORT, MAINTENANCE, AND MANAGEMENT SERVICES, BY GEOGRAPHY, 2020-2026 (USD BILLION)
TABLE 11. GLOBAL OPEN SOURCE SERVICES MARKET VALUE FOR TRAINING SERVICES, BY GEOGRAPHY, 2020-2026 (USD BILLION)
TABLE 12. NORTH AMERICA OPEN SOURCE SERVICES MARKET VALUE, BY COUNTRY, 2020-2026 (USD BILLION)
TABLE 13. NORTH AMERICA OPEN SOURCE SERVICES MARKET VALUE, BY SERVICES, 2020-2026 (USD BILLION)
TABLE 14. NORTH AMERICA OPEN SOURCE SERVICES MARKET VALUE, BY INDUSTRY, 2020-2026 (USD BILLION)
TABLE 15. U.S OPEN SOURCE SERVICES MARKET VALUE, BY SERVICES, 2020-2026 (USD BILLION)
TABLE 16. U.S OPEN SOURCE SERVICES MARKET VALUE, BY INDUSTRY, 2020-2026 (USD BILLION)
TABLE 17. CANADA OPEN SOURCE SERVICES MARKET VALUE, BY SERVICES, 2020-2026 (USD BILLION)
TABLE 18. CANADA OPEN SOURCE SERVICES MARKET VALUE, BY INDUSTRY, 2020-2026 (USD BILLION)
TABLE 19. EUROPE OPEN SOURCE SERVICES MARKET VALUE, BY COUNTRY, 2020-2026 (USD BILLION)
TABLE 20. EUROPE OPEN SOURCE SERVICES MARKET VALUE, BY SERVICES, 2020-2026 (USD BILLION)
TABLE 21. EUROPE OPEN SOURCE SERVICES MARKET VALUE, BY INDUSTRY, 2020-2026 (USD BILLION)
TABLE 22. GERMANY OPEN SOURCE SERVICES MARKET VALUE, BY SERVICES, 2020-2026 (USD BILLION)
TABLE 23. GERMANY OPEN SOURCE SERVICES MARKET VALUE, BY INDUSTRY, 2020-2026 (USD BILLION)
TABLE 24. U.K OPEN SOURCE SERVICES MARKET VALUE, BY SERVICES, 2020-2026 (USD BILLION)
TABLE 25. U.K OPEN SOURCE SERVICES MARKET VALUE, BY INDUSTRY, 2020-2026 (USD BILLION)
TABLE 26. FRANCE OPEN SOURCE SERVICES MARKET VALUE, BY SERVICES, 2020-2026 (USD BILLION)
TABLE 27. FRANCE OPEN SOURCE SERVICES MARKET VALUE, BY INDUSTRY, 2020-2026 (USD BILLION)
TABLE 28. ITALY OPEN SOURCE SERVICES MARKET VALUE, BY SERVICES, 2020-2026 (USD BILLION)
TABLE 29. ITALY OPEN SOURCE SERVICES MARKET VALUE, BY INDUSTRY, 2020-2026 (USD BILLION)
TABLE 30. SPAIN OPEN SOURCE SERVICES MARKET VALUE, BY SERVICES, 2020-2026 (USD BILLION)
TABLE 31. SPAIN OPEN SOURCE SERVICES MARKET VALUE, BY INDUSTRY, 2020-2026 (USD BILLION)
TABLE 32. RUSSIA OPEN SOURCE SERVICES MARKET VALUE, BY SERVICES, 2020-2026 (USD BILLION)
TABLE 33. RUSSIA OPEN SOURCE SERVICES MARKET VALUE, BY INDUSTRY, 2020-2026 (USD BILLION)
TABLE 34. ROE OPEN SOURCE SERVICES MARKET VALUE, BY SERVICES, 2020-2026 (USD BILLION)
TABLE 35. ROE OPEN SOURCE SERVICES MARKET VALUE, BY INDUSTRY, 2020-2026 (USD BILLION)
TABLE 36. ASIA PACIFC OPEN SOURCE SERVICES MARKET VALUE, BY COUNTRY, 2020-2026 (USD BILLION)
TABLE 37. ASIA PACIFC OPEN SOURCE SERVICES MARKET VALUE, BY SERVICES, 2020-2026 (USD BILLION)
TABLE 38. ASIA PACIFC OPEN SOURCE SERVICES MARKET VALUE, BY INDUSTRY, 2020-2026 (USD BILLION)
TABLE 39. CHINA OPEN SOURCE SERVICES MARKET VALUE, BY SERVICES, 2020-2026 (USD BILLION)
TABLE 40. CHINA OPEN SOURCE SERVICES MARKET VALUE, BY INDUSTRY, 2020-2026 (USD BILLION)
TABLE 41. INDIA OPEN SOURCE SERVICES MARKET VALUE, BY SERVICES, 2020-2026 (USD BILLION)
TABLE 42. INDIA OPEN SOURCE SERVICES MARKET VALUE, BY INDUSTRY, 2020-2026 (USD BILLION)
TABLE 43. JAPAN OPEN SOURCE SERVICES MARKET VALUE, BY SERVICES, 2020-2026 (USD BILLION)
TABLE 44. JAPAN OPEN SOURCE SERVICES MARKET VALUE, BY INDUSTRY, 2020-2026 (USD BILLION)
TABLE 45. AUSTRALIA OPEN SOURCE SERVICES MARKET VALUE, BY SERVICES, 2020-2026 (USD BILLION)
TABLE 46. AUSTRALIA OPEN SOURCE SERVICES MARKET VALUE, BY INDUSTRY, 2020-2026 (USD BILLION)
TABLE 47. REST OF APAC OPEN SOURCE SERVICES MARKET VALUE, BY SERVICES, 2020-2026 (USD BILLION)
TABLE 48. REST OF APAC OPEN SOURCE SERVICES MARKET VALUE, BY INDUSTRY, 2020-2026 (USD BILLION)
TABLE 49. REST OF WORLD OPEN SOURCE SERVICES MARKET VALUE, BY SERVICES, 2020-2026 (USD BILLION)
TABLE 50. REST OF WORLD OPEN SOURCE SERVICES MARKET VALUE, BY INDUSTRY, 2020-2026 (USD BILLION)
TABLE 51. RED HAT.: OVERVIEW
TABLE 52. RED HAT.: STRATEGIC SNAPSHOT
TABLE 53. RED HAT.: BUSINESS OPPORTUNITIES AND OUTLOOK
TABLE 54. RED HAT.: SERVICES/SERVICE PORTFOLIO
TABLE 55. ACCENTURE: OVERVIEW
TABLE 56. ACCENTURE: STRATEGIC SNAPSHOT
TABLE 57. ACCENTURE: BUSINESS OPPORTUNITIES AND OUTLOOK
TABLE 58. ACCENTURE: SERVICES/SERVICE PORTFOLIO
TABLE 59. WIPRO: OVERVIEW
TABLE 60. WIPRO: STRATEGIC SNAPSHOT
TABLE 61. WIPRO: BUSINESS OPPORTUNITIES AND OUTLOOK
TABLE 62. WIPRO: SERVICES/SERVICE PORTFOLIO
TABLE 63. MERCK & CO..: OVERVIEW
TABLE 64. MERCK & CO..: STRATEGIC SNAPSHOT
TABLE 65. MERCK & CO..: BUSINESS OPPORTUNITIES AND OUTLOOK
TABLE 66. MERCK & CO..: SERVICES/SERVICE PORTFOLIO
TABLE 67. INFOSYS: OVERVIEW
TABLE 68. INFOSYS: STRATEGIC SNAPSHOT
TABLE 69. INFOSYS: BUSINESS OPPORTUNITIES AND OUTLOOK
TABLE 70. INFOSYS: SERVICES/SERVICE PORTFOLIO
TABLE 71. CISCO SYSTEMS.: OVERVIEW
TABLE 72. CISCO SYSTEMS.: STRATEGIC SNAPSHOT
TABLE 73. CISCO SYSTEMS.: BUSINESS OPPORTUNITIES AND OUTLOOK
TABLE 74. CISCO SYSTEMS.: SERVICES/SERVICE PORTFOLIO
TABLE 75. ATOS: OVERVIEW
TABLE 76. ATOS: STRATEGIC SNAPSHOT
TABLE 77. ATOS: BUSINESS OPPORTUNITIES AND OUTLOOK
TABLE 78. ATOS: SERVICES/SERVICE PORTFOLIO
TABLE 79. HCL.: OVERVIEW
TABLE 80. HCL.: STRATEGIC SNAPSHOT
TABLE 81. HCL.: BUSINESS OPPORTUNITIES AND OUTLOOK
TABLE 82. HCL.: SERVICES/SERVICE PORTFOLIO
TABLE 83. HPE: OVERVIEW
TABLE 84. HPE: STRATEGIC SNAPSHOT
TABLE 85. HPE: BUSINESS OPPORTUNITIES AND OUTLOOK
TABLE 86. HPE: SERVICES/SERVICE PORTFOLIO
TABLE 87. ORACLE.: OVERVIEW
TABLE 88. ORACLE.: STRATEGIC SNAPSHOT
TABLE 89. ORACLE.: BUSINESS OPPORTUNITIES AND OUTLOOK
TABLE 90. ORACLE.: SERVICES/SERVICE PORTFOLIO
Research Framework
Infoholic Research works on a holistic 360° approach in order to deliver high quality, validated and reliable information in our market reports. The Market estimation and forecasting involves following steps:
- Data Collation (Primary & Secondary)
- In-house Estimation (Based on proprietary data bases and Models)
- Market Triangulation
- Forecasting

Market related information is congregated from both primary and secondary sources.
Primary sources
Involved participants from all global stakeholders such as Solution providers, service providers, Industry associations, thought leaders etc. across levels such as CXOs, VPs and managers. Plus, our in-house industry experts having decades of industry experience contribute their consulting and advisory services.
Secondary sources
Include public sources such as regulatory frameworks, government IT spending, government demographic indicators, industry association statistics, and company publications along with paid sources such as Factiva, OneSource, Bloomberg among others.
![]()


