
Mice Model Market based on Type (Inbred Mice, Outbred Mice, Genetically Engineered Mice, Hybrid/Congenic Mice and Others), Service (Breeding, Cryopreservation, Model in-Licensing, Genetic Testing, and Other Services), Technology (CRISPR/CAS9, Embryonic Stem Cell Injection, Nuclear Transfer and Other Technologies), Application (Oncology, Cardiovascular Studies, Neurology, and Other Applications), and Geography – Global Forecast up to 2026
- May, 2021
- Domain: Healthcare - Pharmaceuticals
- Get Free 10% Customization in this Report
Increasing frequencies of chronic disorders and growing demand for effective therapeutic drugs have positively impacted the market development. Technological advancements in gene editing have meaningfully aided scientists in the research and development of novel drugs, leading to improved utilization of mice models. These models are widely used in research studies of various fields like oncology and immunology. Growing demand for personalized medicines has further controlled to rise in developing the genetically modified humanized mice model market. The Mice Model Market is anticipated to grow at the rate of 7.31% CAGR by 2026.
Research Methodology:
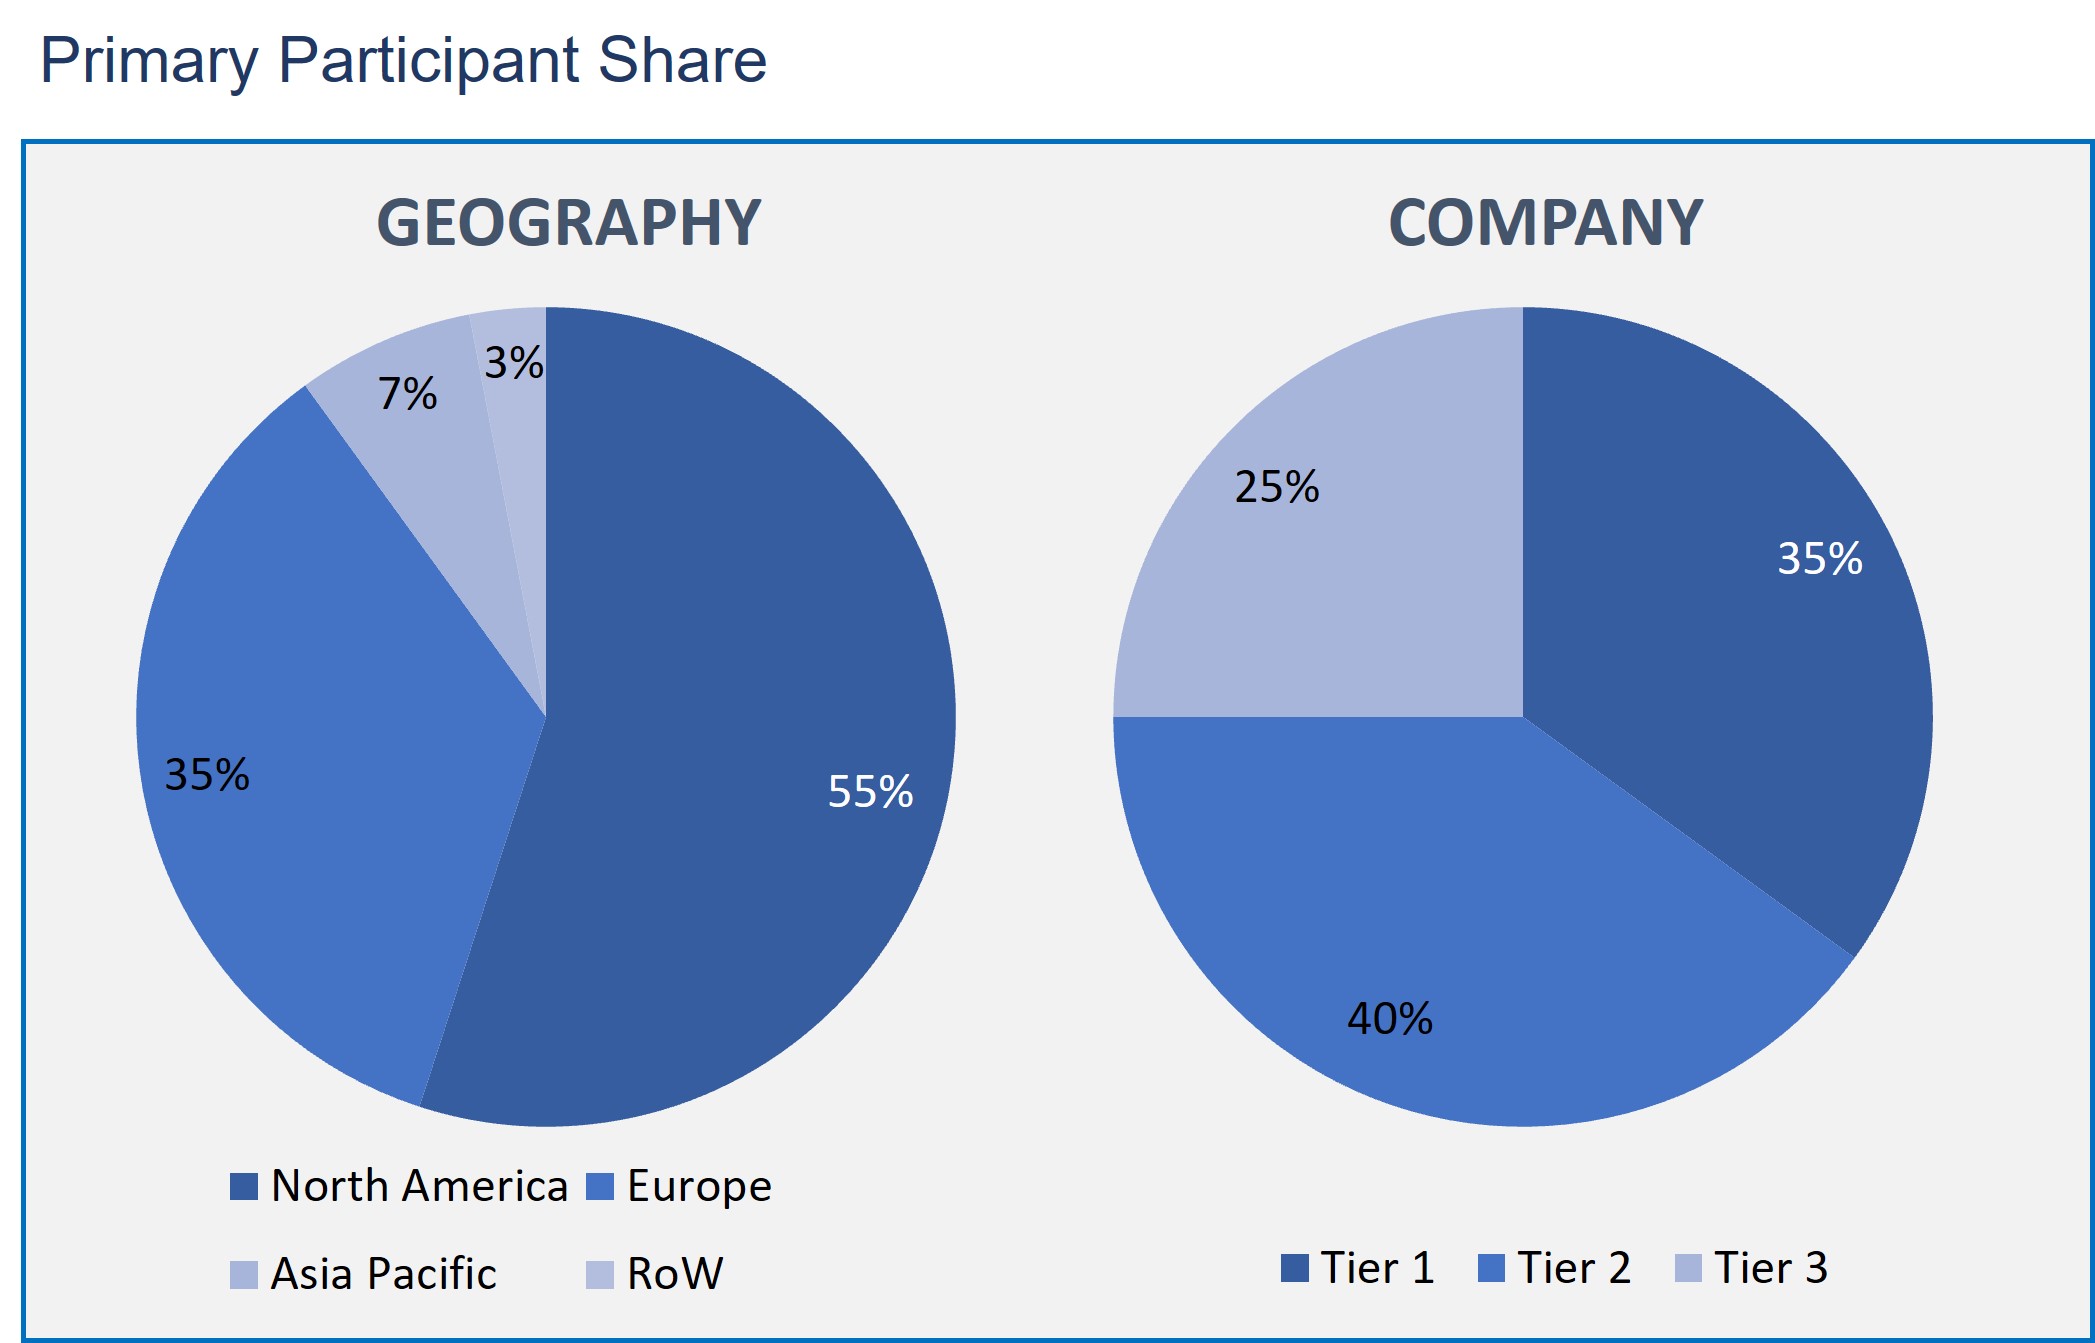
The Mice /model market has been analyzed by utilizing the optimum combination of secondary sources and in-house methodology and a unique balance of primary insights. The real-time valuation of the market is an integral part of our forecasting and market sizing methodology. Industry experts and our primary participants have helped to compile related aspects with accurate parametric estimations for a complete study. The primary participants share is given below:
Mice Model Market by Type
- Inbred Mice
- Outbred Mice
- Genetically Engineered Mice
- Hybrid/Congenic Mice
- Others
Mice Model Market by Technology
- CRISPR/CAS9
- Embryonic Stem Cell Injection
- Nuclear Transfer
- Other Technologies
Mice Model Market by Application
- Oncology
- Cardiovascular Studies
- Neurology
- Other Applications
Mice Model Market by Service
- Breeding
- Cryopreservation
- Model in-Licensing
- Genetic Testing
- Other Services
Mice Model Market by Geography
- North America
- Europe
- Asia Pacific
- Rest of the World
The mice model market based on application has been segmented into immunology and inflammation studies, oncology studies, endocrine, metabolic studies, central nervous system studies, genetic studies, infectious disease studies, cardiovascular studies, and other disease studies. The endocrine disease studies are further segmented into diabetes and other endocrine metabolic disease. The oncology segment is anticipated to account for the largest market share in 2020, with the highest development rate.
The mice model market based on services has been segmented into breeding, quarantine, cryopreservation, rederivation, genetic testing, model in-licensing, and other services. Breeding segmented is anticipated to account for the largest market share in 2020, with the highest development rate. This can majorly be ascribed to the growing demand for mice models for drug discovery and development and the subsequent rise in personalized medicine demand.
On the basis of the type of technology used to create transgenic mice, the mice model market is segmented into microinjection, embryonic stem cell injection, CRISPR/Cas9, nuclear transfer, and other technology segments. CRISPR is the most broadly utilized technology and contributed to the largest share of the mice model market in 2020.
North America holds the major share of the mice model market. The large share of the North American region can be attributed to major players operating in the US's mice model market, rising biomedical research in the US, rising preclinical activities by CROs and pharmaceutical companies in the region.
This report includes the profiles of companies that are leading the Mice Model market: Charles River Laboratories, The Jackson Laboratory, Taconic Biosciences, Inc, Envigo, JANVIER LABS, genOway, PolyGene, Crown Biosciences, TransCure Bioservices, Ingenious Targeting Laboratory, Cyagen Biosciences, GVK BIO, The Andersons, Inc, Innovive, Allentown, LLC, FENGSHI Group, Ozgene Pty Ltd, Harbour Biomed.
- This report offers an overall analysis of the Mice Model market growth drivers, restraints, opportunities, and other related challenges.
- This report depicts the market developments such as new product launches, mergers and acquisitions, diversification, and joint ventures of the market players.
- This report also describes all potential segments and sub-segments present in the market to help the companies in strategic business planning.
- This report also gives the regional analysis of the Mice Model market in terms of market penetration across the world.
- Executive Summary
- Industry Outlook
- Industry Overview
- Industry Trends
- Market Snapshot
- Market Definition
- Market Outlook
- Porter Five Forces
- Related Markets
- Market characteristics
- Market Overview
- Market Segmentation
- Market Dynamics
- Drivers
- Restraints
- Opportunities
- DRO - Impact Analysis
- Type: Market Size & Analysis
- Overview
- Inbred Mice
- Outbred Mice
- Genetically Engineered Mice
- Hybrid/Congenic Mice
- Others
- Service: Market Size & Analysis
- Overview
- Breeding
- Cryopreservation
- Model in-Licensing
- Genetic Testing
- Other Services
- Technology: Market Size & Analysis
- Overview
- CRISPR/CAS9
- Embryonic Stem Cell Injection
- Nuclear Transfer
- Other Technologies
- Application: Market Size & Analysis
- Overview
- Oncology
- Cardiovascular Studies
- Neurology
- Other Applications
- Geography: Market Size & Analysis
- Overview
- North America
- Europe
- Asia Pacific
- Rest of the World
- Competitive Landscape
- Competitor Comparison Analysis
- Market Developments
- Mergers and Acquisitions, Legal, Awards, Partnerships
- Product Launches and execution
- Vendor Profiles
- Taconic Biosciences, Inc.
- Overview
- Financial Overview
- Product offerings
- Developments
- Business Strategy
- The Jackson Laboratory
- Overview
- Financial Overview
- Product offerings
- Developments
- Business Strategy
- Charles River Laboratories
- Overview
- Financial Overview
- Product offerings
- Developments
- Business Strategy
- Ingenious Targeting Laboratory
- Overview
- Financial Overview
- Product offerings
- Developments
- Business Strategy
- JANVIER LABS
- Overview
- Financial Overview
- Product offerings
- Developments
- Business Strategy
- TransCure bioservices
- Overview
- Financial Overview
- Product offerings
- Developments
- Business Strategy
- Envigo
- Overview
- Financial Overview
- Product offerings
- Developments
- Business Strategy
- genOway
- Overview
- Financial Overview
- Product offerings
- Developments
- Business Strategy
- PolyGene
- Overview
- Financial Overview
- Product offerings
- Developments
- Business Strategy
- Crown Biosciences
- Overview
- Financial Overview
- Product offerings
- Developments
- Business Strategy
- Taconic Biosciences, Inc.
- Companies to Watch
- Cyagen Biosciences
- Overview
- Products & Services
- Business Strategy
- Cyagen Biosciences
- Analyst Opinion
- Annexure
- Report Scope
- Market Definitions
- Research Methodology
- Data Collation and In-house Estimation
- Market Triangulation
- Forecasting
- Report Assumptions
- Declarations
- Stakeholders
- Abbreviations
TABLE 1. GLOBAL MICE MODEL MARKET VALUE, BY TYPE, 2020-2026 (USD BILLION)
TABLE 2. GLOBAL MICE MODEL MARKET VALUE FOR INBRED MICE, BY GEOGRAPHY, 2020-2026 (USD BILLION)
TABLE 3. GLOBAL MICE MODEL MARKET VALUE FOR OUTBRED MICE, BY GEOGRAPHY, 2020-2026 (USD BILLION)
TABLE 4. GLOBAL MICE MODEL MARKET VALUE FOR GENETICALLY ENGINEERED MICE, BY GEOGRAPHY, 2020-2026 (USD BILLION)
TABLE 5. GLOBAL MICE MODEL MARKET VALUE FOR HYBRID/CONGENIC MICE, BY GEOGRAPHY, 2020-2026 (USD BILLION)
TABLE 6. GLOBAL MICE MODEL MARKET VALUE FOR OTHERS, BY GEOGRAPHY, 2020-2026 (USD BILLION)
TABLE 7. GLOBAL MICE MODEL MARKET VALUE, BY SERVICE, 2020-2026 (USD BILLION)
TABLE 8. GLOBAL MICE MODEL MARKET VALUE FOR BREEDING, BY GEOGRAPHY, 2020-2026 (USD BILLION)
TABLE 9. GLOBAL MICE MODEL MARKET VALUE FOR CRYOPRESERVATION, BY GEOGRAPHY, 2020-2026 (USD BILLION)
TABLE 10. GLOBAL MICE MODEL MARKET VALUE FOR MODEL IN-LICENSING, BY GEOGRAPHY, 2020-2026 (USD BILLION)
TABLE 11. GLOBAL MICE MODEL MARKET VALUE FOR GENETIC TESTING, BY GEOGRAPHY, 2020-2026 (USD BILLION)
TABLE 12. GLOBAL MICE MODEL MARKET VALUE FOR OTHER SERVICES, BY GEOGRAPHY, 2020-2026 (USD BILLION)
TABLE 13. GLOBAL MICE MODEL MARKET VALUE, BY TECHNOLOGY, 2020-2026 (USD BILLION)
TABLE 14. GLOBAL MICE MODEL MARKET VALUE FOR CRISPR/CAS9, BY GEOGRAPHY, 2020-2026 (USD BILLION)
TABLE 15. GLOBAL MICE MODEL MARKET VALUE FOR EMBRYONIC STEM CELL INJECTION, BY GEOGRAPHY, 2020-2026 (USD BILLION)
TABLE 16. GLOBAL MICE MODEL MARKET VALUE FOR NUCLEAR TRANSFER, BY GEOGRAPHY, 2020-2026 (USD BILLION)
TABLE 17. GLOBAL MICE MODEL MARKET VALUE FOR OTHER TECHNOLOGIES, BY GEOGRAPHY, 2020-2026 (USD BILLION)
TABLE 18. GLOBAL MICE MODEL MARKET VALUE, APPLICATION, 2020-2026 (USD BILLION)
TABLE 19. GLOBAL MICE MODEL MARKET VALUE FOR ONCOLOGY, BY GEOGRAPHY, 2020-2026 (USD BILLION)
TABLE 20. GLOBAL MICE MODEL MARKET VALUE FOR CARDIOVASCULAR STUDIES, BY GEOGRAPHY, 2020-2026 (USD BILLION)
TABLE 21. GLOBAL MICE MODEL MARKET VALUE FOR NEUROLOGY, BY GEOGRAPHY, 2020-2026 (USD BILLION)
TABLE 22. GLOBAL MICE MODEL MARKET VALUE FOR OTHER APPLICATIONS, BY GEOGRAPHY, 2020-2026 (USD BILLION)
TABLE 23. NORTH AMERICA MICE MODEL MARKET VALUE, BY COUNTRY, 2020-2026 (USD BILLION)
TABLE 24. NORTH AMERICA MICE MODEL MARKET VALUE, BY TYPE, 2020-2026 (USD BILLION)
TABLE 25. NORTH AMERICA MICE MODEL MARKET VALUE, BY SERVICE, 2020-2026 (USD BILLION)
TABLE 26. NORTH AMERICA MICE MODEL MARKET VALUE, BY TECHNOLOGY, 2020-2026 (USD BILLION)
TABLE 27. NORTH AMERICA MICE MODEL MARKET VALUE, BY APPLICATION, 2020-2026 (USD BILLION)
TABLE 28. U.S MICE MODEL MARKET VALUE, BY TYPE, 2020-2026 (USD BILLION)
TABLE 29. U.S MICE MODEL MARKET VALUE, BY SERVICE, 2020-2026 (USD BILLION)
TABLE 30. U.S MICE MODEL MARKET VALUE, BY TECHNOLOGY, 2020-2026 (USD BILLION)
TABLE 31. U.S MICE MODEL MARKET VALUE, BY APPLICATION, 2020-2026 (USD BILLION)
TABLE 32. CANADA MICE MODEL MARKET VALUE, BY TYPE, 2020-2026 (USD BILLION)
TABLE 33. CANADA MICE MODEL MARKET VALUE, BY SERVICE, 2020-2026 (USD BILLION)
TABLE 34. CANADA MICE MODEL MARKET VALUE, BY TECHNOLOGY, 2020-2026 (USD BILLION)
TABLE 35. CANADA MICE MODEL MARKET VALUE, BY APPLICATION, 2020-2026 (USD BILLION)
TABLE 36. EUROPE MICE MODEL MARKET VALUE, BY COUNTRY, 2020-2026 (USD BILLION)
TABLE 37. EUROPE MICE MODEL MARKET VALUE, BY TYPE, 2020-2026 (USD BILLION)
TABLE 38. EUROPE MICE MODEL MARKET VALUE, BY SERVICE, 2020-2026 (USD BILLION)
TABLE 39. EUROPE MICE MODEL MARKET VALUE, BY TECHNOLOGY, 2020-2026 (USD BILLION)
TABLE 40. EUROPE MICE MODEL MARKET VALUE, BY APPLICATION, 2020-2026 (USD BILLION)
TABLE 41. GERMANY MICE MODEL MARKET VALUE, BY TYPE, 2020-2026 (USD BILLION)
TABLE 42. GERMANY MICE MODEL MARKET VALUE, BY SERVICE, 2020-2026 (USD BILLION)
TABLE 43. GERMANY MICE MODEL MARKET VALUE, BY TECHNOLOGY, 2020-2026 (USD BILLION)
TABLE 44. GERMANY MICE MODEL MARKET VALUE, BY APPLICATION, 2020-2026 (USD BILLION)
TABLE 45. U.K MICE MODEL MARKET VALUE, BY TYPE, 2020-2026 (USD BILLION)
TABLE 46. U.K MICE MODEL MARKET VALUE, BY SERVICE, 2020-2026 (USD BILLION)
TABLE 47. U.K MICE MODEL MARKET VALUE, BY TECHNOLOGY, 2020-2026 (USD BILLION)
TABLE 48. U.K MICE MODEL MARKET VALUE, BY APPLICATION, 2020-2026 (USD BILLION)
TABLE 49. FRANCE MICE MODEL MARKET VALUE, BY TYPE, 2020-2026 (USD BILLION)
TABLE 50. FRANCE MICE MODEL MARKET VALUE, BY SERVICE, 2020-2026 (USD BILLION)
TABLE 51. FRANCE MICE MODEL MARKET VALUE, BY TECHNOLOGY, 2020-2026 (USD BILLION)
TABLE 52. FRANCE MICE MODEL MARKET VALUE, BY APPLICATION, 2020-2026 (USD BILLION)
TABLE 53. ITALY MICE MODEL MARKET VALUE, BY TYPE, 2020-2026 (USD BILLION)
TABLE 54. ITALY MICE MODEL MARKET VALUE, BY SERVICE, 2020-2026 (USD BILLION)
TABLE 55. ITALY MICE MODEL MARKET VALUE, BY TECHNOLOGY, 2020-2026 (USD BILLION)
TABLE 56. ITALY MICE MODEL MARKET VALUE, BY APPLICATION, 2020-2026 (USD BILLION)
TABLE 57. SPAIN MICE MODEL MARKET VALUE, BY TYPE, 2020-2026 (USD BILLION)
TABLE 58. SPAIN MICE MODEL MARKET VALUE, BY SERVICE, 2020-2026 (USD BILLION)
TABLE 59. SPAIN MICE MODEL MARKET VALUE, BY TECHNOLOGY, 2020-2026 (USD BILLION)
TABLE 60. SPAIN MICE MODEL MARKET VALUE, BY APPLICATION, 2020-2026 (USD BILLION)
TABLE 61. ROE MICE MODEL MARKET VALUE, BY TYPE, 2020-2026 (USD BILLION)
TABLE 62. ROE MICE MODEL MARKET VALUE, BY SERVICE, 2020-2026 (USD BILLION)
TABLE 63. ROE MICE MODEL MARKET VALUE, BY TECHNOLOGY, 2020-2026 (USD BILLION)
TABLE 64. ROE MICE MODEL MARKET VALUE, BY APPLICATION, 2020-2026 (USD BILLION)
TABLE 65. ASIA PACIFIC MICE MODEL MARKET VALUE, BY COUNTRY, 2020-2026 (USD BILLION)
TABLE 66. ASIA PACIFIC MICE MODEL MARKET VALUE, BY TYPE, 2020-2026 (USD BILLION)
TABLE 67. ASIA PACIFIC MICE MODEL MARKET VALUE, BY SERVICE, 2020-2026 (USD BILLION)
TABLE 68. ASIA PACIFIC MICE MODEL MARKET VALUE, BY TECHNOLOGY, 2020-2026 (USD BILLION)
TABLE 69. ASIA PACIFIC MICE MODEL MARKET VALUE, BY APPLICATION, 2020-2026 (USD BILLION)
TABLE 70. CHINA MICE MODEL MARKET VALUE, BY TYPE, 2020-2026 (USD BILLION)
TABLE 71. CHINA MICE MODEL MARKET VALUE, BY SERVICE, 2020-2026 (USD BILLION)
TABLE 72. CHINA MICE MODEL MARKET VALUE, BY TECHNOLOGY, 2020-2026 (USD BILLION)
TABLE 73. CHINA MICE MODEL MARKET VALUE, BY APPLICATION, 2020-2026 (USD BILLION)
TABLE 74. INDIA MICE MODEL MARKET VALUE, BY TYPE, 2020-2026 (USD BILLION)
TABLE 75. INDIA MICE MODEL MARKET VALUE, BY SERVICE, 2020-2026 (USD BILLION)
TABLE 76. INDIA MICE MODEL MARKET VALUE, BY TECHNOLOGY, 2020-2026 (USD BILLION)
TABLE 77. INDIA MICE MODEL MARKET VALUE, BY APPLICATION, 2020-2026 (USD BILLION)
TABLE 78. JAPAN MICE MODEL MARKET VALUE, BY TYPE, 2020-2026 (USD BILLION)
TABLE 79. JAPAN MICE MODEL MARKET VALUE, BY SERVICE, 2020-2026 (USD BILLION)
TABLE 80. JAPAN MICE MODEL MARKET VALUE, BY TECHNOLOGY, 2020-2026 (USD BILLION)
TABLE 81. JAPAN MICE MODEL MARKET VALUE, BY APPLICATION, 2020-2026 (USD BILLION)
TABLE 82. REST OF APAC MICE MODEL MARKET VALUE, BY TYPE, 2020-2026 (USD BILLION)
TABLE 83. REST OF APAC MICE MODEL MARKET VALUE, BY SERVICE, 2020-2026 (USD BILLION)
TABLE 84. REST OF APAC MICE MODEL MARKET VALUE, BY TECHNOLOGY, 2020-2026 (USD BILLION)
TABLE 85. REST OF APAC MICE MODEL MARKET VALUE, BY APPLICATION, 2020-2026 (USD BILLION)
TABLE 86. REST OF WORLD MICE MODEL MARKET VALUE, BY TYPE, 2020-2026 (USD BILLION)
TABLE 87. REST OF WORLD MICE MODEL MARKET VALUE, BY SERVICE, 2020-2026 (USD BILLION)
TABLE 88. REST OF WORLD MICE MODEL MARKET VALUE, BY TECHNOLOGY, 2020-2026 (USD BILLION)
TABLE 89. REST OF WORLD MICE MODEL MARKET VALUE, BY APPLICATION, 2020-2026 (USD BILLION)
TABLE 90. TACONIC BIOSCIENCES, INC: FINANCIALS
TABLE 91. TACONIC BIOSCIENCES, INC: PRODUCTS & SERVICES
TABLE 92. TACONIC BIOSCIENCES, INC: RECENT DEVELOPMENTS
TABLE 93. THE JACKSON LABORATORY: FINANCIALS
TABLE 94. THE JACKSON LABORATORY: PRODUCTS & SERVICES
TABLE 95. THE JACKSON LABORATORY: RECENT DEVELOPMENTS
TABLE 96. CHARLES RIVER LABORATORIES: FINANCIALS
TABLE 97. CHARLES RIVER LABORATORIES: PRODUCTS & SERVICES
TABLE 98. CHARLES RIVER LABORATORIES: RECENT DEVELOPMENTS
TABLE 99. INGENIOUS TARGETING LABORATORY: FINANCIALS
TABLE 100. INGENIOUS TARGETING LABORATORY: PRODUCTS & SERVICES
TABLE 101. INGENIOUS TARGETING LABORATORY: RECENT DEVELOPMENTS
TABLE 102. JANVIER LABS: FINANCIALS
TABLE 103. JANVIER LABS: PRODUCTS & SERVICES
TABLE 104. JANVIER LABS: RECENT DEVELOPMENTS
TABLE 105. TRANSCURE BIOSERVICES: FINANCIALS
TABLE 106. TRANSCURE BIOSERVICES: PRODUCTS & SERVICES
TABLE 107. TRANSCURE BIOSERVICES: RECENT DEVELOPMENTS
TABLE 108. ENVIGO: FINANCIALS
TABLE 109. ENVIGO: PRODUCTS & SERVICES
TABLE 110. ENVIGO: RECENT DEVELOPMENTS
TABLE 111. GENOWAY: FINANCIALS
TABLE 112. GENOWAY: PRODUCTS & SERVICES
TABLE 113. GENOWAY: RECENT DEVELOPMENTS
TABLE 114. POLYGENE: FINANCIALS
TABLE 115. POLYGENE: PRODUCTS & SERVICES
TABLE 116. POLYGENE: RECENT DEVELOPMENTS
TABLE 117. CROWN BIOSCIENCES: FINANCIALS
TABLE 118. CROWN BIOSCIENCES: PRODUCTS & SERVICES
TABLE 119. CROWN BIOSCIENCES: RECENT DEVELOPMENTS
TABLE 120. CYAGEN BIOSCIENCES: PRODUCTS & SERVICES
Research Framework
Infoholic Research works on a holistic 360° approach in order to deliver high quality, validated and reliable information in our market reports. The Market estimation and forecasting involves following steps:
- Data Collation (Primary & Secondary)
- In-house Estimation (Based on proprietary data bases and Models)
- Market Triangulation
- Forecasting

Market related information is congregated from both primary and secondary sources.
Primary sources
Involved participants from all global stakeholders such as Solution providers, service providers, Industry associations, thought leaders etc. across levels such as CXOs, VPs and managers. Plus, our in-house industry experts having decades of industry experience contribute their consulting and advisory services.
Secondary sources
Include public sources such as regulatory frameworks, government IT spending, government demographic indicators, industry association statistics, and company publications along with paid sources such as Factiva, OneSource, Bloomberg among others.
![]()


