
Live Chat Software Market based on Type (Customer Service Live Chat Systems, Informational Service Live Chat Systems, and Sales Live Chat Systems), End-User (Retail & Ecommerce, Travel & Hospitality, Healthcare, BFSI, Media & Entertainment, Telecom & IT, Government and Others) and Geography – Global Forecast up to 2026
- May, 2021
- Domain: ICT - Software & Services
- Get Free 10% Customization in this Report
Live chat is real-time communication software used mainly by website providers to communicate directly with visitors on their websites by fusing survey forms, instant messaging, or chat. It allows real-time communication among two users through a connected device, which is suitable for low to moderately complex product support. Live chat software is based on the client-server model, enabling the client to start a session after logging into the user account. The constant expansion of fame of live chat, development deprived to enhance customer relationship management (CRM), and benefits of live chat software compared to conventional client support will propel the development of the market. The increase in concentration on real-time communication in various industries is due to the increase in the budget of the live chat software in companies. In addition, this software has also played a vital role in its advantages, including improved website experience, increased average order value, increased sales, lead generation, and a better understanding of customer requirements. Apart from that, the rising demand for web self-service and absence of standardization is likely to impede the live chat software market growth. The Live Chat Software Market is anticipated to grow at the rate of 7.29% CAGR by 2026.
Research Methodology:
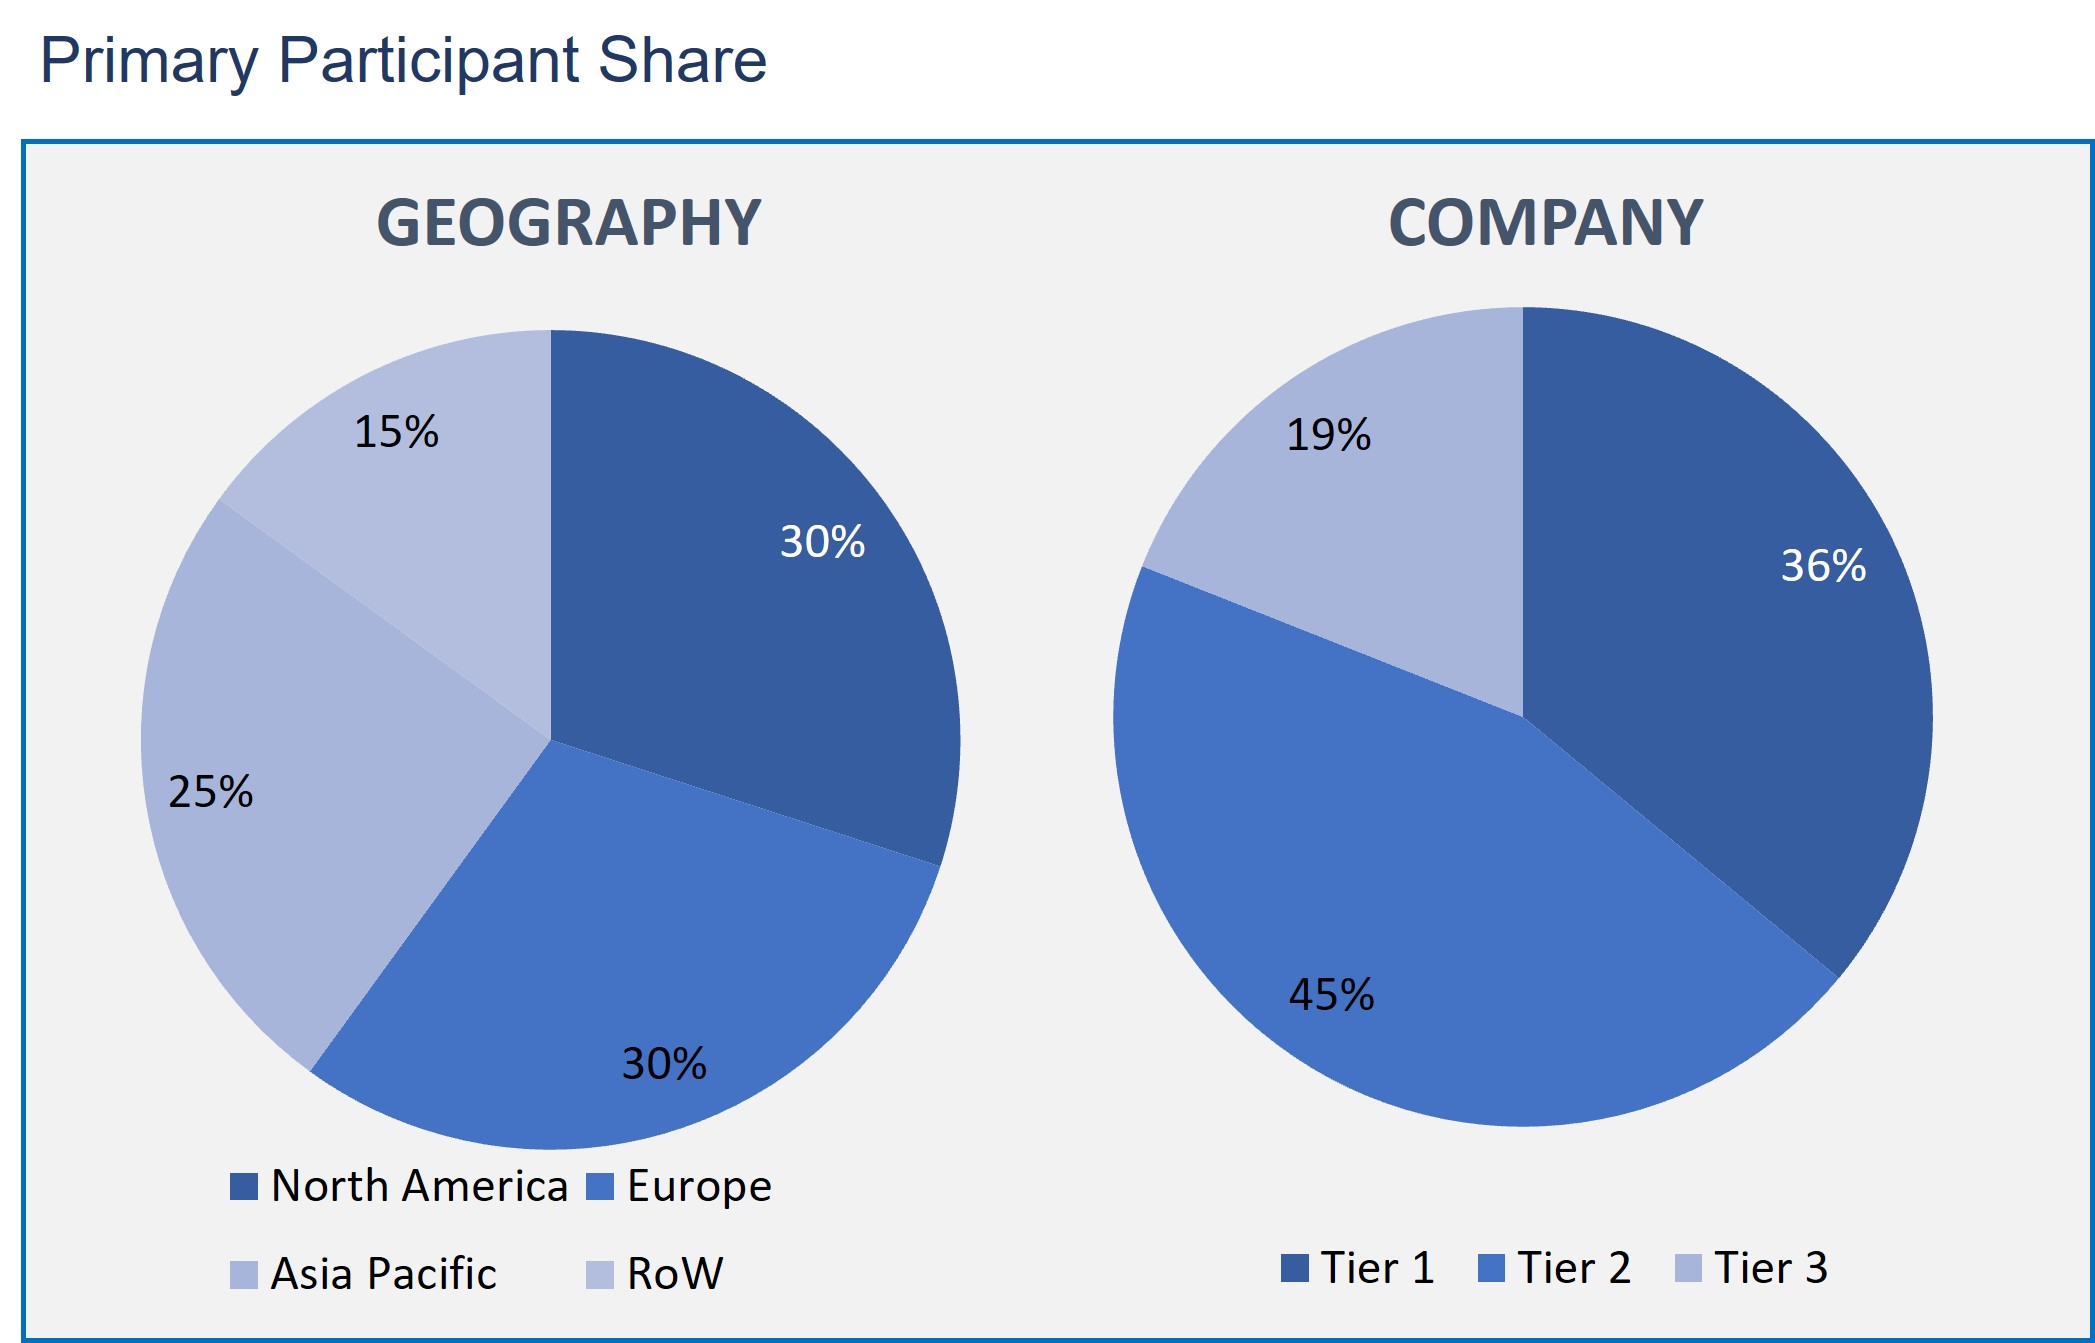
The Live Chat Software Market has been analyzed by utilizing the optimum combination of secondary sources and in-house methodology and a unique balance of primary insights. The real-time valuation of the market is an integral part of our forecasting and market sizing methodology. Industry experts and our primary participants have helped to compile related aspects with accurate parametric estimations for a complete study. The primary participants share is given below:
Live Chat Software Market based on Type
- Customer Service Live Chat Systems
- Informational Service Live Chat Systems
- Sales Live Chat Systems
Live Chat Software Market based on End-User
- Retail & Ecommerce
- Travel & Hospitality
- Healthcare
- BFSI
- Media & Entertainment
- Telecom & IT
- Government
- Others
Live Chat Software Market based on Geography
- North America
- Europe
- Asia Pacific
- Rest of the World
The market is categorized into Customer Service Live Chat Systems, Informational Service Live Chat Systems, and Sales Live Chat Systems based on the type. The customer service segment held the highest share in the market. This live chat system is generally a range of customer services that support customers in making a cost-efficient and proper use of a product. Customer support includes installation, planning, training, maintenance, troubleshooting, upgrading, and disposal of a product with the help of live chat software. Moreover, the continuous growth in the requirement to enhance customer relationship management and the advantages of live chat apps over conventional customer support offers advertisers enormous potential for targeting their consumers and enhancing user experience.
Further, the market is segmented by end-users, including Retail & Ecommerce, Travel & Hospitality, Healthcare, BFSI, Media & Entertainment, Telecom & IT, Government, and Others. The retail and e-commerce segment witnessed a significant growth rate due to their wide-scale adoption to enhance customer interaction and better management of queries. Live chat software has also played a key role because of its advantages in better understanding customer requirements, enabling companies to perform up to ten times better on key performance metrics by recognizing customer preferences in the retail vertical thus, providing a boost to the market in the end-user segment.
In terms of geography, the Asia Pacific has been dominating the market. Since consumers in the Asia Pacific are using self–service and chatbots and, as a result, are adopting live chat over the conventional methods for asking queries during online shopping. With customer experience a critical factor in which brands Asian consumers choose, organizations need to make sure that they match expectations now if they want to flourish and grow moving forward, consequently boosting the live chat market growth in this region.
Various companies worldwide are integrating their customer relationship management tool with live chat software to augment the user experience and potential leads for present customers. By saving money for organizations and protecting their customer base, the live chat software assists organizations in boosting satisfaction and improving retention rates. Thus, the rising requirement for improving customer relationship management in every vertical is compelling the global live chat software market growth.
The prominent players of the live chat software market are LogMeIn, Inc., Woopra, Inc., Provide Support LLC, Freshdesk, Inc., LivePerson, Inc., Zendesk Inc., SnapEngage, Livechat, Inc., Olark and Kayako, Inc.
Hence, most companies focus more on customer retention than looking for new customers where the live chat software plays a key role. The live chat software provides a company with various benefits for retaining customers by responding to customer queries resulting in enhanced customer experience.
- Qualitative and quantitative analyses of the market based on segmentation involving economic and non-economic factors are provided in the report.
- The report indicates the region and segment anticipated to witness the fastest growth and dominate the market.
- Competitive outlook, which includes the market ranking of the key players, with new service/product launches, business expansions, partnerships, and acquisitions in the past five years of companies profiled
- The report also provides analysis by geography focusing on the consumption of the product/service in the region as well as specifying the factors which are affecting the market within each region
- Executive Summary
- Industry Outlook
- Industry Overview
- Industry Trends
- Market Snapshot
- Market Definition
- Market Outlook
- Porter Five Forces
- Related Markets
- Market characteristics
- Market Overview
- Market Segmentation
- Market Dynamics
- Drivers
- Restraints
- Opportunities
- DRO - Impact Analysis
- Type: Market Size & Analysis
- Overview
- Customer Service Live Chat Systems
- Informational Service Live Chat Systems
- Sales Live Chat Systems
- End-User: Market Size & Analysis
- Overview
- Retail & Ecommerce
- Travel & Hospitality
- Healthcare
- BFSI
- Media & Entertainment
- Telecom & IT
- Government
- Others
- Geography: Market Size & Analysis
- Overview
- North America
- Europe
- Asia Pacific
- Rest of the World
- Competitive Landscape
- Competitor Comparison Analysis
- Market Developments
- Mergers and Acquisitions, Legal, Awards, Partnerships
- Product Launches and execution
- Vendor Profiles
- LogMeIn, Inc.
- Overview
- Financial Overview
- Product Offerings
- Developments
- Business Strategy
- Woopra, Inc.
- Overview
- Financial Overview
- Product Offerings
- Developments
- Business Strategy
- Provide Support LLC
- Overview
- Financial Overview
- Product Offerings
- Developments
- Business Strategy
- Freshdesk, Inc.
- Overview
- Financial Overview
- Product Offerings
- Developments
- Business Strategy
- LivePerson, Inc.
- Overview
- Financial Overview
- Product Offerings
- Developments
- Business Strategy
- Zendesk Inc.
- Overview
- Financial Overview
- Product Offerings
- Developments
- Business Strategy
- SnapEngage
- Overview
- Financial Overview
- Product Offerings
- Developments
- Business Strategy
- Livechat, Inc.
- Overview
- Financial Overview
- Product Offerings
- Developments
- Business Strategy
- Olark
- Overview
- Financial Overview
- Product Offerings
- Developments
- Business Strategy
- Kayako, Inc
- Overview
- Financial Overview
- Product Offerings
- Developments
- Business Strategy
- LogMeIn, Inc.
- Analyst Opinion
- Annexure
- Report Scope
- Market Definitions
- Research Methodology
- Data Collation and In-house Estimation
- Market Triangulation
- Forecasting
- Report Assumptions
- Declarations
- Stakeholders
- Abbreviations
TABLE 1. GLOBAL LIVE CHAT SOFTWARE MARKET VALUE, BY TYPE, 2020-2026 (USD BILLION)
TABLE 2. GLOBAL LIVE CHAT SOFTWARE MARKET VALUE FOR CUSTOMER SERVICE LIVE CHAT SYSTEMS, BY GEOGRAPHY, 2020-2026 (USD BILLION)
TABLE 3. GLOBAL LIVE CHAT SOFTWARE MARKET VALUE FOR INFORMATIONAL SERVICE LIVE CHAT SYSTEMS, BY GEOGRAPHY, 2020-2026 (USD BILLION)
TABLE 4. GLOBAL LIVE CHAT SOFTWARE MARKET VALUE FOR SALES LIVE CHAT SYSTEMS, BY GEOGRAPHY, 2020-2026 (USD BILLION)
TABLE 5. GLOBAL LIVE CHAT SOFTWARE MARKET VALUE, BY END-USER, 2020-2026 (USD BILLION)
TABLE 6. GLOBAL LIVE CHAT SOFTWARE MARKET VALUE FOR RETAIL & ECOMMERCE, 2020-2026 (USD BILLION)
TABLE 7. GLOBAL LIVE CHAT SOFTWARE MARKET VALUE FOR TRAVEL & HOSPITALITY, BY GEOGRAPHY, 2020-2026 (USD BILLION)
TABLE 8. GLOBAL LIVE CHAT SOFTWARE MARKET VALUE FOR HEALTHCARE, BY GEOGRAPHY, 2020-2026 (USD BILLION)
TABLE 9. GLOBAL LIVE CHAT SOFTWARE MARKET VALUE FOR BFSI, BY GEOGRAPHY, 2020-2026 (USD BILLION)
TABLE 10. GLOBAL LIVE CHAT SOFTWARE MARKET VALUE FOR MEDIA & ENTERTAINMENT, BY GEOGRAPHY, 2020-2026 (USD BILLION)
TABLE 11. GLOBAL LIVE CHAT SOFTWARE MARKET VALUE FOR TELECOM & IT, BY GEOGRAPHY, 2020-2026 (USD BILLION)
TABLE 12. GLOBAL LIVE CHAT SOFTWARE MARKET VALUE FOR GOVERNMENT, BY GEOGRAPHY, 2020-2026 (USD BILLION)
TABLE 13. GLOBAL LIVE CHAT SOFTWARE MARKET VALUE FOR OTHERS, BY GEOGRAPHY, 2020-2026 (USD BILLION)
TABLE 14. NORTH AMERICA LIVE CHAT SOFTWARE MARKET VALUE, BY COUNTRY, 2020-2026 (USD BILLION)
TABLE 15. NORTH AMERICA LIVE CHAT SOFTWARE MARKET VALUE, BY TYPE, 2020-2026 (USD BILLION)
TABLE 16. NORTH AMERICA LIVE CHAT SOFTWARE MARKET VALUE, BY END-USER, 2020-2026 (USD BILLION)
TABLE 17. U.S LIVE CHAT SOFTWARE MARKET VALUE, BY TYPE, 2020-2026 (USD BILLION)
TABLE 18. U.S LIVE CHAT SOFTWARE MARKET VALUE, BY END-USER, 2020-2026 (USD BILLION)
TABLE 19. CANADA LIVE CHAT SOFTWARE MARKET VALUE, BY TYPE, 2020-2026 (USD BILLION)
TABLE 20. CANADA LIVE CHAT SOFTWARE MARKET VALUE, BY END-USER, 2020-2026 (USD BILLION)
TABLE 21. EUROPE LIVE CHAT SOFTWARE MARKET VALUE, BY COUNTRY, 2020-2026 (USD BILLION)
TABLE 22. EUROPE LIVE CHAT SOFTWARE MARKET VALUE, BY TYPE, 2020-2026 (USD BILLION)
TABLE 23. EUROPE LIVE CHAT SOFTWARE MARKET VALUE, END-USER, 2020-2026 (USD BILLION)
TABLE 24. GERMANY LIVE CHAT SOFTWARE MARKET VALUE, BY TYPE, 2020-2026 (USD BILLION)
TABLE 25. GERMANY LIVE CHAT SOFTWARE MARKET VALUE, BY END-USER, 2020-2026 (USD BILLION)
TABLE 26. U.K LIVE CHAT SOFTWARE MARKET VALUE, BY TYPE, 2020-2026 (USD BILLION)
TABLE 27. U.K LIVE CHAT SOFTWARE MARKET VALUE, BY END-USER, 2020-2026 (USD BILLION)
TABLE 28. FRANCE LIVE CHAT SOFTWARE MARKET VALUE, BY TYPE, 2020-2026 (USD BILLION)
TABLE 29. FRANCE LIVE CHAT SOFTWARE MARKET VALUE, BY END-USER, 2020-2026 (USD BILLION)
TABLE 30. ITALY LIVE CHAT SOFTWARE MARKET VALUE, BY TYPE, 2020-2026 (USD BILLION)
TABLE 31. ITALY LIVE CHAT SOFTWARE MARKET VALUE, BY END-USER, 2020-2026 (USD BILLION)
TABLE 32. SPAIN LIVE CHAT SOFTWARE MARKET VALUE, BY TYPE, 2020-2026 (USD BILLION)
TABLE 33. SPAIN LIVE CHAT SOFTWARE MARKET VALUE, BY END-USER, 2020-2026 (USD BILLION)
TABLE 34. ROE LIVE CHAT SOFTWARE MARKET VALUE, BY TYPE, 2020-2026 (USD BILLION)
TABLE 35. ROE LIVE CHAT SOFTWARE MARKET VALUE, BY END-USER, 2020-2026 (USD BILLION)
TABLE 36. ASIA PACIFIC LIVE CHAT SOFTWARE MARKET VALUE, BY COUNTRY, 2020-2026 (USD BILLION)
TABLE 37. ASIA PACIFIC LIVE CHAT SOFTWARE MARKET VALUE, BY TYPE, 2020-2026 (USD BILLION)
TABLE 38. ASIA PACIFIC LIVE CHAT SOFTWARE MARKET VALUE, BY END-USER, 2020-2026 (USD BILLION)
TABLE 39. CHINA LIVE CHAT SOFTWARE MARKET VALUE, BY TYPE, 2020-2026 (USD BILLION)
TABLE 40. CHINA LIVE CHAT SOFTWARE MARKET VALUE, BY END-USER, 2020-2026 (USD BILLION)
TABLE 41. INDIA LIVE CHAT SOFTWARE MARKET VALUE, BY TYPE, 2020-2026 (USD BILLION)
TABLE 42. INDIA LIVE CHAT SOFTWARE MARKET VALUE, BY END-USER, 2020-2026 (USD BILLION)
TABLE 43. JAPAN LIVE CHAT SOFTWARE MARKET VALUE, BY TYPE, 2020-2026 (USD BILLION)
TABLE 44. JAPAN LIVE CHAT SOFTWARE MARKET VALUE, BY END-USER, 2020-2026 (USD BILLION)
TABLE 45. REST OF APAC LIVE CHAT SOFTWARE MARKET VALUE, BY TYPE, 2020-2026 (USD BILLION)
TABLE 46. REST OF APAC LIVE CHAT SOFTWARE MARKET VALUE, BY END-USER, 2020-2026 (USD BILLION)
TABLE 47. REST OF WORLD LIVE CHAT SOFTWARE MARKET VALUE, BY TYPE, 2020-2026 (USD BILLION)
TABLE 48. REST OF WORLD LIVE CHAT SOFTWARE MARKET VALUE, BY END-USER, 2020-2026 (USD BILLION)
TABLE 49. LOGMEIN, INC: FINANCIALS
TABLE 50. LOGMEIN, INC: PRODUCTS & SERVICES
TABLE 51. LOGMEIN, INC: RECENT DEVELOPMENTS
TABLE 52. WOOPRA, INC: FINANCIALS
TABLE 53. WOOPRA, INC: PRODUCTS & SERVICES
TABLE 54. WOOPRA, INC: RECENT DEVELOPMENTS
TABLE 55. PROVIDE SUPPORT LLC: FINANCIALS
TABLE 56. PROVIDE SUPPORT LLC: PRODUCTS & SERVICES
TABLE 57. PROVIDE SUPPORT LLC: RECENT DEVELOPMENTS
TABLE 58. FRESHDESK, INC: FINANCIALS
TABLE 59. FRESHDESK, INC: PRODUCTS & SERVICES
TABLE 60. FRESHDESK, INC: RECENT DEVELOPMENTS
TABLE 61. LIVEPERSON, INC: FINANCIALS
TABLE 62. LIVEPERSON, INC: PRODUCTS & SERVICES
TABLE 63. LIVEPERSON, INC: RECENT DEVELOPMENTS
TABLE 64. ZENDESK INC: FINANCIALS
TABLE 65. ZENDESK INC: PRODUCTS & SERVICES
TABLE 66. ZENDESK INC: RECENT DEVELOPMENTS
TABLE 67. SNAPENGAGE: FINANCIALS
TABLE 68. SNAPENGAGE: PRODUCTS & SERVICES
TABLE 69. SNAPENGAGE: RECENT DEVELOPMENTS
TABLE 70. LIVECHAT, INC: FINANCIALS
TABLE 71. LIVECHAT, INC: PRODUCTS & SERVICES
TABLE 72. LIVECHAT, INC: RECENT DEVELOPMENTS
TABLE 73. OLARK: FINANCIALS
TABLE 74. OLARK: PRODUCTS & SERVICES
TABLE 75. OLARK: RECENT DEVELOPMENTS
TABLE 76. KAYAKO, INC: FINANCIALS
TABLE 77. KAYAKO, INC: PRODUCTS & SERVICES
TABLE 78. KAYAKO, INC: RECENT DEVELOPMENTS
Research Framework
Infoholic Research works on a holistic 360° approach in order to deliver high quality, validated and reliable information in our market reports. The Market estimation and forecasting involves following steps:
- Data Collation (Primary & Secondary)
- In-house Estimation (Based on proprietary data bases and Models)
- Market Triangulation
- Forecasting

Market related information is congregated from both primary and secondary sources.
Primary sources
Involved participants from all global stakeholders such as Solution providers, service providers, Industry associations, thought leaders etc. across levels such as CXOs, VPs and managers. Plus, our in-house industry experts having decades of industry experience contribute their consulting and advisory services.
Secondary sources
Include public sources such as regulatory frameworks, government IT spending, government demographic indicators, industry association statistics, and company publications along with paid sources such as Factiva, OneSource, Bloomberg among others.
![]()


