
Lactose-free product market by Type (Milk, Plain, Flavored, Yogurt, Set, Other milk types, Drinking/ Ambient, Regular, Other yogurt types, Probiotic, Cheese, Hard, Cheddar, Cottage, Soft, Other cheese types, Confectionery products, Ice cream, and Other types), Form (Lactose-free, No added sugar products/ reduced sugar claims and Reduced Lactose Products), Category (Organic and Inorganic) and Geography – Global Forecast up to 2026
- March, 2021
- Domain: Chemicals, Materials & Food - Agro, Pharma, Food & Personal Care
- Get Free 10% Customization in this Report
Lactose is considered the primary source of energy and sugar molecule which exists in milk. Lactose contains two types of sugar which are glucose and galactose. Lactose-free food products are those products that are mainly prepared with no lactose in them. In lactose-free food products, the amount of lactose is minimized or eliminated. This is obtained by fragmenting the lactose molecule that exists in the food within the glucose and galactose. Growing awareness among the public regarding the health benefits of lactose-free food products is expected to propel the lactose-free product market. The rapidly growing number of patients with lactose intolerance is also another factor to drive the market growth. Besides that, the high costs of lactose-free food products may limit the lactose-free products market growth. The Lactose-Free Products Market is estimated to grow at the rate of 8.8% CAGR by 2026.
Research Methodology:
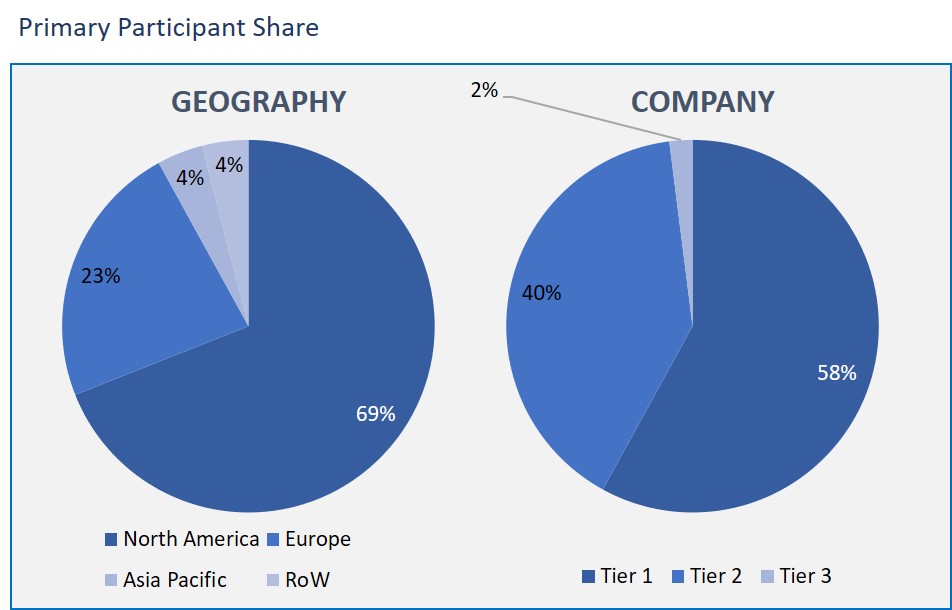
The Lactose-free product market has been analyzed by utilizing the optimum combination of secondary sources and in-house methodology and a unique balance of primary insights. The real-time valuation of the market is an integral part of our forecasting and market sizing methodology. Industry experts and our primary participants have helped to compile related aspects with accurate parametric estimations for a complete study. The primary participants share is given below:
Lactose-Free Products Market by Type
- Milk
- Plain
- Flavored
- Yogurt
- Set
- Other milk types
- Drinking/ Ambient
- Regular
- Other yogurt types
- Probiotic
- Cheese
- Hard
- Cheddar
- Cottage
- Soft
- Other cheese types
- Confectionery products
- Ice cream
- Other types
Lactose-Free Products Market by Form
- Lactose-free
- No added sugar products/ reduced sugar claims
- Reduced Lactose Products
Lactose-Free Products Market by Category
- Organic
- Inorganic
Lactose-Free Products Market by Geography
- North America
- Europe
- Asia Pacific
- Rest of the World
In the lactose-free products market type segmentation, the milk segment accounted for the market's highest share. This is due to the enriched benefits of the lactose-free milk, such as rich in calcium, phosphorus, vitamin B12, and vitamin D. In the production process of lactose-free milk, lactase is added due to which the lactose-free milk tastes sweeter than conventional milk and also helps in breaking the lactose into two forms of sugar.
As observed in the market based on form, the lactose-free product's market is segregated into Lactose-free, No added sugar products/ reduced sugar claims, and Reduced Lactose Products. The no added sugar products or reduced sugar claims are expected to have the highest CAGR in the market growth. The highest growth rate is ascribed to increasing consciousness towards fitness and concern about health issues such as obesity and diabetes, increasing demand for sugar-free or no added sugar products.
Based on category, the market is bifurcated into organic and inorganic. The organic segment is expected to have the maximum share in the market. This is due to the extreme benefits of organic milk products. The organic milk is taken from cows raised without antibiotics added growth hormones since the antibiotics, and added growth hormones are harmful up to a level. Hence, these are the reasons supporting the high growth of this segment.
As per the market based on geography, the Asia Pacific region is expected to hold the largest share. Drastic urbanization, increasing preference for expensive & healthy food & beverages, and rising per capita income are factors driving the market growth in this region.
The rapidly increasing lactose intolerant population is the primary driver of global market growth. The majority of the people in few regions around the world are prone to lactose intolerance. Moreover, the self-diagnosis of lactose intolerance is increasing, making consumers more concerned about their health and investing in self-diagnosis, which is surging the demand for market growth.
This report gives the Key player's profiles of the market-Danone Company S.A., Gujarat Cooperative Milk Marketing Federation, Dairy Farmers of America, Inc., Valio LTD, Nestle S.A., Johnson & Johnson Services, Inc., The Coca-Cola Company, General Mills, Inc., Lifeway Foods, Inc., Lala U.S., and Organic Valley.
The dairy industry is witnessing an enormous transformation as consumer tastes are constantly changing. Consumers have perceived that traditional dairy is imperfect for their consumption owing to the more lactose levels in the dairy products, thus opening the way for the future of lactose-free dairy products.
- The report gives deep-dive insights into the significant operative strategies focusing on the R&D strategies, localization strategies, manufacturing capabilities, and market vendors' sales performance.
- Research provides an outline of the product portfolio, including product launching, development, and positioning.
- The study offers an analysis of the market share and predicts the present and future lactose-free food market.
- The report also analyzes the competitive outlook, competitor's market shares, and supply chain structures.
- Executive Summary
- Industry Outlook
- Industry Overview
- Industry Trends
- Market Snapshot
- Market Definition
- Market Outlook
- Porter Five Forces
- Related Markets
- Market characteristics
- Market Overview
- Market Segmentation
- Market Dynamics
- Drivers
- Restraints
- Opportunities
- DRO - Impact Analysis
- Type: Market Size & Analysis
- Overview
- Milk
- Plain
- Flavored
- Yogurt
- Set
- Other milk types
- Drinking/ Ambient
- Regular
- Other yogurt types
- Probiotic
- Cheese
- Hard
- Cheddar
- Cottage
- Soft
- Other cheese types
- Confectionery products
- Ice cream
- Other types
- Form: Market Size & Analysis
- Overview
- Lactose-free
- No added sugar products/ reduced sugar claims
- Reduced Lactose Products
- Category: Market Size & Analysis
- Overview
- Organic
- Inorganic
- Geography: Market Size & Analysis
- Overview
- North America
- Europe
- Asia Pacific
- Rest of the World
- Competitive Landscape
- Competitor Comparison Analysis
- Market Developments
- Mergers and Acquisitions, Legal, Awards, Partnerships
- Product Launches and execution
- Vendor Profiles
- Danone Company S.A.
- Overview
- Financial Overview
- Product Offerings
- Developments
- Business Strategy
- Gujarat Cooperative Milk Marketing Federation
- Overview
- Financial Overview
- Product Offerings
- Developments
- Business Strategy
- Dairy Farmers of America, Inc.
- Overview
- Financial Overview
- Product Offerings
- Developments
- Business Strategy
- Valio LTD
- Overview
- Financial Overview
- Product Offerings
- Developments
- Business Strategy
- Nestle S.A.
- Overview
- Financial Overview
- Product Offerings
- Developments
- Business Strategy
- Johnson & Johnson Services, Inc.
- Overview
- Financial Overview
- Product Offerings
- Developments
- Business Strategy
- The Coca-Cola Company
- Overview
- Financial Overview
- Product Offerings
- Developments
- Business Strategy
- General Mills, Inc.
- Overview
- Financial Overview
- Product Offerings
- Developments
- Business Strategy
- Lifeway Foods, Inc.
- Overview
- Financial Overview
- Product Offerings
- Developments
- Business Strategy
- Lala U.S.
- Overview
- Financial Overview
- Product Offerings
- Developments
- Business Strategy
- Danone Company S.A.
- Companies to Watch
- Organic Valley
- Overview
- Products & Services
- Business Strategy
- Organic Valley
- Analyst Opinion
- Annexure
- Report Scope
- Market Definitions
- Research Methodology
- Data Collation and In-house Estimation
- Market Triangulation
- Forecasting
- Report Assumptions
- Declarations
- Stakeholders
- Abbreviations
TABLE 1. GLOBAL LACTOSE-FREE PRODUCTS MARKET VALUE, BY TYPE, 2020-2026 (USD BILLION)
TABLE 2. GLOBAL LACTOSE-FREE PRODUCTS MARKET VALUE FOR MILK, BY GEOGRAPHY, 2020-2026 (USD BILLION)
TABLE 3. GLOBAL LACTOSE-FREE PRODUCTS MARKET VALUE FOR PLAIN, BY GEOGRAPHY, 2020-2026 (USD BILLION)
TABLE 4. GLOBAL LACTOSE-FREE PRODUCTS MARKET VALUE FOR FLAVORED, BY GEOGRAPHY, 2020-2026 (USD BILLION)
TABLE 5. GLOBAL LACTOSE-FREE PRODUCTS MARKET VALUE FOR YOGURT, BY GEOGRAPHY, 2020-2026 (USD BILLION)
TABLE 6. GLOBAL LACTOSE-FREE PRODUCTS MARKET VALUE FOR SET, BY GEOGRAPHY, 2020-2026 (USD BILLION)
TABLE 7. GLOBAL LACTOSE-FREE PRODUCTS MARKET VALUE FOR OTHER MILK TYPES, BY GEOGRAPHY, 2020-2026 (USD BILLION)
TABLE 8. GLOBAL LACTOSE-FREE PRODUCTS MARKET VALUE FOR DRINKING/ AMBIENT, BY GEOGRAPHY, 2020-2026 (USD BILLION)
TABLE 9. GLOBAL LACTOSE-FREE PRODUCTS MARKET VALUE FOR REGULAR, BY GEOGRAPHY, 2020-2026 (USD BILLION)
TABLE 10. GLOBAL LACTOSE-FREE PRODUCTS MARKET VALUE FOR OTHER YOGURT TYPES, BY GEOGRAPHY, 2020-2026 (USD BILLION)
TABLE 11. GLOBAL LACTOSE-FREE PRODUCTS MARKET VALUE FOR PROBIOTIC, BY GEOGRAPHY, 2020-2026 (USD BILLION)
TABLE 12. GLOBAL LACTOSE-FREE PRODUCTS MARKET VALUE FOR CHEESE, BY GEOGRAPHY, 2020-2026 (USD BILLION)
TABLE 13. GLOBAL LACTOSE-FREE PRODUCTS MARKET VALUE FOR HARD, BY GEOGRAPHY, 2020-2026 (USD BILLION)
TABLE 14. GLOBAL LACTOSE-FREE PRODUCTS MARKET VALUE FOR CHEDDAR, BY GEOGRAPHY, 2020-2026 (USD BILLION)
TABLE 15. GLOBAL LACTOSE-FREE PRODUCTS MARKET VALUE FOR COTTAGE, BY GEOGRAPHY, 2020-2026 (USD BILLION)
TABLE 16. GLOBAL LACTOSE-FREE PRODUCTS MARKET VALUE FOR SOFT, BY GEOGRAPHY, 2020-2026 (USD BILLION)
TABLE 17. GLOBAL LACTOSE-FREE PRODUCTS MARKET VALUE FOR OTHER CHEESE TYPES, BY GEOGRAPHY, 2020-2026 (USD BILLION)
TABLE 18. GLOBAL LACTOSE-FREE PRODUCTS MARKET VALUE FOR CONFECTIONERY PRODUCTS, BY GEOGRAPHY, 2020-2026 (USD BILLION)
TABLE 19. GLOBAL LACTOSE-FREE PRODUCTS MARKET VALUE FOR ICE CREAM, BY GEOGRAPHY, 2020-2026 (USD BILLION)
TABLE 20. GLOBAL LACTOSE-FREE PRODUCTS MARKET VALUE FOR OTHER TYPES, BY GEOGRAPHY, 2020-2026 (USD BILLION)
TABLE 21. GLOBAL LACTOSE-FREE PRODUCTS MARKET VALUE, BY FORM, 2020-2026 (USD BILLION)
TABLE 22. GLOBAL LACTOSE-FREE PRODUCTS MARKET VALUE FOR ORGANIC, BY GEOGRAPHY, 2020-2026 (USD BILLION)
TABLE 23. GLOBAL LACTOSE-FREE PRODUCTS MARKET VALUE FOR INORGANIC, BY GEOGRAPHY, 2020-2026 (USD BILLION)
TABLE 24. NORTH AMERICA LACTOSE-FREE PRODUCTS MARKET VALUE, BY COUNTRY, 2020-2026 (USD BILLION)
TABLE 25. NORTH AMERICA LACTOSE-FREE PRODUCTS MARKET VALUE, BY TYPE, 2020-2026 (USD BILLION)
TABLE 26. NORTH AMERICA LACTOSE-FREE PRODUCTS MARKET VALUE, BY FORM, 2020-2026 (USD BILLION)
TABLE 27. NORTH AMERICA LACTOSE-FREE PRODUCTS MARKET VALUE, BY CATEGORY, 2020-2026 (USD BILLION)
TABLE 28. U.S LACTOSE-FREE PRODUCTS MARKET VALUE, BY TYPE, 2020-2026 (USD BILLION)
TABLE 29. U.S LACTOSE-FREE PRODUCTS MARKET VALUE, BY FORM, 2020-2026 (USD BILLION)
TABLE 30. U.S LACTOSE-FREE PRODUCTS MARKET VALUE, BY CATEGORY, 2020-2026 (USD BILLION)
TABLE 31. CANADA LACTOSE-FREE PRODUCTS MARKET VALUE, BY TYPE, 2020-2026 (USD BILLION)
TABLE 32. CANADA LACTOSE-FREE PRODUCTS MARKET VALUE, BY FORM, 2020-2026 (USD BILLION)
TABLE 33. CANADA LACTOSE-FREE PRODUCTS MARKET VALUE, BY CATEGORY, 2020-2026 (USD BILLION)
TABLE 34. EUROPE LACTOSE-FREE PRODUCTS MARKET VALUE, BY COUNTRY, 2020-2026 (USD BILLION)
TABLE 35. EUROPE LACTOSE-FREE PRODUCTS MARKET VALUE, BY TYPE, 2020-2026 (USD BILLION)
TABLE 36. EUROPE LACTOSE-FREE PRODUCTS MARKET VALUE, BY FORM, 2020-2026 (USD BILLION)
TABLE 37. EUROPE LACTOSE-FREE PRODUCTS MARKET VALUE, CATEGORY, 2020-2026 (USD BILLION)
TABLE 38. GERMANY LACTOSE-FREE PRODUCTS MARKET VALUE, BY TYPE, 2020-2026 (USD BILLION)
TABLE 39. GERMANY LACTOSE-FREE PRODUCTS MARKET VALUE, BY FORM, 2020-2026 (USD BILLION)
TABLE 40. GERMANY LACTOSE-FREE PRODUCTS MARKET VALUE, BY CATEGORY, 2020-2026 (USD BILLION)
TABLE 41. U.K LACTOSE-FREE PRODUCTS MARKET VALUE, BY TYPE, 2020-2026 (USD BILLION)
TABLE 42. U.K LACTOSE-FREE PRODUCTS MARKET VALUE, BY FORM, 2020-2026 (USD BILLION)
TABLE 43. U.K LACTOSE-FREE PRODUCTS MARKET VALUE, BY CATEGORY, 2020-2026 (USD BILLION)
TABLE 44. FRANCE LACTOSE-FREE PRODUCTS MARKET VALUE, BY TYPE, 2020-2026 (USD BILLION)
TABLE 45. FRANCE LACTOSE-FREE PRODUCTS MARKET VALUE, BY FORM, 2020-2026 (USD BILLION)
TABLE 46. FRANCE LACTOSE-FREE PRODUCTS MARKET VALUE, BY CATEGORY, 2020-2026 (USD BILLION)
TABLE 47. ITALY LACTOSE-FREE PRODUCTS MARKET VALUE, BY TYPE, 2020-2026 (USD BILLION)
TABLE 48. ITALY LACTOSE-FREE PRODUCTS MARKET VALUE, BY FORM, 2020-2026 (USD BILLION)
TABLE 49. ITALY LACTOSE-FREE PRODUCTS MARKET VALUE, BY CATEGORY, 2020-2026 (USD BILLION)
TABLE 50. SPAIN LACTOSE-FREE PRODUCTS MARKET VALUE, BY TYPE, 2020-2026 (USD BILLION)
TABLE 51. SPAIN LACTOSE-FREE PRODUCTS MARKET VALUE, BY FORM, 2020-2026 (USD BILLION)
TABLE 52. SPAIN LACTOSE-FREE PRODUCTS MARKET VALUE, BY CATEGORY, 2020-2026 (USD BILLION)
TABLE 53. ROE LACTOSE-FREE PRODUCTS MARKET VALUE, BY TYPE, 2020-2026 (USD BILLION)
TABLE 54. ROE LACTOSE-FREE PRODUCTS MARKET VALUE, BY FORM, 2020-2026 (USD BILLION)
TABLE 55. ROE LACTOSE-FREE PRODUCTS MARKET VALUE, BY CATEGORY, 2020-2026 (USD BILLION)
TABLE 56. ASIA PACIFIC LACTOSE-FREE PRODUCTS MARKET VALUE, BY COUNTRY, 2020-2026 (USD BILLION)
TABLE 57. ASIA PACIFIC LACTOSE-FREE PRODUCTS MARKET VALUE, BY TYPE, 2020-2026 (USD BILLION)
TABLE 58. ASIA PACIFIC LACTOSE-FREE PRODUCTS MARKET VALUE, BY FORM, 2020-2026 (USD BILLION)
TABLE 59. ASIA PACIFIC LACTOSE-FREE PRODUCTS MARKET VALUE, BY CATEGORY, 2020-2026 (USD BILLION)
TABLE 60. CHINA LACTOSE-FREE PRODUCTS MARKET VALUE, BY TYPE, 2020-2026 (USD BILLION)
TABLE 61. CHINA LACTOSE-FREE PRODUCTS MARKET VALUE, BY FORM, 2020-2026 (USD BILLION)
TABLE 62. CHINA LACTOSE-FREE PRODUCTS MARKET VALUE, BY CATEGORY, 2020-2026 (USD BILLION)
TABLE 63. INDIA LACTOSE-FREE PRODUCTS MARKET VALUE, BY TYPE, 2020-2026 (USD BILLION)
TABLE 64. INDIA LACTOSE-FREE PRODUCTS MARKET VALUE, BY FORM, 2020-2026 (USD BILLION)
TABLE 65. INDIA LACTOSE-FREE PRODUCTS MARKET VALUE, BY CATEGORY, 2020-2026 (USD BILLION)
TABLE 66. JAPAN LACTOSE-FREE PRODUCTS MARKET VALUE, BY TYPE, 2020-2026 (USD BILLION)
TABLE 67. JAPAN LACTOSE-FREE PRODUCTS MARKET VALUE, BY FORM, 2020-2026 (USD BILLION)
TABLE 68. JAPAN LACTOSE-FREE PRODUCTS MARKET VALUE, BY CATEGORY, 2020-2026 (USD BILLION)
TABLE 69. REST OF APAC LACTOSE-FREE PRODUCTS MARKET VALUE, BY TYPE, 2020-2026 (USD BILLION)
TABLE 70. REST OF APAC LACTOSE-FREE PRODUCTS MARKET VALUE, BY FORM, 2020-2026 (USD BILLION)
TABLE 71. REST OF APAC LACTOSE-FREE PRODUCTS MARKET VALUE, BY CATEGORY, 2020-2026 (USD BILLION)
TABLE 72. REST OF WORLD LACTOSE-FREE PRODUCTS MARKET VALUE, BY TYPE, 2020-2026 (USD BILLION)
TABLE 73. REST OF WORLD LACTOSE-FREE PRODUCTS MARKET VALUE, BY FORM, 2020-2026 (USD BILLION)
TABLE 74. REST OF WORLD LACTOSE-FREE PRODUCTS MARKET VALUE, BY CATEGORY, 2020-2026 (USD BILLION)
TABLE 75. DANONE COMPANY S.A.: FINANCIALS
TABLE 76. DANONE COMPANY S.A.: PRODUCTS & SERVICES
TABLE 77. DANONE COMPANY S.A.: RECENT DEVELOPMENT
TABLE 78. GUJARAT COOPERATIVE MILK MARKETING FEDERATION: FINANCIALS
TABLE 79. GUJARAT COOPERATIVE MILK MARKETING FEDERATION: PRODUCTS & SERVICES
TABLE 80. GUJARAT COOPERATIVE MILK MARKETING FEDERATION: RECENT DEVELOPMENT
TABLE 81. DAIRY FARMERS OF AMERICA, INC: FINANCIALS
TABLE 82. DAIRY FARMERS OF AMERICA, INC: PRODUCTS & SERVICES
TABLE 83. DAIRY FARMERS OF AMERICA, INC: RECENT DEVELOPMENTS
TABLE 84. VALIO LTD: FINANCIALS
TABLE 85. VALIO LTD: PRODUCTS & SERVICES
TABLE 86. VALIO LTD: RECENT DEVELOPMENTS
TABLE 87. NESTLE S.A.: FINANCIALS
TABLE 88. NESTLE S.A.: PRODUCTS & SERVICES
TABLE 89. NESTLE S.A.: RECENT DEVELOPMENTS
TABLE 90. JOHNSON & JOHNSON SERVICES, INC: FINANCIALS
TABLE 91. JOHNSON & JOHNSON SERVICES, INC: PRODUCTS & SERVICES
TABLE 92. JOHNSON & JOHNSON SERVICES, INC: RECENT DEVELOPMENTS
TABLE 93. THE COCA-COLA COMPANY: FINANCIALS
TABLE 94. THE COCA-COLA COMPANY: PRODUCTS & SERVICES
TABLE 95. THE COCA-COLA COMPANY: RECENT DEVELOPMENTS
TABLE 96. GENERAL MILLS, INC: FINANCIALS
TABLE 97. GENERAL MILLS, INC: PRODUCTS & SERVICES
TABLE 98. GENERAL MILLS, INC: RECENT DEVELOPMENTS
TABLE 99. LIFEWAY FOODS, INC: FINANCIALS
TABLE 100. LIFEWAY FOODS, INC: PRODUCTS & SERVICES
TABLE 101. LIFEWAY FOODS, INC: RECENT DEVELOPMENTS
TABLE 102. LALA U.S.: FINANCIALS
TABLE 103. LALA U.S.: PRODUCTS & SERVICES
TABLE 104. LALA U.S.: RECENT DEVELOPMENTS
TABLE 105. ORGANIC VALLEY: PRODUCTS & SERVICES
Research Framework
Infoholic Research works on a holistic 360° approach in order to deliver high quality, validated and reliable information in our market reports. The Market estimation and forecasting involves following steps:
- Data Collation (Primary & Secondary)
- In-house Estimation (Based on proprietary data bases and Models)
- Market Triangulation
- Forecasting

Market related information is congregated from both primary and secondary sources.
Primary sources
Involved participants from all global stakeholders such as Solution providers, service providers, Industry associations, thought leaders etc. across levels such as CXOs, VPs and managers. Plus, our in-house industry experts having decades of industry experience contribute their consulting and advisory services.
Secondary sources
Include public sources such as regulatory frameworks, government IT spending, government demographic indicators, industry association statistics, and company publications along with paid sources such as Factiva, OneSource, Bloomberg among others.
![]()


