
Laboratory Informatics Market based on Product (Laboratory Information Management Systems, Electronic Lab Notebooks, Scientific Data Management Systems, Laboratory Execution Systems, Electronic Data Capture & Clinical Data Management Systems, Chromatography Data Systems, and Enterprise Content Management), Delivery Mode (On-premise, Web-hosted and Cloud-based), Component (Software and Services), End-Use (Life Sciences, Chemical Industry, CROs, Food and Beverage and Agriculture Industries, Environmental Testing Laboratories, Petrochemical Refineries & Oil and Gas Industry and Other Industries) and Geography – Global Forecast up to 2026
- May, 2021
- Domain: ICT - Software & Services
- Get Free 10% Customization in this Report
Laboratory informatics is elucidated as the specialized application of information technology to enhance and expand laboratory operations with instruments, software, and data management tools. This enables scientific data to be recorded, migrated, processed, and elucidated for instant use and stored, managed, and shared to assist in upcoming research and development and in-lab testing efforts while improving the efficacy of laboratory operations. With the increasing load of work, cost restraints, and advancements in technologies, the nature of pathology is rapidly shifting, driving the market growth. Further, the rising deployment of laboratory information management systems in assisting hospital-based laboratories in eliminating diagnostic errors and managing huge volumes of data is predicted to drive market growth. On the contrary, the high costs incurred in maintenance and services are likely to limit the market growth. The Laboratory Informatics Market is estimated to grow at the rate of 7.4% CAGR by 2026.
Research Methodology:
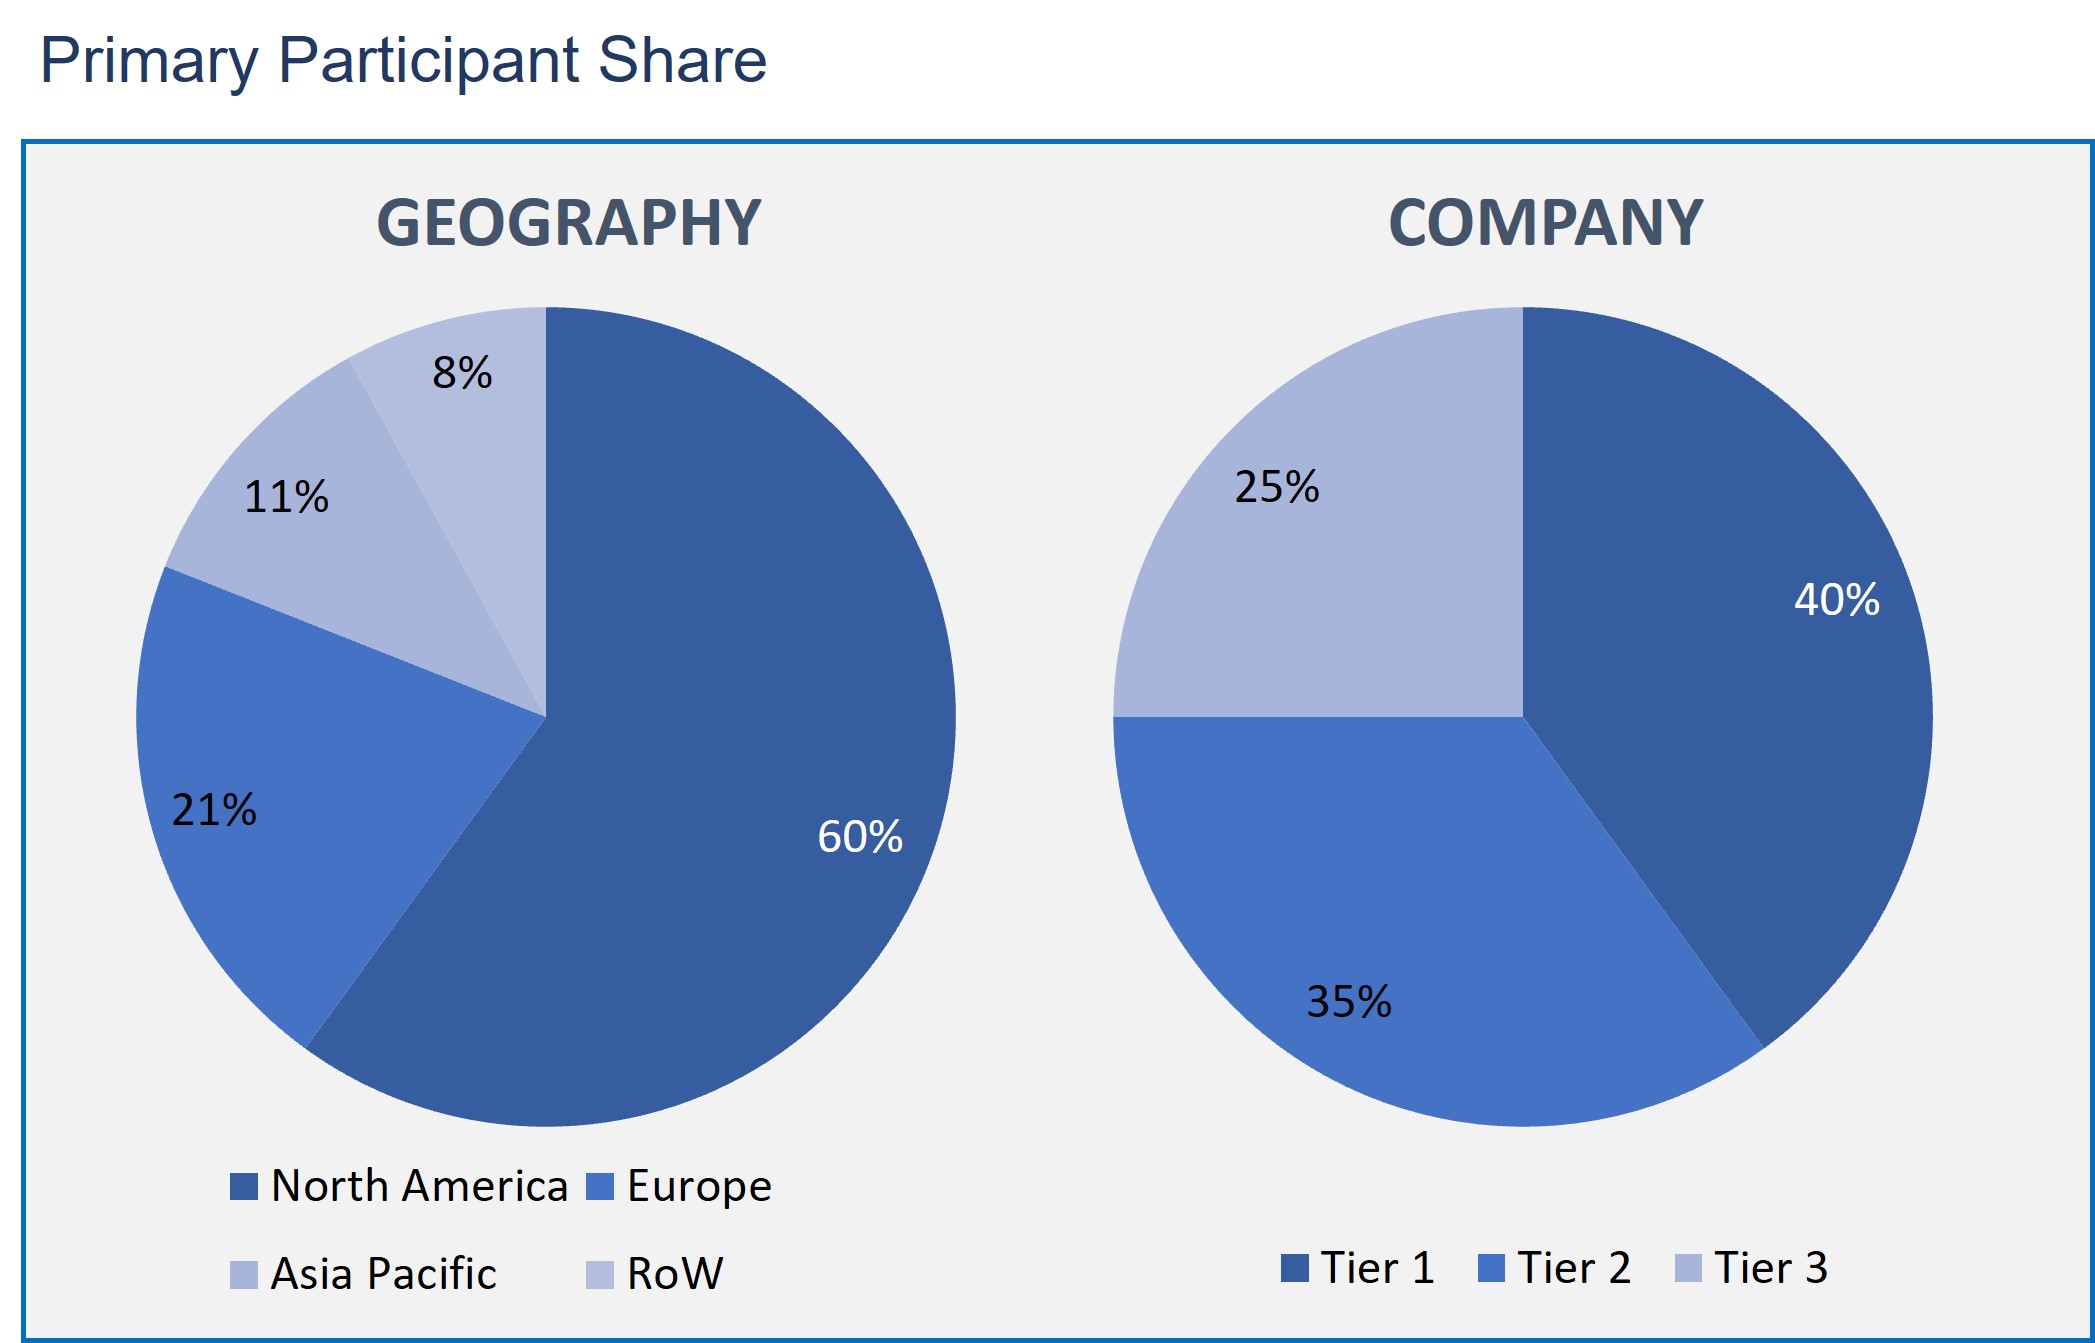
The Laboratory informatics Market has been analyzed by utilizing the optimum combination of secondary sources and in-house methodology and a unique balance of primary insights. The real-time valuation of the market is an integral part of our forecasting and market sizing methodology. Industry experts and our primary participants have helped to compile related aspects with accurate parametric estimations for a complete study. The primary participants share is given below:
Laboratory Informatics Market by Product
- Laboratory Information Management Systems (LIMS)
- Electronic Lab Notebooks (ELN)
- Scientific Data Management Systems (SDMS)
- Laboratory Execution Systems (LES)
- Electronic Data Capture (EDC) & Clinical Data Management Systems (CDMS)
- Chromatography Data Systems (CDS)
- Enterprise Content Management (ECM)
Laboratory Informatics Market by Delivery Mode
- On-premise
- Web-hosted
- Cloud-based
Laboratory Informatics Market by Component
- Software
- Services
Laboratory Informatics Market by End-use
- Life Sciences
- CROs
- Chemical Industry
- Food and Beverage and Agriculture Industries
- Environmental Testing Laboratories
- Petrochemical Refineries & Oil and Gas Industry
- Other Industries
Laboratory Informatics Market by Geography
- North America
- Europe
- Asia Pacific
- Rest of the World
In the Product segment, LIMS has a significant share in the market growth. To reduce data management errors and enhance the quality analysis of research information, the LIMS solution is mainly adopted in the life sciences and research industry. These factors are expected to augment the growth of the segment.
Cloud-based delivery mode assists in storing a huge volume of data remotely to facilitate free space on devices and allows data retrieval as per the customer's requirement. Therefore, the cloud-based delivery mode is having a significant share in the laboratory informatics market.
The service segment is accounted for the highest share in the market growth. This is due to the increase in the outsourcing of LIMS solution and increasing requirement of the outsourced services by large pharmaceutical research labs since they lack in resources and skill set required for deployment of analytics.
As per the end-users, the significant end-users of laboratory informatics are the life science industry. Demand for laboratory informatics has increased in the life science industry to develop innovative products and enhance the quality of products and operational efficiency.
North America is commanding the market share due to the factors such as strategies supporting the adoption of laboratory informatics and infrastructure with high digital literacy. Moreover, surging healthcare costs and the increasing burden of curtailing the costs are also factors contributing to market growth in this region.
Increasing demand for data integration is a primary factor contributing to the growth of the global market. The rising amount of data is being gathered within the scientific and life science community. Since millions of dollars are expending on research and development activities by the pharmaceutical and biotechnological sector, the volume of data produced is generous. Proper processing and coming to a successful conclusion from gathered data need data integration solutions. A huge amount of data collection and a rising need for real-time outcomes will propel business growth in the future.
Key players operating in the market include Labvantage Solutions, Inc., Thermo Fisher Scientific Inc., Accelerated Technology Laboratories, Lablynx, Inc., Agilent Technologies, Inc., Autoscribe Informatics, Dassault Systems, Labworks LLC, Labware, Kinematik, Waters, and Perkinelmer Inc.
As a result, the laboratory information system has an essential requirement due to the increasing amount of data. Moreover, the laboratory informatics software provides an organization with various benefits, which reduces work and data management errors.
- This report describes how the various attributes are impacting the market growth in the forecast period.
- This research provides a detailed analysis of the segments and sub-segments of the market and their key contributions to market growth.
- This report comprises the exclusive depiction of the competitive outlook coupled with key strategies deployed by the market competitors.
- This study also includes quantitative analysis of the market in terms of geography, which provides a perception of the regional market.
- Executive Summary
- Industry Outlook
- Industry Overview
- Industry Trends
- Market Snapshot
- Market Definition
- Market Outlook
- Porter Five Forces
- Related Markets
- Market characteristics
- Market Overview
- Market Segmentation
- Market Dynamics
- Drivers
- Restraints
- Opportunities
- DRO - Impact Analysis
- Product: Market Size & Analysis
- Overview
- Laboratory Information Management Systems (LIMS)
- Electronic Lab Notebooks (ELN)
- Scientific Data Management Systems (SDMS)
- Laboratory Execution Systems (LES)
- Electronic Data Capture (EDC) & Clinical Data Management Systems (CDMS)
- Chromatography Data Systems (CDS)
- Enterprise Content Management (ECM)
- Delivery Mode: Market Size & Analysis
- Overview
- On-premise
- Web-hosted
- Cloud-based
- Component: Market Size & Analysis
- Overview
- Software
- Services
- End-Use: Market Size & Analysis
- Overview
- Life Sciences
- CROs
- Chemical Industry
- Food and Beverage and Agriculture Industries
- Environmental Testing Laboratories
- Petrochemical Refineries & Oil and Gas Industry
- Other Industries
- Geography: Market Size & Analysis
- Overview
- North America
- Europe
- Asia Pacific
- Rest of the World
- Competitive Landscape
- Competitor Comparison Analysis
- Market Developments
- Mergers and Acquisitions, Legal, Awards, Partnerships
- Product Launches and execution
- Vendor Profiles
- Labvantage Solutions, Inc.
- Overview
- Financial Overview
- Product Offerings
- Developments
- Business Strategy
- Thermo Fisher Scientific Inc.
- Overview
- Financial Overview
- Product Offerings
- Developments
- Business Strategy
- Accelerated Technology Laboratories
- Overview
- Financial Overview
- Product Offerings
- Developments
- Business Strategy
- Lablynx, Inc.
- Overview
- Financial Overview
- Product Offerings
- Developments
- Business Strategy
- Agilent Technologies, Inc.
- Overview
- Financial Overview
- Product Offerings
- Developments
- Business Strategy
- Autoscribe Informatics
- Overview
- Financial Overview
- Product Offerings
- Developments
- Business Strategy
- Dassault Systems
- Overview
- Financial Overview
- Product Offerings
- Developments
- Business Strategy
- Labworks llc
- Overview
- Financial Overview
- Product Offerings
- Developments
- Business Strategy
- Labware
- Overview
- Financial Overview
- Product Offerings
- Developments
- Business Strategy
- Kinematik
- Overview
- Financial Overview
- Product Offerings
- Developments
- Business Strategy
- Labvantage Solutions, Inc.
- Companies to Watch
- Waters
- Overview
- Products & Services
- Business Strategy
- Perkinelmer Inc.
- Overview
- Products & Services
- Business Strategy
- Waters
- Analyst Opinion
- Annexure
- Report Scope
- Market Definitions
- Research Methodology
- Data Collation and In-house Estimation
- Market Triangulation
- Forecasting
- Report Assumptions
- Declarations
- Stakeholders
- Abbreviations
TABLE 1. GLOBAL LABORATORY INFORMATICS MARKET VALUE, BY PRODUCT, 2020-2026 (USD BILLION)
TABLE 2. GLOBAL LABORATORY INFORMATICS MARKET VALUE FOR LABORATORY INFORMATION MANAGEMENT SYSTEMS (LIMS), BY GEOGRAPHY, 2020-2026 (USD BILLION)
TABLE 3. GLOBAL LABORATORY INFORMATICS MARKET VALUE FOR ELECTRONIC LAB NOTEBOOKS (ELN), BY GEOGRAPHY, 2020-2026 (USD BILLION)
TABLE 4. GLOBAL LABORATORY INFORMATICS MARKET VALUE FOR SCIENTIFIC DATA MANAGEMENT SYSTEMS (SDMS), BY GEOGRAPHY, 2020-2026 (USD BILLION)
TABLE 5. GLOBAL LABORATORY INFORMATICS MARKET VALUE FOR LABORATORY EXECUTION SYSTEMS (LES), BY GEOGRAPHY, 2020-2026 (USD BILLION)
TABLE 6. GLOBAL LABORATORY INFORMATICS MARKET VALUE FOR ELECTRONIC DATA CAPTURE (EDC) & CLINICAL DATA MANAGEMENT SYSTEMS (CDMS), BY GEOGRAPHY, 2020-2026 (USD BILLION)
TABLE 7. GLOBAL LABORATORY INFORMATICS MARKET VALUE FOR CHROMATOGRAPHY DATA SYSTEMS (CDS), BY GEOGRAPHY, 2020-2026 (USD BILLION)
TABLE 8. GLOBAL LABORATORY INFORMATICS MARKET VALUE FOR ENTERPRISE CONTENT MANAGEMENT (ECM), BY GEOGRAPHY, 2020-2026 (USD BILLION)
TABLE 9. GLOBAL LABORATORY INFORMATICS MARKET VALUE, BY DELIVERY MODE, 2020-2026 (USD BILLION)
TABLE 10. GLOBAL LABORATORY INFORMATICS MARKET VALUE FOR ON-PREMISE, BY GEOGRAPHY, 2020-2026 (USD BILLION)
TABLE 11. GLOBAL LABORATORY INFORMATICS MARKET VALUE FOR WEB-HOSTED, BY GEOGRAPHY, 2020-2026 (USD BILLION)
TABLE 12. GLOBAL LABORATORY INFORMATICS MARKET VALUE FOR CLOUD-BASED, BY GEOGRAPHY, 2020-2026 (USD BILLION)
TABLE 13. GLOBAL LABORATORY INFORMATICS MARKET VALUE, BY COMPONENT, 2020-2026 (USD BILLION)
TABLE 14. GLOBAL LABORATORY INFORMATICS MARKET VALUE FOR SOFTWARE, 2020-2026 (USD BILLION)
TABLE 15. GLOBAL LABORATORY INFORMATICS MARKET VALUE FOR SERVICES, BY GEOGRAPHY, 2020-2026 (USD BILLION)
TABLE 16. GLOBAL LABORATORY INFORMATICS MARKET VALUE, END-USE, 2020-2026 (USD BILLION)
TABLE 17. GLOBAL LABORATORY INFORMATICS MARKET VALUE FOR LIFE SCIENCES, BY GEOGRAPHY, 2020-2026 (USD BILLION)
TABLE 18. GLOBAL LABORATORY INFORMATICS MARKET VALUE FOR CROS, BY GEOGRAPHY, 2020-2026 (USD BILLION)
TABLE 19. GLOBAL LABORATORY INFORMATICS MARKET VALUE FOR CHEMICAL INDUSTRY, BY GEOGRAPHY, 2020-2026 (USD BILLION)
TABLE 20. GLOBAL LABORATORY INFORMATICS MARKET VALUE FOR FOOD AND BEVERAGE AND AGRICULTURE INDUSTRIES, BY GEOGRAPHY, 2020-2026 (USD BILLION)
TABLE 21. GLOBAL LABORATORY INFORMATICS MARKET VALUE FOR ENVIRONMENTAL TESTING LABORATORIES, BY GEOGRAPHY, 2020-2026 (USD BILLION)
TABLE 22. GLOBAL LABORATORY INFORMATICS MARKET VALUE FOR PETROCHEMICAL REFINERIES & OIL AND GAS INDUSTRY, BY GEOGRAPHY, 2020-2026 (USD BILLION)
TABLE 23. GLOBAL LABORATORY INFORMATICS MARKET VALUE FOR OTHER INDUSTRIES, BY GEOGRAPHY, 2020-2026 (USD BILLION)
TABLE 24. NORTH AMERICA LABORATORY INFORMATICS MARKET VALUE, BY COUNTRY, 2020-2026 (USD BILLION)
TABLE 25. NORTH AMERICA LABORATORY INFORMATICS MARKET VALUE, BY PRODUCT, 2020-2026 (USD BILLION)
TABLE 26. NORTH AMERICA LABORATORY INFORMATICS MARKET VALUE, BY DELIVERY MODE, 2020-2026 (USD BILLION)
TABLE 27. NORTH AMERICA LABORATORY INFORMATICS MARKET VALUE, BY COMPONENT, 2020-2026 (USD BILLION)
TABLE 28. NORTH AMERICA LABORATORY INFORMATICS MARKET VALUE, BY END-USE, 2020-2026 (USD BILLION)
TABLE 29. U.S LABORATORY INFORMATICS MARKET VALUE, BY PRODUCT, 2020-2026 (USD BILLION)
TABLE 30. U.S LABORATORY INFORMATICS MARKET VALUE, BY DELIVERY MODE, 2020-2026 (USD BILLION)
TABLE 31. U.S LABORATORY INFORMATICS MARKET VALUE, BY COMPONENT, 2020-2026 (USD BILLION)
TABLE 32. U.S LABORATORY INFORMATICS MARKET VALUE, BY END-USE, 2020-2026 (USD BILLION)
TABLE 33. CANADA LABORATORY INFORMATICS MARKET VALUE, BY PRODUCT, 2020-2026 (USD BILLION)
TABLE 34. CANADA LABORATORY INFORMATICS MARKET VALUE, BY DELIVERY MODE, 2020-2026 (USD BILLION)
TABLE 35. CANADA LABORATORY INFORMATICS MARKET VALUE, BY COMPONENT, 2020-2026 (USD BILLION)
TABLE 36. CANADA LABORATORY INFORMATICS MARKET VALUE, BY END-USE, 2020-2026 (USD BILLION)
TABLE 37. EUROPE LABORATORY INFORMATICS MARKET VALUE, BY COUNTRY, 2020-2026 (USD BILLION)
TABLE 38. EUROPE LABORATORY INFORMATICS MARKET VALUE, BY PRODUCT, 2020-2026 (USD BILLION)
TABLE 39. EUROPE LABORATORY INFORMATICS MARKET VALUE, BY DELIVERY MODE, 2020-2026 (USD BILLION)
TABLE 40. EUROPE LABORATORY INFORMATICS MARKET VALUE, BY COMPONENT, 2020-2026 (USD BILLION)
TABLE 41. EUROPE LABORATORY INFORMATICS MARKET VALUE, BY END-USE, 2020-2026 (USD BILLION)
TABLE 42. GERMANY LABORATORY INFORMATICS MARKET VALUE, BY PRODUCT, 2020-2026 (USD BILLION)
TABLE 43. GERMANY LABORATORY INFORMATICS MARKET VALUE, BY DELIVERY MODE, 2020-2026 (USD BILLION)
TABLE 44. GERMANY LABORATORY INFORMATICS MARKET VALUE, BY COMPONENT, 2020-2026 (USD BILLION)
TABLE 45. GERMANY LABORATORY INFORMATICS MARKET VALUE, BY END-USE, 2020-2026 (USD BILLION)
TABLE 46. U.K LABORATORY INFORMATICS MARKET VALUE, BY PRODUCT, 2020-2026 (USD BILLION)
TABLE 47. U.K LABORATORY INFORMATICS MARKET VALUE, BY DELIVERY MODE, 2020-2026 (USD BILLION)
TABLE 48. U.K LABORATORY INFORMATICS MARKET VALUE, BY COMPONENT, 2020-2026 (USD BILLION)
TABLE 49. U.K LABORATORY INFORMATICS MARKET VALUE, BY END-USE, 2020-2026 (USD BILLION)
TABLE 50. FRANCE LABORATORY INFORMATICS MARKET VALUE, BY PRODUCT, 2020-2026 (USD BILLION)
TABLE 51. FRANCE LABORATORY INFORMATICS MARKET VALUE, BY DELIVERY MODE, 2020-2026 (USD BILLION)
TABLE 52. FRANCE LABORATORY INFORMATICS MARKET VALUE, BY COMPONENT, 2020-2026 (USD BILLION)
TABLE 53. FRANCE LABORATORY INFORMATICS MARKET VALUE, BY END-USE, 2020-2026 (USD BILLION)
TABLE 54. ITALY LABORATORY INFORMATICS MARKET VALUE, BY PRODUCT, 2020-2026 (USD BILLION)
TABLE 55. ITALY LABORATORY INFORMATICS MARKET VALUE, BY DELIVERY MODE, 2020-2026 (USD BILLION)
TABLE 56. ITALY LABORATORY INFORMATICS MARKET VALUE, BY COMPONENT, 2020-2026 (USD BILLION)
TABLE 57. ITALY LABORATORY INFORMATICS MARKET VALUE, BY END-USE, 2020-2026 (USD BILLION)
TABLE 58. SPAIN LABORATORY INFORMATICS MARKET VALUE, BY PRODUCT, 2020-2026 (USD BILLION)
TABLE 59. SPAIN LABORATORY INFORMATICS MARKET VALUE, BY DELIVERY MODE, 2020-2026 (USD BILLION)
TABLE 60. SPAIN LABORATORY INFORMATICS MARKET VALUE, BY COMPONENT, 2020-2026 (USD BILLION)
TABLE 61. SPAIN LABORATORY INFORMATICS MARKET VALUE, BY END-USE, 2020-2026 (USD BILLION)
TABLE 62. ROE LABORATORY INFORMATICS MARKET VALUE, BY PRODUCT, 2020-2026 (USD BILLION)
TABLE 63. ROE LABORATORY INFORMATICS MARKET VALUE, BY DELIVERY MODE, 2020-2026 (USD BILLION)
TABLE 64. ROE LABORATORY INFORMATICS MARKET VALUE, BY COMPONENT, 2020-2026 (USD BILLION)
TABLE 65. ROE LABORATORY INFORMATICS MARKET VALUE, BY END-USE, 2020-2026 (USD BILLION)
TABLE 66. ASIA PACIFIC LABORATORY INFORMATICS MARKET VALUE, BY COUNTRY, 2020-2026 (USD BILLION)
TABLE 67. ASIA PACIFIC LABORATORY INFORMATICS MARKET VALUE, BY PRODUCT, 2020-2026 (USD BILLION)
TABLE 68. ASIA PACIFIC LABORATORY INFORMATICS MARKET VALUE, BY DELIVERY MODE, 2020-2026 (USD BILLION)
TABLE 69. ASIA PACIFIC LABORATORY INFORMATICS MARKET VALUE, BY COMPONENT, 2020-2026 (USD BILLION)
TABLE 70. ASIA PACIFIC LABORATORY INFORMATICS MARKET VALUE, BY END-USE, 2020-2026 (USD BILLION)
TABLE 71. CHINA LABORATORY INFORMATICS MARKET VALUE, BY PRODUCT, 2020-2026 (USD BILLION)
TABLE 72. CHINA LABORATORY INFORMATICS MARKET VALUE, BY DELIVERY MODE, 2020-2026 (USD BILLION)
TABLE 73. CHINA LABORATORY INFORMATICS MARKET VALUE, BY COMPONENT, 2020-2026 (USD BILLION)
TABLE 74. CHINA LABORATORY INFORMATICS MARKET VALUE, BY END-USE, 2020-2026 (USD BILLION)
TABLE 75. INDIA LABORATORY INFORMATICS MARKET VALUE, BY PRODUCT, 2020-2026 (USD BILLION)
TABLE 76. INDIA LABORATORY INFORMATICS MARKET VALUE, BY DELIVERY MODE, 2020-2026 (USD BILLION)
TABLE 77. INDIA LABORATORY INFORMATICS MARKET VALUE, BY COMPONENT, 2020-2026 (USD BILLION)
TABLE 78. INDIA LABORATORY INFORMATICS MARKET VALUE, BY END-USE, 2020-2026 (USD BILLION)
TABLE 79. JAPAN LABORATORY INFORMATICS MARKET VALUE, BY PRODUCT, 2020-2026 (USD BILLION)
TABLE 80. JAPAN LABORATORY INFORMATICS MARKET VALUE, BY DELIVERY MODE, 2020-2026 (USD BILLION)
TABLE 81. JAPAN LABORATORY INFORMATICS MARKET VALUE, BY COMPONENT, 2020-2026 (USD BILLION)
TABLE 82. JAPAN LABORATORY INFORMATICS MARKET VALUE, BY END-USE, 2020-2026 (USD BILLION)
TABLE 83. REST OF APAC LABORATORY INFORMATICS MARKET VALUE, BY PRODUCT, 2020-2026 (USD BILLION)
TABLE 84. REST OF APAC LABORATORY INFORMATICS MARKET VALUE, BY DELIVERY MODE, 2020-2026 (USD BILLION)
TABLE 85. REST OF APAC LABORATORY INFORMATICS MARKET VALUE, BY COMPONENT, 2020-2026 (USD BILLION)
TABLE 86. REST OF APAC LABORATORY INFORMATICS MARKET VALUE, BY END-USE, 2020-2026 (USD BILLION)
TABLE 87. REST OF WORLD LABORATORY INFORMATICS MARKET VALUE, BY PRODUCT, 2020-2026 (USD BILLION)
TABLE 88. REST OF WORLD LABORATORY INFORMATICS MARKET VALUE, BY DELIVERY MODE, 2020-2026 (USD BILLION)
TABLE 89. REST OF WORLD LABORATORY INFORMATICS MARKET VALUE, BY COMPONENT, 2020-2026 (USD BILLION)
TABLE 90. REST OF WORLD LABORATORY INFORMATICS MARKET VALUE, BY END-USE, 2020-2026 (USD BILLION)
TABLE 91. LABVANTAGE SOLUTIONS, INC: FINANCIALS
TABLE 92. LABVANTAGE SOLUTIONS, INC: PRODUCT AND SERVICES
TABLE 93. LABVANTAGE SOLUTIONS, INC: RECENT DEVELOPMENTS
TABLE 94. THERMO FISHER SCIENTIFIC INC: FINANCIALS
TABLE 95. THERMO FISHER SCIENTIFIC INC: PRODUCT AND SERVICES
TABLE 96. THERMO FISHER SCIENTIFIC INC: RECENT DEVELOPMENTS
TABLE 97. ACCELERATED TECHNOLOGY LABORATORIES: FINANCIALS
TABLE 98. ACCELERATED TECHNOLOGY LABORATORIES: PRODUCT AND SERVICES
TABLE 99. ACCELERATED TECHNOLOGY LABORATORIES: RECENT DEVELOPMENTS
TABLE 100. LABLYNX, INC: FINANCIALS
TABLE 101. LABLYNX, INC: PRODUCT AND SERVICES
TABLE 102. LABLYNX, INC: RECENT DEVELOPMENTS
TABLE 103. AGILENT TECHNOLOGIES, INC: FINANCIALS
TABLE 104. AGILENT TECHNOLOGIES, INC: PRODUCT AND SERVICES
TABLE 105. AGILENT TECHNOLOGIES, INC: RECENT DEVELOPMENTS
TABLE 106. AUTOSCRIBE INFORMATICS: FINANCIALS
TABLE 107. AUTOSCRIBE INFORMATICS: PRODUCT AND SERVICES
TABLE 108. AUTOSCRIBE INFORMATICS: RECENT DEVELOPMENTS
TABLE 109. DASSAULT SYSTEMS: FINANCIALS
TABLE 110. DASSAULT SYSTEMS: PRODUCT AND SERVICES
TABLE 111. DASSAULT SYSTEMS: RECENT DEVELOPMENTS
TABLE 112. LABWORKS LLC: FINANCIALS
TABLE 113. LABWORKS LLC: PRODUCT AND SERVICES
TABLE 114. LABWORKS LLC: RECENT DEVELOPMENTS
TABLE 115. LABWARE: FINANCIALS
TABLE 116. LABWARE: PRODUCT AND SERVICES
TABLE 117. LABWARE: RECENT DEVELOPMENTS
TABLE 118. KINEMATIK: FINANCIALS
TABLE 119. KINEMATIK: PRODUCT AND SERVICES
TABLE 120. KINEMATIK: RECENT DEVELOPMENTS
TABLE 121. WATERS: PRODUCT AND SERVICES
TABLE 122. PERKINELMER INC: PRODUCT AND SERVICES
Research Framework
Infoholic Research works on a holistic 360° approach in order to deliver high quality, validated and reliable information in our market reports. The Market estimation and forecasting involves following steps:
- Data Collation (Primary & Secondary)
- In-house Estimation (Based on proprietary data bases and Models)
- Market Triangulation
- Forecasting

Market related information is congregated from both primary and secondary sources.
Primary sources
Involved participants from all global stakeholders such as Solution providers, service providers, Industry associations, thought leaders etc. across levels such as CXOs, VPs and managers. Plus, our in-house industry experts having decades of industry experience contribute their consulting and advisory services.
Secondary sources
Include public sources such as regulatory frameworks, government IT spending, government demographic indicators, industry association statistics, and company publications along with paid sources such as Factiva, OneSource, Bloomberg among others.
![]()


