
IoT Sensors Market based on Network Technology (Wired Network Technology and Wireless Network Technology), Type (Accelerometers, Gyroscopes, Magnetometers, Pressure sensors, Temperature sensors, Light sensors, and Others), Application (Consumer Electronics, Healthcare, Automotive, Industrial, Building Automation, Retail, and Others) and Geography – Global Forecast to 2027
- July, 2021
- Domain: Electronics & Semiconductors - Electronics & Semiconductors
- Get Free 10% Customization in this Report
Internet of things is a network of physical devices, vehicles, and other items integrated with actuators, software, electronics, sensors, and connectivity, which allows individuals to connect, collect, and create data that improve efficiency and minimize human efforts. IoT sensor is one of the components which are used in smart cities in smart grids, smart meters, intelligent traffic management systems, smart parking, among other applications. Rising automotive industry across the world, coupled with the rising adoption of IoT sensors in the automotive industry, are key factors anticipated to foster global IoT sensors market growth. In addition, increasing demand for consumer electronics such as smart homes, smart TVs, and smartphones are few other factors projected further to propel the target market growth significantly. Moreover, growing consumer awareness regarding reasonable consumer electronics in several countries and surging sales of electronic products are other factors anticipated to boost the growth of the global market. Apart from this, the shortage of common protocols and communication standards is projected to hamper market growth. As a result, the IoT Sensors Market is estimated to grow at 28.5% CAGR by 2027.
Research Methodology:
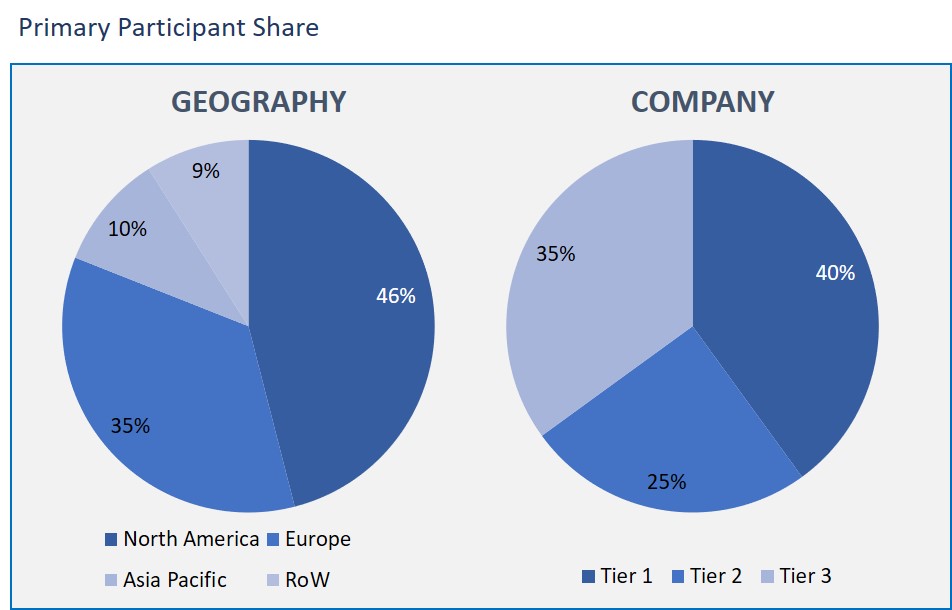
The IoT Sensors Market has been analyzed by utilizing the optimum combination of secondary sources and in-house methodology and a unique balance of primary insights. The real-time valuation of the market is an integral part of our forecasting and market sizing methodology. Industry experts and our primary participants have helped to compile related aspects with accurate parametric estimations for a complete study. The primary participants share is given below:
IoT Sensors Market based on Network Technology
- Wired Network Technology
- Wireless Network Technology
IoT Sensors Market based on Type
- Accelerometers
- Gyroscopes
- Magnetometers
- Pressure sensors
- Temperature sensors
- Light sensors
- Others
IoT Sensors Market based on Application
- Consumer electronics
- Healthcare
- Automotive
- Industrial
- Building automation
- Retail
- Others
IoT Sensors Market based on Geography
- North America
- Europe
- Asia Pacific
- Rest of the World
Based on the network technology, the wireless network technology accounts for the highest share in the IoT sensor market. Several factors fueling the segment's growth are escalating demand for wireless data from mobile devices, smart grids, and others. In addition, also increasing the adoption of the cloud platform is further driving the segment's growth.
Based on type, the pressure sensors segment has the highest market share. This segment is primarily driven by rising concerns about safety, comfort levels, and depletion in automobile emissions. Furthermore, the regulatory mandates requiring the necessary installation of onboard diagnostics to mitigate greenhouse gas emissions will increase the demand for pressure sensors. Moreover, the application of pressure sensors in autonomous cars would depict various growth opportunities for players operating in the pressure sensor market.
Based on the application, the industrial application is holding a significant share. This is due to the need to implement predictive maintenance techniques in various industries to monitor industrial equipment working to prevent unexpected downtimes in production cycles. Furthermore, intelligent wireless sensors continuously monitor parameters of critical processes in industrial environments, therefore leading to the increased operational efficiencies of industries.
Based on geography, the North American region accounted for the maximum share in the market. Rising technological advancements in the region and rising adoption of wireless sensors and networks among several industrial, healthcare, transport, and automotive applications are fueling the growth of the IoT Sensor Market in the region.
Globally, due to the swift depletion in the sensor size and increased adoption of microelectromechanical systems (MEMS) technology, sensors are finding applications in automotive, healthcare, and consumer products. This has played a key role in the growth of the complete sensors market. Furthermore, in the past few years, smaller sensors have rapidly been employed in devices such as smartphones, drones, wearables, and robots.
The key profiles of players mentioned in the report of IoT sensors market are Analog Devices, Inc., Honeywell International, Inc., Infineon Technologies AG, Texas Instruments Incorporated, ARM Holdings PLC, Broadcom, Inc., NXP Semiconductors N.V., Omron Corporation, Robert Bosch Gmbh, and STMicroelectronics N.V.
Henceforth, the IoT made it potential to connect everyday things to the internet. In the present scenario, almost all entities, such as houses, office buildings, and factories, are connected to the network to gather data and use the information for various purposes. As the complimentary sensors play a vital role in creating solutions using IoT.
- This report indicates the significant manufacturers along with the competitive market outlook and SWOT analysis.
- This study defines, describes, and predicts the market value by device type, end-user, application, and region.
- This research also indicates the key regional market potentials and drivers, opportunities and challenges, restrictions and risks.
- This report also provides the profiles of the significant vendors, their dynamic strategies and product developments, and other competitive strategies.
- Executive Summary
- Industry Outlook
- Industry Overview
- Industry Trends
- Market Snapshot
- Market Definition
- Market Outlook
- Porter Five Forces
- Related Markets
- Market characteristics
- Market Overview
- Market Segmentation
- Market Dynamics
- Drivers
- Restraints
- Opportunities
- DRO - Impact Analysis
- Network Technology: Market Size & Analysis
- Overview
- Wired Network Technology
- Wireless Network Technology
- Type: Market Size & Analysis
- Overview
- Accelerometers
- Gyroscopes
- Magnetometers
- Pressure sensors
- Temperature sensors
- Light sensors
- Others
- Application: Market Size & Analysis
- Overview
- Consumer electronics
- Healthcare
- Automotive
- Industrial
- Building automation
- Retail
- Others
- Geography: Market Size & Analysis
- Overview
- North America
- Europe
- Asia Pacific
- Rest of the World
- Competitive Landscape
- Competitor Comparison Analysis
- Market Developments
- Mergers and Acquisitions, Legal, Awards, Partnerships
- Product Launches and execution
- Vendor Profiles
- Analog Devices, Inc.
- Overview
- Financial Overview
- Product Offerings
- Developments
- Business Strategy
- Honeywell International, Inc.
- Overview
- Financial Overview
- Product Offerings
- Developments
- Business Strategy
- Infineon Technologies AG
- Overview
- Financial Overview
- Product Offerings
- Developments
- Business Strategy
- Texas Instruments Incorporated
- Overview
- Financial Overview
- Product Offerings
- Developments
- Business Strategy
- ARM Holdings PLC
- Overview
- Financial Overview
- Product Offerings
- Developments
- Business Strategy
- Broadcom, Inc.
- Overview
- Financial Overview
- Product Offerings
- Developments
- Business Strategy
- NXP Semiconductors N.V.
- Overview
- Financial Overview
- Product Offerings
- Developments
- Business Strategy
- Omron Corporation
- Overview
- Financial Overview
- Product Offerings
- Developments
- Business Strategy
- Robert Bosch Gmbh
- Overview
- Financial Overview
- Product Offerings
- Developments
- Business Strategy
- STMicroelectronics N.V.
- Overview
- Financial Overview
- Product Offerings
- Developments
- Business Strategy
- Analog Devices, Inc.
- Analyst Opinion
- Annexure
- Report Scope
- Market Definitions
- Research Methodology
- Data Collation and In-house Estimation
- Market Triangulation
- Forecasting
- Report Assumptions
- Declarations
- Stakeholders
- Abbreviations
TABLE 1. GLOBAL IOT SENSORS MARKET VALUE, BY NETWORK TECHNOLOGY, 2021-2027 (USD BILLION)
TABLE 2. GLOBAL IOT SENSORS MARKET VALUE FOR WIRED NETWORK TECHNOLOGY, BY GEOGRAPHY, 2021-2027 (USD BILLION)
TABLE 3. GLOBAL IOT SENSORS MARKET VALUE FOR WIRELESS NETWORK TECHNOLOGY, BY GEOGRAPHY, 2021-2027 (USD BILLION)
TABLE 4. GLOBAL IOT SENSORS MARKET VALUE, BY TYPE, BY GEOGRAPHY, 2021-2027 (USD BILLION)
TABLE 5. GLOBAL IOT SENSORS MARKET VALUE FOR ACCELEROMETERS, BY GEOGRAPHY, 2021-2027 (USD BILLION)
TABLE 6. GLOBAL IOT SENSORS MARKET VALUE FOR GYROSCOPES, BY GEOGRAPHY, 2021-2027 (USD BILLION)
TABLE 7. GLOBAL IOT SENSORS MARKET VALUE FOR MAGNETOMETERS, BY GEOGRAPHY, 2021-2027 (USD BILLION)
TABLE 8. GLOBAL IOT SENSORS MARKET VALUE FOR PRESSURE SENSORS, BY GEOGRAPHY, 2021-2027 (USD BILLION)
TABLE 9. GLOBAL IOT SENSORS MARKET VALUE FOR TEMPERATURE SENSORS, BY GEOGRAPHY, 2021-2027 (USD BILLION)
TABLE 10. GLOBAL IOT SENSORS MARKET VALUE FOR LIGHT SENSORS, BY GEOGRAPHY, 2021-2027 (USD BILLION)
TABLE 11. GLOBAL IOT SENSORS MARKET VALUE FOR OTHERS, BY GEOGRAPHY, 2021-2027 (USD BILLION)
TABLE 12. GLOBAL IOT SENSORS MARKET VALUE, BY APPLICATION, 2021-2027 (USD BILLION)
TABLE 13. GLOBAL IOT SENSORS MARKET VALUE FOR CONSUMER ELECTRONICS, BY GEOGRAPHY, 2021-2027 (USD BILLION)
TABLE 14. GLOBAL IOT SENSORS MARKET VALUE FOR HEALTHCARE, BY GEOGRAPHY, 2021-2027 (USD BILLION)
TABLE 15. GLOBAL IOT SENSORS MARKET VALUE FOR AUTOMOTIVE, BY GEOGRAPHY, 2021-2027 (USD BILLION)
TABLE 16. GLOBAL IOT SENSORS MARKET VALUE FOR INDUSTRIAL, BY GEOGRAPHY, 2021-2027 (USD BILLION)
TABLE 17. GLOBAL IOT SENSORS MARKET VALUE FOR BUILDING AUTOMATION, BY GEOGRAPHY, 2021-2027 (USD BILLION)
TABLE 18. GLOBAL IOT SENSORS MARKET VALUE FOR RETAIL, BY GEOGRAPHY, 2021-2027 (USD BILLION)
TABLE 19. GLOBAL IOT SENSORS MARKET VALUE FOR OTHERS, BY GEOGRAPHY, 2021-2027 (USD BILLION)
TABLE 20. NORTH AMERICA IOT SENSORS MARKET VALUE, BY COUNTRY, 2021-2027 (USD BILLION)
TABLE 21. NORTH AMERICA IOT SENSORS MARKET VALUE, BY NETWORK TECHNOLOGY, 2021-2027 (USD BILLION)
TABLE 22. NORTH AMERICA IOT SENSORS MARKET VALUE, BY TYPE, 2021-2027 (USD BILLION)
TABLE 23. NORTH AMERICA IOT SENSORS MARKET VALUE, BY APPLICATION, 2021-2027 (USD BILLION)
TABLE 24. U.S IOT SENSORS MARKET VALUE, BY NETWORK TECHNOLOGY, 2021-2027 (USD BILLION)
TABLE 25. U.S IOT SENSORS MARKET VALUE, BY TYPE, 2021-2027 (USD BILLION)
TABLE 26. U.S IOT SENSORS MARKET VALUE, BY APPLICATION, 2021-2027 (USD BILLION)
TABLE 27. CANADA IOT SENSORS MARKET VALUE, BY NETWORK TECHNOLOGY, 2021-2027 (USD BILLION)
TABLE 28. CANADA IOT SENSORS MARKET VALUE, BY TYPE, 2021-2027 (USD BILLION)
TABLE 29. CANADA IOT SENSORS MARKET VALUE, BY APPLICATION, 2021-2027 (USD BILLION)
TABLE 30. EUROPE IOT SENSORS MARKET VALUE, BY COUNTRY, 2021-2027 (USD BILLION)
TABLE 31. EUROPE IOT SENSORS MARKET VALUE, BY NETWORK TECHNOLOGY, 2021-2027 (USD BILLION)
TABLE 32. EUROPE IOT SENSORS MARKET VALUE, BY TYPE, 2021-2027 (USD BILLION)
TABLE 33. EUROPE IOT SENSORS MARKET VALUE, APPLICATION, 2021-2027 (USD BILLION)
TABLE 34. GERMANY IOT SENSORS MARKET VALUE, BY NETWORK TECHNOLOGY, 2021-2027 (USD BILLION)
TABLE 35. GERMANY IOT SENSORS MARKET VALUE, BY TYPE, 2021-2027 (USD BILLION)
TABLE 36. GERMANY IOT SENSORS MARKET VALUE, BY APPLICATION, 2021-2027 (USD BILLION)
TABLE 37. U.K IOT SENSORS MARKET VALUE, BY NETWORK TECHNOLOGY, 2021-2027 (USD BILLION)
TABLE 38. U.K IOT SENSORS MARKET VALUE, BY TYPE, 2021-2027 (USD BILLION)
TABLE 39. U.K IOT SENSORS MARKET VALUE, BY APPLICATION, 2021-2027 (USD BILLION)
TABLE 40. FRANCE IOT SENSORS MARKET VALUE, BY NETWORK TECHNOLOGY, 2021-2027 (USD BILLION)
TABLE 41. FRANCE IOT SENSORS MARKET VALUE, BY TYPE, 2021-2027 (USD BILLION)
TABLE 42. FRANCE IOT SENSORS MARKET VALUE, BY APPLICATION, 2021-2027 (USD BILLION)
TABLE 43. ITALY IOT SENSORS MARKET VALUE, BY NETWORK TECHNOLOGY, 2021-2027 (USD BILLION)
TABLE 44. ITALY IOT SENSORS MARKET VALUE, BY TYPE, 2021-2027 (USD BILLION)
TABLE 45. ITALY IOT SENSORS MARKET VALUE, BY APPLICATION, 2021-2027 (USD BILLION)
TABLE 46. SPAIN IOT SENSORS MARKET VALUE, BY NETWORK TECHNOLOGY, 2021-2027 (USD BILLION)
TABLE 47. SPAIN IOT SENSORS MARKET VALUE, BY TYPE, 2021-2027 (USD BILLION)
TABLE 48. SPAIN IOT SENSORS MARKET VALUE, BY APPLICATION, 2021-2027 (USD BILLION)
TABLE 49. ROE IOT SENSORS MARKET VALUE, BY NETWORK TECHNOLOGY, 2021-2027 (USD BILLION)
TABLE 50. ROE IOT SENSORS MARKET VALUE, BY TYPE, 2021-2027 (USD BILLION)
TABLE 51. ROE IOT SENSORS MARKET VALUE, BY APPLICATION, 2021-2027 (USD BILLION)
TABLE 52. ASIA PACIFIC IOT SENSORS MARKET VALUE, BY COUNTRY, 2021-2027 (USD BILLION)
TABLE 53. ASIA PACIFIC IOT SENSORS MARKET VALUE, BY NETWORK TECHNOLOGY, 2021-2027 (USD BILLION)
TABLE 54. ASIA PACIFIC IOT SENSORS MARKET VALUE, BY TYPE, 2021-2027 (USD BILLION)
TABLE 55. ASIA PACIFIC IOT SENSORS MARKET VALUE, BY APPLICATION, 2021-2027 (USD BILLION)
TABLE 56. CHINA IOT SENSORS MARKET VALUE, BY NETWORK TECHNOLOGY, 2021-2027 (USD BILLION)
TABLE 57. CHINA IOT SENSORS MARKET VALUE, BY TYPE, 2021-2027 (USD BILLION)
TABLE 58. CHINA IOT SENSORS MARKET VALUE, BY APPLICATION, 2021-2027 (USD BILLION)
TABLE 59. INDIA IOT SENSORS MARKET VALUE, BY NETWORK TECHNOLOGY, 2021-2027 (USD BILLION)
TABLE 60. INDIA IOT SENSORS MARKET VALUE, BY TYPE, 2021-2027 (USD BILLION)
TABLE 61. INDIA IOT SENSORS MARKET VALUE, BY APPLICATION, 2021-2027 (USD BILLION)
TABLE 62. JAPAN IOT SENSORS MARKET VALUE, BY NETWORK TECHNOLOGY, 2021-2027 (USD BILLION)
TABLE 63. JAPAN IOT SENSORS MARKET VALUE, BY TYPE, 2021-2027 (USD BILLION)
TABLE 64. JAPAN IOT SENSORS MARKET VALUE, BY APPLICATION, 2021-2027 (USD BILLION)
TABLE 65. REST OF APAC IOT SENSORS MARKET VALUE, BY NETWORK TECHNOLOGY, 2021-2027 (USD BILLION)
TABLE 66. REST OF APAC IOT SENSORS MARKET VALUE, BY TYPE, 2021-2027 (USD BILLION)
TABLE 67. REST OF APAC IOT SENSORS MARKET VALUE, BY APPLICATION, 2021-2027 (USD BILLION)
TABLE 68. REST OF WORLD IOT SENSORS MARKET VALUE, BY NETWORK TECHNOLOGY, 2021-2027 (USD BILLION)
TABLE 69. REST OF WORLD IOT SENSORS MARKET VALUE, BY TYPE, 2021-2027 (USD BILLION)
TABLE 70. REST OF WORLD IOT SENSORS MARKET VALUE, BY APPLICATION, 2021-2027 (USD BILLION)
TABLE 71. ANALOG DEVICES, INC: FINANCIALS
TABLE 72. ANALOG DEVICES, INC: PRODUCTS & SERVICES
TABLE 73. ANALOG DEVICES, INC: RECENT DEVELOPMENTS
TABLE 74. HONEYWELL INTERNATIONAL, INC: FINANCIALS
TABLE 75. HONEYWELL INTERNATIONAL, INC: PRODUCTS & SERVICES
TABLE 76. HONEYWELL INTERNATIONAL, INC: RECENT DEVELOPMENTS
TABLE 77. INFINEON TECHNOLOGIES AG: FINANCIALS
TABLE 78. INFINEON TECHNOLOGIES AG: PRODUCTS & SERVICES
TABLE 79. INFINEON TECHNOLOGIES AG: RECENT DEVELOPMENTS
TABLE 80. TEXAS INSTRUMENTS INCORPORATED: FINANCIALS
TABLE 81. TEXAS INSTRUMENTS INCORPORATED: PRODUCTS & SERVICES
TABLE 82. TEXAS INSTRUMENTS INCORPORATED: RECENT DEVELOPMENTS
TABLE 83. ARM HOLDINGS PLC: FINANCIALS
TABLE 84. ARM HOLDINGS PLC: PRODUCTS & SERVICES
TABLE 85. ARM HOLDINGS PLC: RECENT DEVELOPMENTS
TABLE 86. BROADCOM, INC: FINANCIALS
TABLE 87. BROADCOM, INC: PRODUCTS & SERVICES
TABLE 88. BROADCOM, INC: RECENT DEVELOPMENTS
TABLE 89. NXP SEMICONDUCTORS N.V.: FINANCIALS
TABLE 90. NXP SEMICONDUCTORS N.V.: PRODUCTS & SERVICES
TABLE 91. NXP SEMICONDUCTORS N.V.: RECENT DEVELOPMENTS
TABLE 92. OMRON CORPORATION: FINANCIALS
TABLE 93. OMRON CORPORATION: PRODUCTS & SERVICES
TABLE 94. OMRON CORPORATION: RECENT DEVELOPMENTS
TABLE 95. ROBERT BOSCH GMBH: FINANCIALS
TABLE 96. ROBERT BOSCH GMBH: PRODUCTS & SERVICES
TABLE 97. ROBERT BOSCH GMBH: RECENT DEVELOPMENTS
TABLE 98. STMICROELECTRONICS N.V.: FINANCIALS
TABLE 99. STMICROELECTRONICS N.V.: PRODUCTS & SERVICES
TABLE 100. STMICROELECTRONICS N.V.: RECENT DEVELOPMENTS
Research Framework
Infoholic Research works on a holistic 360° approach in order to deliver high quality, validated and reliable information in our market reports. The Market estimation and forecasting involves following steps:
- Data Collation (Primary & Secondary)
- In-house Estimation (Based on proprietary data bases and Models)
- Market Triangulation
- Forecasting

Market related information is congregated from both primary and secondary sources.
Primary sources
Involved participants from all global stakeholders such as Solution providers, service providers, Industry associations, thought leaders etc. across levels such as CXOs, VPs and managers. Plus, our in-house industry experts having decades of industry experience contribute their consulting and advisory services.
Secondary sources
Include public sources such as regulatory frameworks, government IT spending, government demographic indicators, industry association statistics, and company publications along with paid sources such as Factiva, OneSource, Bloomberg among others.
![]()


