
Inspection Machines market by Type (Semi-automated, Manual, and fully-automated), Product (Vision Inspection Systems, Leak Detection Systems, X-ray Inspection Systems, Combination Systems, Checkweighers, Metal Detectors, and Software), Packaging (Ampoules & Vials, Syringes, Blisters, Bottles) and Geography – Global Drivers, Restraints, Opportunities, Trends, and Forecast up to 2025
- September, 2020
- Domain: Healthcare - Medical Devices
- Get Free 10% Customization in this Report
Inspection Machines include manual, mechanical, and computerized systems that are used to check the quality of the products in terms of packages, packaging components to ensure they conform to a specification like a leakage, weight, faults, and dimensions to maintain the consistency in the overall production line. The growing focus to maintain the quality has fuelled the robust growth of the global inspection machines in the market. Another factor attributed to the growth in the competitive landscape is the heavy investment by the players in research and development activities to acquire a competitive edge over their rivals. One of the significant aspects that enhance the growth of the global inspection machines market is the latest technological advancements and integration of technologies such as IoT, machine learning, and artificial intelligence in all types of production and packaging businesses.
Research Methodology:
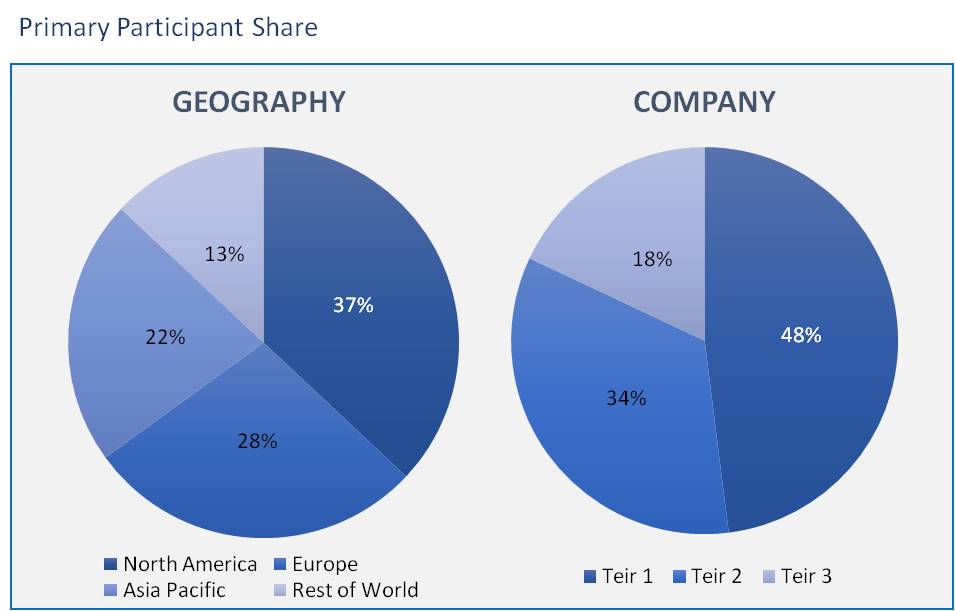
The inspection machines market has been analyzed by utilizing the optimum combination of secondary sources and in-house methodology, along with an irreplaceable blend of primary insights. The real-time assessment of the market is an integral part of our market sizing and forecasting methodology. Our industry experts and panel of primary participants have helped in compiling relevant aspects with realistic parametric estimations for a comprehensive study. The participation share of different categories of primary participants is given below:
The Inspection Machine market is predicted to grow at a CAGR of 5.4% during the forecasting period. The scope of the Inspection Machine Market is defined in the market analysis as follows:
- Based on Type
- Fully-automated
- Semi-automated
- Manual
- Based on Product
- Vision Inspection Systems
- Leak Detection Systems
- X-ray Inspection Systems
- Combination Systems
- Checkweighers
- Metal Detectors
- Software
- Based on Packaging
- Ampoules & Vials
- Syringes
- Blisters
- Bottles
- Others
The significant factors propelling the need for syringe inspection machines are, growing importance to the safety of syringes, rising the focus on cGMP standards compliance, the rising of light transmission technology to inspect particles later in liquids, and camera-based technologies to identify defects of the cosmetic container in syringes. The high chances of polluting and defects in syringe packaging are other important factors keeping up the demand for syringe inspection machines in syringe production lines.
- Based on End-User
- Pharmaceutical & Biotechnology Companies
- Medical Device Manufacturers
- Other
The Inspection Machine market includes pharmaceutical & biotechnology companies, medical device manufacturers, and food processing & packaging companies. The pharmaceutical & biotechnology companies segment is the majorly contributing end-users in the inspection machine market. The large share of this segment can majorly be attributed to the strict regulations imposed by the government regarding the quality of a package and the increasing demand to tackle fake pharmaceutical products, retrieving unsafe products, and improve the overall business performance.
- Based on Geography:
- North America
- Europe
- Asia Pacific
- Rest of the World
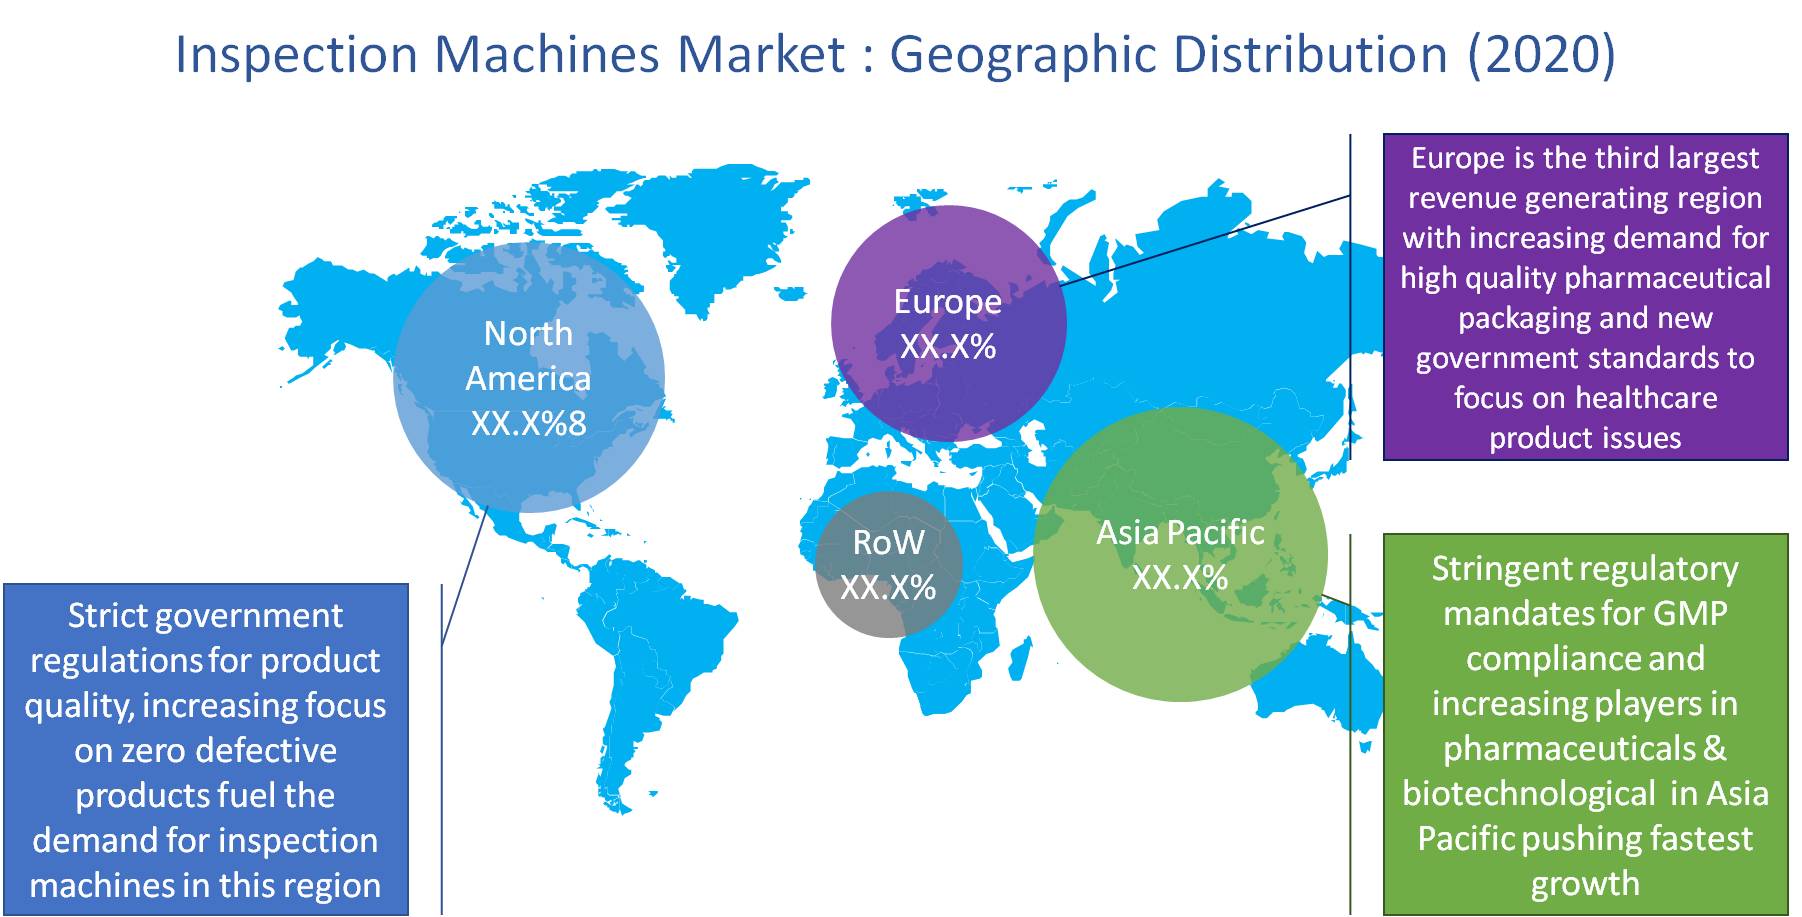
Geographically, the inspection machines market has spread its existence in all regions across the world, such as North America, Asia Pacific, Europe, and the Rest of the world. Out of these regions, Asia Pacific is expected to obtain maximum hold among all other regions. The growth of the region is highly attributed to the rising strictness in regulatory mandates to comply with Good Manufacturing Practices (GMP), and rising number of players in pharmaceuticals and biotechnological regions is another factor which is influencing the growth of Asia Pacific regions in the global inspection machines market in the forecast period of 2018 to 2026.
The major drivers of the inspection machine markets are the rising number of inspection checkpoints along with the growing adoption of automatic Inspection machines, technological advancements, rising demand for inline product inspection, growing need to fulfill the GMP requirements, and the rising demand for the combination of innovative technologies. Furthermore, the increasing demand for reused or refurbished machines is expected to make a major hindrance to the Inspection machines market and also affect the new machinery sales Inspection machines.
The report also includes the analysis of major players in the Inspection Machine market. Some of the major players consist of Thermo Fisher Scientific, Mitsubishi Chemical Holdings Corporation, Robert Bosch GmbH, Teledyne Technologies Incorporated, Körber AG, Omron Corporation, Cognex Corporation, METTLER-TOLEDO, Jackson Vision Private Limited, and Brevetti C.E.A. SPA.
The increasing awareness about the quality of products and growing regulatory pressure for improved quality control in the product packaging are the main reasons for the inspection machine market to grow enormously all over the world. This report will enable the market competitors to understand the overall market analysis based on every segment.
- Inclusive analysis on the product portfolio provided by the major vendors in the inspection machines market.
- Detailed information on the forthcoming trends, research activities, and product promotion in the global inspection machines market.
- In-depth information on the profit-making developing regions.
- In-depth analysis of brand-new products, growing regions, and the current improvements in the global inspection machines market.
- Overall assessment of products, market position, productive strategies and revenue share of the major vendors in the inspection machines market.
1. Executive Summary
2. Industry Outlook
2.1. Industry Overview
2.2. Industry Trends
3. Market Snapshot
3.1. Market Definition
3.2. Market Outlook
3.3. PEST Analysis
3.4. Porter Five Forces
3.5. Related Markets
4. Market characteristics
4.1. Market Evolution
4.2. Market Trends and Impact
4.3. Advantages/Disadvantages of Market
4.4. Regulatory Impact
4.5. Market Offerings
4.6. Market Segmentation
4.7. Market Dynamics
4.7.1. Drivers
4.7.2. Restraints
4.7.3. Opportunities
4.8. DRO - Impact Analysis
5. End-User: Market Size & Analysis
5.1. Overview
5.2. Pharmaceutical & Biotechnology Companies
5.3. Medical Device Manufacturers
5.4. Other
6. Packaging Type: Market Size & Analysis
6.1. Overview
6.2. Ampoules & Vials
6.3. Syringes
6.4. Blisters
6.5. Bottles
6.6. Other
7. Product: Market Size & Analysis
7.1. Overview
7.2. Vision Inspection Systems
7.3. Leak Detection Systems
7.4. X-ray Inspection Systems
7.5. Combination Systems
7.6. Checkweighers
7.7. Metal Detectors
7.8. Software
7.9. Other
8. Type: Market Size & Analysis
8.1. Overview
8.2. Fully-automated Inspection Machines
8.3. Semi-automated Inspection Machines
8.4. Manual Inspection Machines
9. Geography: Market Size & Analysis
9.1. Overview
9.2. North America
9.3. Europe
9.4. Asia Pacific
9.5. Rest of the World
10. Competitive Landscape
10.1. Competitor Comparison Analysis
10.2. Market Developments
10.3. Mergers and Acquisitions, Legal, Awards, Partnerships
10.4. Product Launches and execution
11. Vendor Profiles
11.1. Robert Bosch GmbH
11.1.1. Overview
11.1.2. Product Offerings
11.1.3. Geographic Revenue
11.1.4. Business Units
11.1.5. Developments
11.1.6. Business Strategy
11.2. Brevetti C.E.A. SPA
11.2.1. Overview
11.2.2. Product Offerings
11.2.3. Geographic Revenue
11.2.4. Business Units
11.2.5. Developments
11.2.6. Business Strategy
11.3. Körber AG
11.3.1. Overview
11.3.2. Product Offerings
11.3.3. Geographic Revenue
11.3.4. Business Units
11.3.5. Developments
11.3.6. SWOT Analysis
11.3.7. Business Strategy
11.4. Mettler-Toledo
11.4.1. Overview
11.4.2. Product Offerings
11.4.3. Geographic Revenue
11.4.4. Business Units
11.4.5. Developments
11.4.6. Business Strategy
11.5. Teledyne Technologies Incorporated
11.5.1. Overview
11.5.2. Product Offerings
11.5.3. Geographic Revenue
11.5.4. Business Units
11.5.5. Developments
11.5.6. Business Strategy
11.6. Omron Corporation.
11.6.1. Overview
11.6.2. Product Offerings
11.6.3. Geographic Revenue
11.6.4. Business Units
11.6.5. Developments
11.6.6. Business Strategy
11.7. Mitsubishi Chemical Holdings Corporation
11.7.1. Overview
11.7.2. Product Offerings
11.7.3. Geographic Revenue
11.7.4. Business Units
11.7.5. Developments
11.7.6. Business Strategy
11.8. Cognex Corporation
11.8.1. Overview
11.8.2. Product Offerings
11.8.3. Geographic Revenue
11.8.4. Business Units
11.8.5. Developments
11.8.6. Business Strategy
11.9. Jekson Vision Private Limited
11.9.1. Overview
11.9.2. Product Offerings
11.9.3. Geographic Revenue
11.9.4. Business Units
11.9.5. Developments
11.9.6. Business Strategy
11.10. Thermo Fisher Scientific
11.10.1. Overview
11.10.2. Product Offerings
11.10.3. Geographic Revenue
11.10.4. Business Units
11.10.5. Developments
11.10.6. Business Strategy
12. Companies to Watch
12.1. Antares Vision
12.1.1. Overview
12.1.2. Market
12.1.3. Business Strategy
12.2. OPTEL Group
12.2.1. Overview
12.2.2. Market
12.2.3. Business Strategy
12.3. ACG Worldwide
12.3.1. Overview
12.3.2. Market
12.3.3. Business Strategy
13. Analyst Opinion
14. Annexure
14.1. Report Scope
14.2. Market Definitions
14.3. Research Methodology
14.3.1. Data Collation and In-house Estimation
14.3.2. Market Triangulation
14.3.3. Forecasting
14.4. Report Assumptions
14.5. Declarations
14.6. Stakeholders
14.7. Abbreviations
TABLE 1. GLOBAL INSPECTION MACHINE MARKET VALUE, BY END USER, 2020-2026 (USD MILLION)
TABLE 2. GLOBAL INSPECTION MACHINE MARKET VALUE FOR PHARMACEUTICAL & BIOTYPE COMPANIES, BY GEOGRAPHY, 2020-2026 (USD MILLION)
TABLE 3. GLOBAL INSPECTION MACHINE MARKET VALUE FOR MEDICAL DEVICE MANUFACTURERS, BY GEOGRAPHY, 2020-2026 (USD MILLION)
TABLE 4. GLOBAL INSPECTION MACHINE MARKET VALUE FOR OTHER, BY GEOGRAPHY, 2020-2026 (USD MILLION)
TABLE 5. GLOBAL INSPECTION MACHINE MARKET VALUE, BY PACKAGING TYPE, 2020-2026 (USD MILLION)
TABLE 6. GLOBAL INSPECTION MACHINE MARKET VALUE FOR BLISTERS, BY GEOGRAPHY, 2020-2026 (USD MILLION)
TABLE 7. GLOBAL INSPECTION MACHINE MARKET VALUE FOR AMPOULES & VIALS, BY GEOGRAPHY, 2020-2026 (USD MILLION)
TABLE 8. GLOBAL INSPECTION MACHINE MARKET VALUE FOR SYRINGES, BY GEOGRAPHY, 2020-2026 (USD MILLION)
TABLE 9. GLOBAL INSPECTION MACHINE MARKET VALUE FOR BOTTLES, BY GEOGRAPHY, 2020-2026 (USD MILLION)
TABLE 10. GLOBAL INSPECTION MACHINE MARKET VALUE FOR OTHERS, BY GEOGRAPHY, 2020-2026 (USD MILLION)
TABLE 11. GLOBAL INSPECTION MACHINE MARKET VALUE, BY PRODUCT, 2020-2026 (USD MILLION)
TABLE 12. GLOBAL INSPECTION MACHINE MARKET VALUE FOR VISION INSPECTION SYSTEMS, BY GEOGRAPHY, 2020-2026 (USD MILLION)
TABLE 13. GLOBAL INSPECTION MACHINE MARKET VALUE FOR COMBINATION SYSTEMS, BY GEOGRAPHY, 2020-2026 (USD MILLION)
TABLE 14. GLOBAL INSPECTION MACHINE MARKET VALUE FOR X-RAY INSPECTION SYSTEMS, BY GEOGRAPHY, 2020-2026 (USD MILLION)
TABLE 15. GLOBAL INSPECTION MACHINE MARKET VALUE FOR LEAK DETECTION SYSTEMS, BY GEOGRAPHY, 2020-2026 (USD MILLION)
TABLE 16. GLOBAL INSPECTION MACHINE MARKET VALUE FOR CHECKWEIGHERS, BY GEOGRAPHY, 2020-2026 (USD MILLION)
TABLE 17. GLOBAL INSPECTION MACHINE MARKET VALUE FOR METAL DETECTORS, BY GEOGRAPHY, 2020-2026 (USD MILLION)
TABLE 18. GLOBAL INSPECTION MACHINE MARKET VALUE FOR SOFTWARE, BY GEOGRAPHY, 2020-2026 (USD MILLION)
TABLE 19. GLOBAL INSPECTION MACHINE MARKET VALUE FOR OTHER INSPECTION SYSTEM, BY GEOGRAPHY, 2020-2026 (USD MILLION)
TABLE 20. GLOBAL INSPECTION MACHINE MARKET VALUE, BY TYPE, 2020-2026 (USD MILLION)
TABLE 21. GLOBAL INSPECTION MACHINE MARKET VALUE FOR SEMI-AUTOMATED INSPECTION MACHINES, BY GEOGRAPHY, 2020-2026 (USD MILLION)
TABLE 22. GLOBAL INSPECTION MACHINE MARKET VALUE FOR MANUAL INSPECTION MACHINES, BY GEOGRAPHY, 2020-2026 (USD MILLION)
TABLE 23. NORTH AMERICA INSPECTION MACHINE MARKET VALUE, BY COUNTRY, 2020-2026 (USD MILLION)
TABLE 24. NORTH AMERICA INSPECTION MACHINE MARKET VALUE, BY END USER, 2020-2026 (USD MILLION)
TABLE 25. NORTH AMERICA INSPECTION MACHINE MARKET VALUE, BY PACKAGING TYPE, 2020-2026 (USD MILLION)
TABLE 26. NORTH AMERICA INSPECTION MACHINE MARKET VALUE, BY PRODUCT, 2020-2026 (USD MILLION)
TABLE 27. NORTH AMERICA INSPECTION MACHINE MARKET VALUE, BY TYPE, 2020-2026 (USD MILLION)
TABLE 28. U.S INSPECTION MACHINE MARKET VALUE, BY END USER, 2020-2026 (USD MILLION)
TABLE 29. U.S INSPECTION MACHINE MARKET VALUE, BY PACKAGING TYPE, 2020-2026 (USD MILLION)
TABLE 30. U.S INSPECTION MACHINE MARKET VALUE, BY PRODUCT, 2020-2026 (USD MILLION)
TABLE 31. U.S INSPECTION MACHINE MARKET VALUE, BY TYPE, 2020-2026 (USD MILLION)
TABLE 32. CANADA INSPECTION MACHINE MARKET VALUE, BY END USER, 2020-2026 (USD MILLION)
TABLE 33. CANADA INSPECTION MACHINE MARKET VALUE, BY PACKAGING TYPE, 2020-2026 (USD MILLION)
TABLE 34. CANADA INSPECTION MACHINE MARKET VALUE, BY PRODUCT, 2020-2026 (USD MILLION)
TABLE 35. CANADA INSPECTION MACHINE MARKET VALUE, BY TYPE, 2020-2026 (USD MILLION)
TABLE 36. EUROPE INSPECTION MACHINE MARKET VALUE, BY COUNTRY, 2020-2026 (USD MILLION)
TABLE 37. EUROPE INSPECTION MACHINE MARKET VALUE, BY END USER, 2020-2026 (USD MILLION)
TABLE 38. EUROPE INSPECTION MACHINE MARKET VALUE, BY PACKAGING TYPE, 2020-2026 (USD MILLION)
TABLE 39. EUROPE INSPECTION MACHINE MARKET VALUE, BY PRODUCT, 2020-2026 (USD MILLION)
TABLE 40. EUROPE INSPECTION MACHINE MARKET VALUE, BY TYPE, 2020-2026 (USD MILLION)
TABLE 41. GERMANY INSPECTION MACHINE MARKET VALUE, BY END USER, 2020-2026 (USD MILLION)
TABLE 42. GERMANY INSPECTION MACHINE MARKET VALUE, BY PACKAGING TYPE, 2020-2026 (USD MILLION)
TABLE 43. GERMANY INSPECTION MACHINE MARKET VALUE, BY PRODUCT, 2020-2026 (USD MILLION)
TABLE 44. GERMANY INSPECTION MACHINE MARKET VALUE, BY TYPE, 2020-2026 (USD MILLION)
TABLE 45. U.K INSPECTION MACHINE MARKET VALUE, BY END USER, 2020-2026 (USD MILLION)
TABLE 46. U.K INSPECTION MACHINE MARKET VALUE, BY PACKAGING TYPE, 2020-2026 (USD MILLION)
TABLE 47. U.K INSPECTION MACHINE MARKET VALUE, BY PRODUCT, 2020-2026 (USD MILLION)
TABLE 48. U.K INSPECTION MACHINE MARKET VALUE, BY TYPE, 2020-2026 (USD MILLION)
TABLE 49. FRANCE INSPECTION MACHINE MARKET VALUE, BY END USER, 2020-2026 (USD MILLION)
TABLE 50. FRANCE INSPECTION MACHINE MARKET VALUE, BY PACKAGING TYPE, 2020-2026 (USD MILLION)
TABLE 51. FRANCE INSPECTION MACHINE MARKET VALUE, BY PRODUCT, 2020-2026 (USD MILLION)
TABLE 52. FRANCE INSPECTION MACHINE MARKET VALUE, BY TYPE, 2020-2026 (USD MILLION)
TABLE 53. ROE INSPECTION MACHINE MARKET VALUE, BY END USER, 2020-2026 (USD MILLION)
TABLE 54. ROE INSPECTION MACHINE MARKET VALUE, BY PACKAGING TYPE, 2020-2026 (USD MILLION)
TABLE 55. ROE INSPECTION MACHINE MARKET VALUE, BY PRODUCT, 2020-2026 (USD MILLION)
TABLE 56. ROE INSPECTION MACHINE MARKET VALUE, BY TYPE, 2020-2026 (USD MILLION)
TABLE 57. ASIA PACIFIC INSPECTION MACHINE MARKET VALUE, BY COUNTRY, 2020-2026 (USD MILLION)
TABLE 58. ASIA PACIFIC INSPECTION MACHINE MARKET VALUE, BY END USER, 2020-2026 (USD MILLION)
TABLE 59. ASIA PACIFIC INSPECTION MACHINE MARKET VALUE, BY PACKAGING TYPE, 2020-2026 (USD MILLION)
TABLE 60. ASIA PACIFIC INSPECTION MACHINE MARKET VALUE, BY PRODUCT, 2020-2026 (USD MILLION)
TABLE 61. ASIA PACIFIC INSPECTION MACHINE MARKET VALUE, BY TYPE, 2020-2026 (USD MILLION)
TABLE 62. CHINA INSPECTION MACHINE MARKET VALUE, BY END USER, 2020-2026 (USD MILLION)
TABLE 63. CHINA INSPECTION MACHINE MARKET VALUE, BY PACKAGING TYPE, 2020-2026 (USD MILLION)
TABLE 64. CHINA INSPECTION MACHINE MARKET VALUE, BY PRODUCT, 2020-2026 (USD MILLION)
TABLE 65. CHINA INSPECTION MACHINE MARKET VALUE, BY TYPE, 2020-2026 (USD MILLION)
TABLE 66. JAPAN INSPECTION MACHINE MARKET VALUE, BY END USER, 2020-2026 (USD MILLION)
TABLE 67. JAPAN INSPECTION MACHINE MARKET VALUE, BY PACKAGING TYPE, 2020-2026 (USD MILLION)
TABLE 68. JAPAN INSPECTION MACHINE MARKET VALUE, BY PRODUCT, 2020-2026 (USD MILLION)
TABLE 69. JAPAN INSPECTION MACHINE MARKET VALUE, BY TYPE, 2020-2026 (USD MILLION)
TABLE 70. INDIA INSPECTION MACHINE MARKET VALUE, BY END USER, 2020-2026 (USD MILLION)
TABLE 71. INDIA INSPECTION MACHINE MARKET VALUE, BY PACKAGING TYPE, 2020-2026 (USD MILLION)
TABLE 72. INDIA INSPECTION MACHINE MARKET VALUE, BY PRODUCT, 2020-2026 (USD MILLION)
TABLE 73. INDIA INSPECTION MACHINE MARKET VALUE, BY TYPE, 2020-2026 (USD MILLION)
TABLE 74. REST OF ASIA PACIFIC INSPECTION MACHINE MARKET VALUE, BY END USER, 2020-2026 (USD MILLION)
TABLE 75. REST OF ASIA PACIFIC INSPECTION MACHINE MARKET VALUE, BY PACKAGING TYPE, 2020-2026 (USD MILLION)
TABLE 76. REST OF ASIA PACIFIC INSPECTION MACHINE MARKET VALUE, BY PRODUCT, 2020-2026 (USD MILLION)
TABLE 77. REST OF ASIA PACIFIC INSPECTION MACHINE MARKET VALUE, BY TYPE, 2020-2026 (USD MILLION)
TABLE 78. REST OF WORLD INSPECTION MACHINE MARKET VALUE, BY END USER, 2020-2026 (USD MILLION)
TABLE 79. REST OF WORLD INSPECTION MACHINE MARKET VALUE, BY PACKAGING TYPE, 2020-2026 (USD MILLION)
TABLE 80. REST OF WORLD INSPECTION MACHINE MARKET VALUE, BY PRODUCT, 2020-2026 (USD MILLION)
TABLE 81. REST OF WORLD INSPECTION MACHINE MARKET VALUE, BY TYPE, 2020-2026 (USD MILLION)
TABLE 82. ROBERT BOSCH GMBH: OVERVIEW
TABLE 83. ROBERT BOSCH GMBH: STRATEGIC SNAPSHOT
TABLE 84. ROBERT BOSCH GMBH: BUSINESS FOCUS
TABLE 85. ROBERT BOSCH GMBH: PRODUCT/SERVICE PORTFOLIO
TABLE 86. BREVETTI C.E.A. SPA : OVERVIEW
TABLE 87. BREVETTI C.E.A. SPA : STRATEGIC SNAPSHOT
TABLE 88. BREVETTI C.E.A. SPA : BUSINESS FOCUS
TABLE 89. BREVETTI C.E.A. SPA : PRODUCT/SERVICE PORTFOLIO
TABLE 90. KÖRBER AG : OVERVIEW
TABLE 91. KÖRBER AG : STRATEGIC SNAPSHOT
TABLE 92. KÖRBER AG : BUSINESS FOCUS
TABLE 93. KÖRBER AG : PRODUCT/SERVICE PORTFOLIO
TABLE 94. METTLER-TOLEDO : OVERVIEW
TABLE 95. METTLER-TOLEDO : STRATEGIC SNAPSHOT
TABLE 96. METTLER-TOLEDO : BUSINESS FOCUS
TABLE 97. METTLER-TOLEDO : PRODUCT/SERVICE PORTFOLIO
TABLE 98. TELEDYNE TECHNOLOGIES INCORPORATED : OVERVIEW
TABLE 99. TELEDYNE TECHNOLOGIES INCORPORATED : STRATEGIC SNAPSHOT
TABLE 100. TELEDYNE TECHNOLOGIES INCORPORATED : BUSINESS FOCUS
TABLE 101. TELEDYNE TECHNOLOGIES INCORPORATED : PRODUCT/SERVICE PORTFOLIO
TABLE 102. OMRON CORPORATION: OVERVIEW
TABLE 103. OMRON CORPORATION: STRATEGIC SNAPSHOT
TABLE 104. OMRON CORPORATION: BUSINESS FOCUS
TABLE 105. OMRON CORPORATION: PRODUCT/SERVICE PORTFOLIO
TABLE 106. MITSUBISHI CHEMICAL HOLDINGS CORPORATION: OVERVIEW
TABLE 107. MITSUBISHI CHEMICAL HOLDINGS CORPORATION: STRATEGIC SNAPSHOT
TABLE 108. MITSUBISHI CHEMICAL HOLDINGS CORPORATION: BUSINESS FOCUS
TABLE 109. MITSUBISHI CHEMICAL HOLDINGS CORPORATION: PRODUCT/SERVICE PORTFOLIO
TABLE 110. COGNEX CORPORATION : OVERVIEW
TABLE 111. COGNEX CORPORATION : STRATEGIC SNAPSHOT
TABLE 112. COGNEX CORPORATION : BUSINESS FOCUS
TABLE 113. COGNEX CORPORATION : PRODUCT/SERVICE PORTFOLIO
TABLE 114. JEKSON VISION PRIVATE LIMITED : OVERVIEW
TABLE 115. JEKSON VISION PRIVATE LIMITED : STRATEGIC SNAPSHOT
TABLE 116. JEKSON VISION PRIVATE LIMITED : BUSINESS FOCUS
TABLE 117. JEKSON VISION PRIVATE LIMITED : PRODUCT/SERVICE PORTFOLIO
TABLE 118. THERMO FISHER SCIENTIFIC : OVERVIEW
TABLE 119. THERMO FISHER SCIENTIFIC : STRATEGIC SNAPSHOT
TABLE 120. THERMO FISHER SCIENTIFIC : BUSINESS FOCUS
TABLE 121. THERMO FISHER SCIENTIFIC : PRODUCT/SERVICE PORTFOLIO
Research Framework
Infoholic Research works on a holistic 360° approach in order to deliver high quality, validated and reliable information in our market reports. The Market estimation and forecasting involves following steps:
- Data Collation (Primary & Secondary)
- In-house Estimation (Based on proprietary data bases and Models)
- Market Triangulation
- Forecasting

Market related information is congregated from both primary and secondary sources.
Primary sources
Involved participants from all global stakeholders such as Solution providers, service providers, Industry associations, thought leaders etc. across levels such as CXOs, VPs and managers. Plus, our in-house industry experts having decades of industry experience contribute their consulting and advisory services.
Secondary sources
Include public sources such as regulatory frameworks, government IT spending, government demographic indicators, industry association statistics, and company publications along with paid sources such as Factiva, OneSource, Bloomberg among others.
![]()


