
Hyperspectral Imaging System Market by Product (Cameras and Accessories), Technology (Push broom, Snapshot, and Other Technologies), Application (Military Surveillance, Remote Sensing, Agriculture, Mining/Mineral Mapping, Environmental Monitoring, Other Remote Sensing Applications, Medical Diagnostics, Machine Vision & Optical Sorting, and Other Applications), and Geography (North America, Europe, APAC and RoW) – Global Forecast up to 2026
- November, 2020
- Domain: ICT - Software & Services
- Get Free 10% Customization in this Report
A Hyperspectral imaging system is defined as capturing and processing an image at various wavelengths. A normal human eye can see the light in three bands that are red, green, and blue of the visible spectrum, but hyperspectral imaging separates the spectrum into different bands, covering the visible and near-infrared range. In hyperspectral imaging, every pixel of the image conveys spectral information, which adds on a third dimension of values to the two-dimensional spatial image, producing a three-dimensional data cube said to be a hypercube data. There is a growth in deployment of imaging systems for high-quality imaging; screening and diagnosing due to better access and initiative from the government and other healthcare institutions and the focus of the manufacturers towards the development of healthcare hyperspectral imaging systems are the key factors that are strongly supporting the market growth. The Hyperspectral Imaging System Market is predicted to grow at a rate of 19.4% CAGR.
Research Methodology:
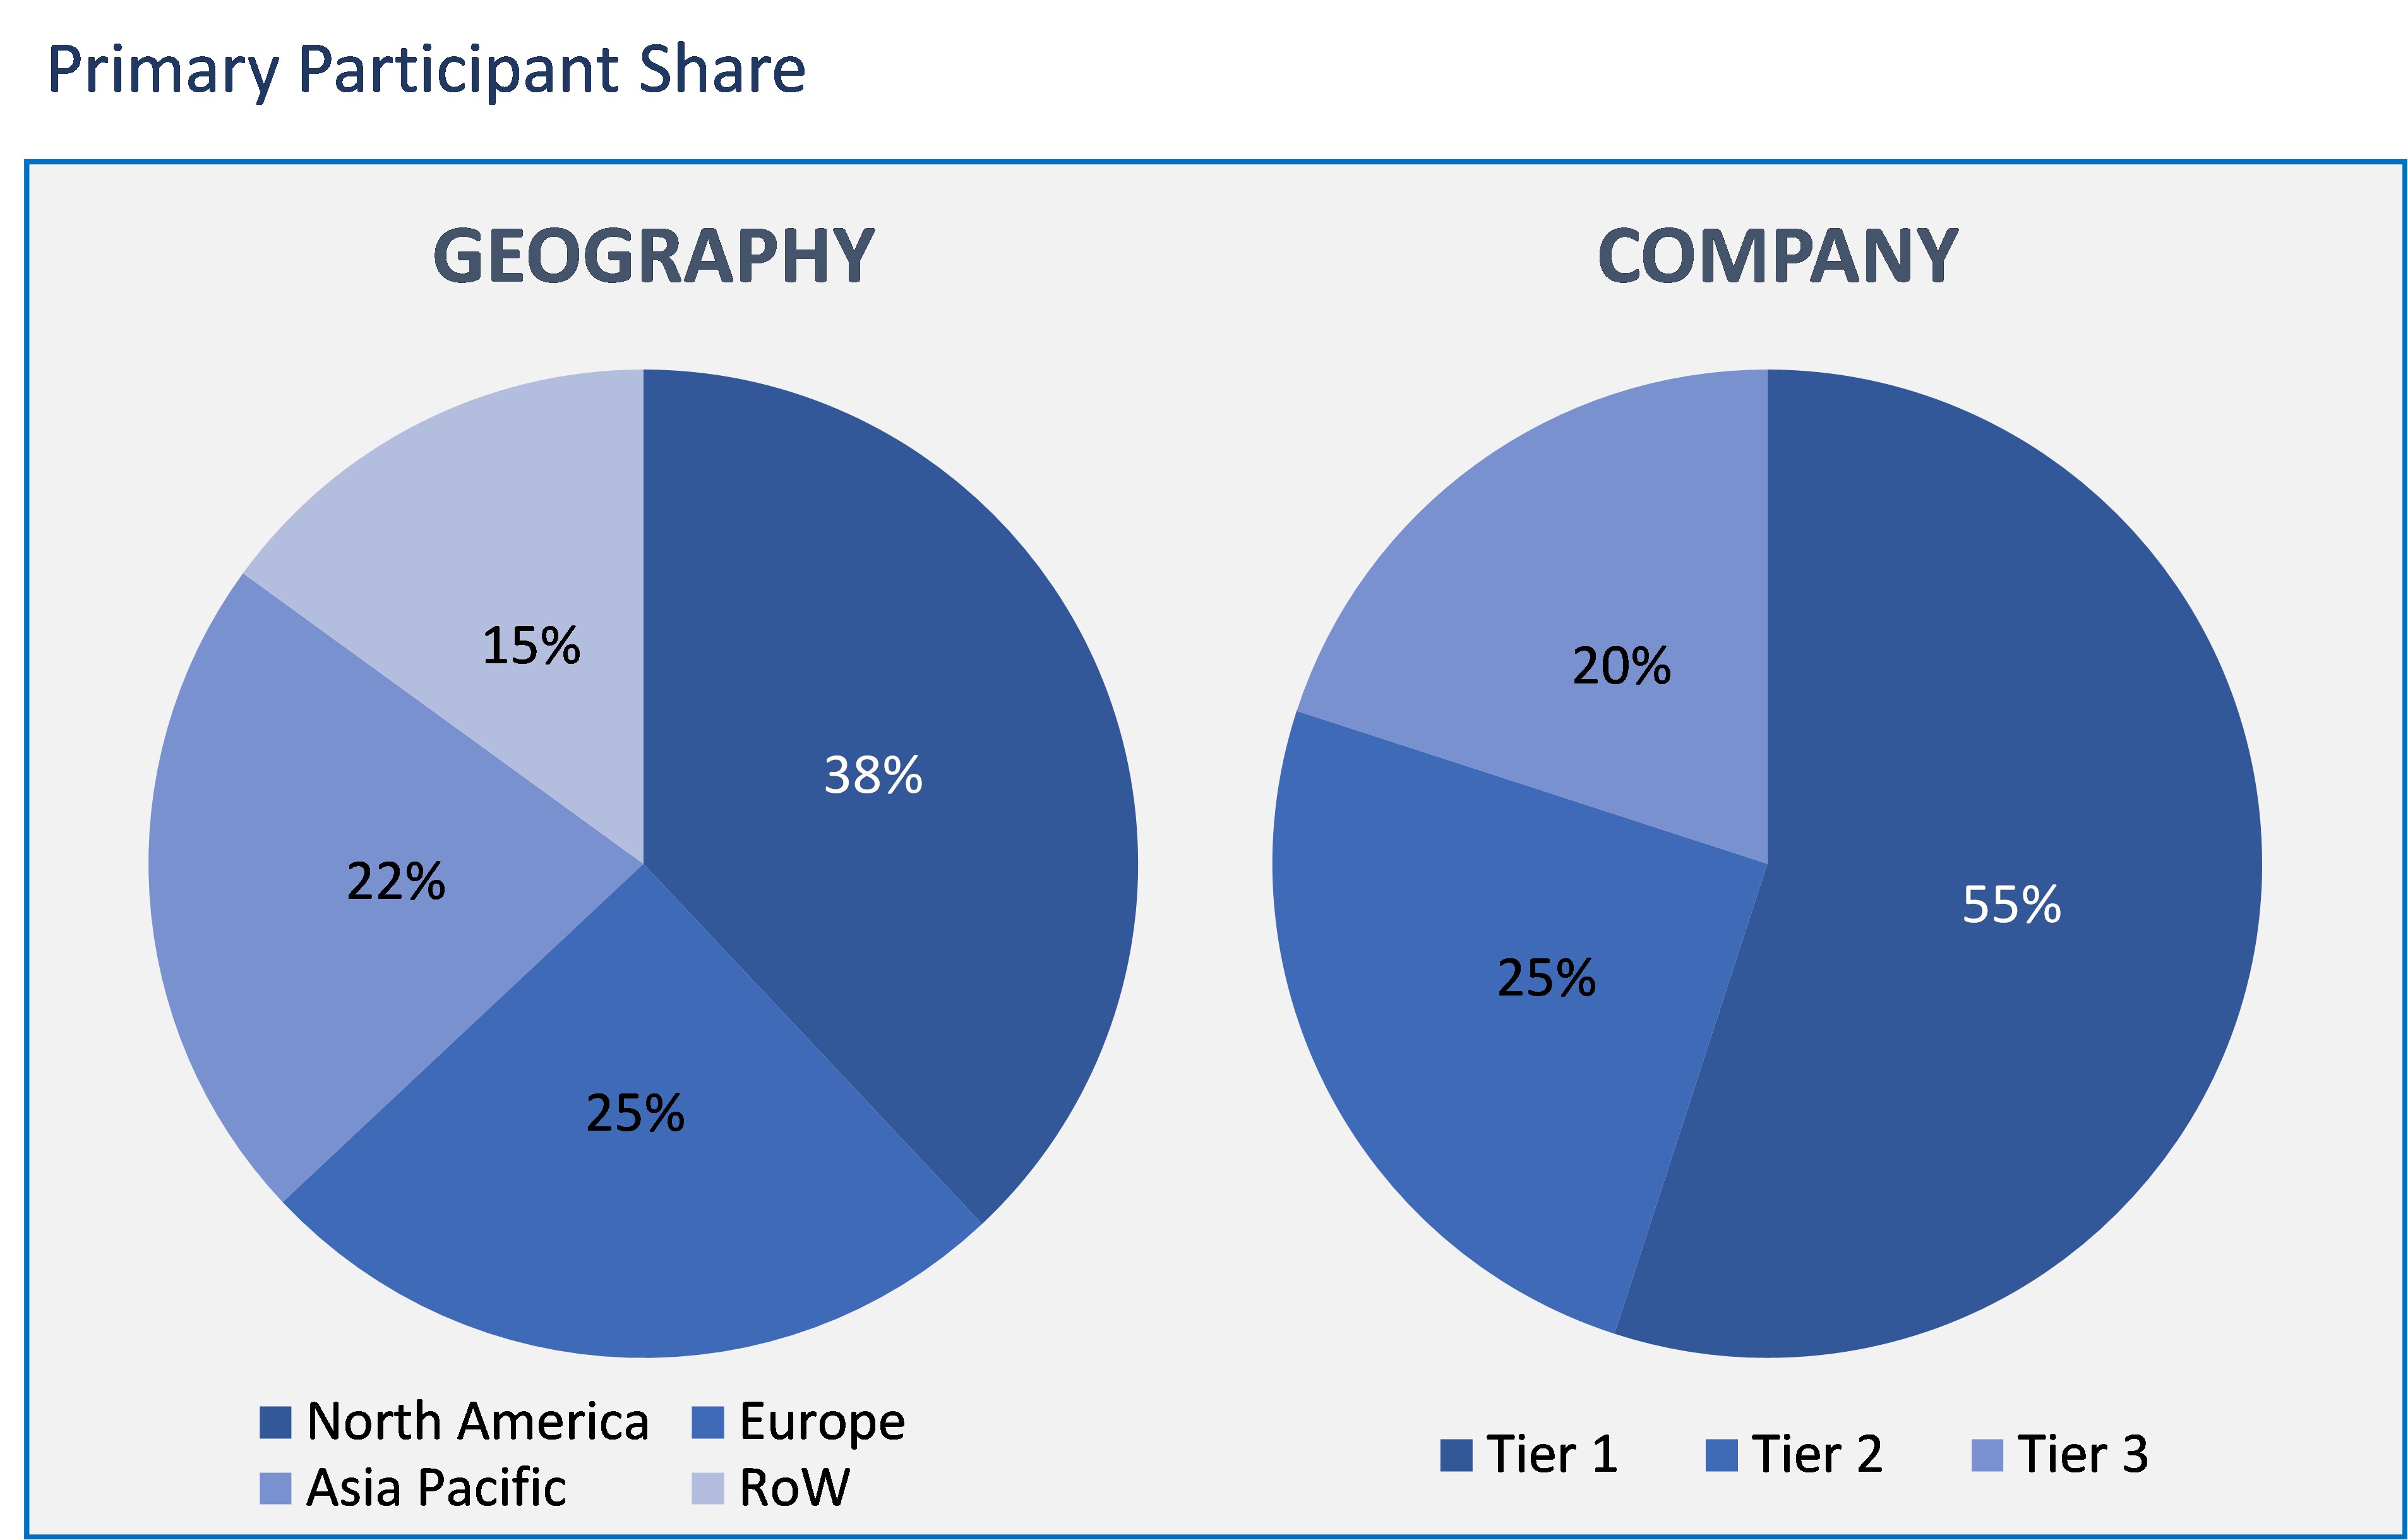
The healthcare fraud analytics market has been analyzed by utilizing the optimum combination of secondary sources and in-house methodology, along with an irreplaceable blend of primary insights. The real-time assessment of the market is an integral part of our market sizing and forecasting methodology. Our industry experts and panel of primary participants have helped in compiling relevant aspects with realistic parametric estimations for a comprehensive study. The participation share of different categories of primary participants is given below:
The Hyperspectral Imaging System Market scope is defined as follows:
Hyperspectral Imaging System Market, as per Product
- Cameras
- Accessories
Hyperspectral Imaging System Market, as per Technology
- Push broom
- Snapshot
- Other Technologies
Hyperspectral Imaging System Market, as per Application
- Military Surveillance
- Remote Sensing
- Agriculture
- Mining/Mineral Mapping
- Environmental Monitoring
- Other Remote Sensing Applications
- Medical Diagnostics
- Machine Vision & Optical Sorting
- Other Applications
Hyperspectral Imaging System Market, as per Geography
- North America
- Europe
- Asia Pacific
- Rest of the World
In terms of product, the market is bifurcated into two types, namely camera and accessories. The cameras segment is estimated to lead the hyperspectral imaging system market due to advancements in technology, the evolution of cost-effective hyperspectral imaging cameras, and an increase in the hyperspectral imaging systems incorporated in the healthcare sector and also in other sectors.
Whereas, in the technology-based segment, the hyperspectral imaging system market is sub-segmented into push broom, snapshot, and other technology. The push broom technology is broadly adopted technology compared to other technologies because of the noncomplex illumination, less time to capture, reduced illumination vulnerability, and heat load.
Majorly, the medical diagnostics segment is obtaining lucrative growth in the hyperspectral imaging system market. The growth is due to the increasing imaging technology in the diagnosis as it offers information on diagnostic about physiology, composition, and morphology of the tissue.
North America held the maximum share in the hyperspectral imaging system market compared to other regions, which include Europe, Asia Pacific, and the rest of the world. The maximum share is accredited to the highly developed healthcare infrastructure and increasing healthcare expenditure in this region, which is boosting the market.
Hyperspectral imaging system has a broad range of applications globally, including forensic, vegetation, crime detection, food quality, archaeology, diagnosis, and many others. Globally, the emerging application of the hyperspectral imaging system has increased the demand for a hyperspectral imaging system in non-invasive diagnosis, specifically in surgical guidance. These are the few other aspects responsible for growth in the global market.
The report of hyperspectral imaging system market consists of profiles of the market vendors as follows-Headwall Photonics, Inc., Spectral Imaging Ltd., Imec, Corning Incorporated, Specim, Norsk Elektro Optikk AS, Resonon Inc., Glana Sensors AB, Brandywine Photonics, Surface Optics Corporation, CytoViva, Inc., Applied Spectral Imaging Ltd., Raytheon Company, ChemImage Corporation, Telops, Cubert GmbH, BaySpec, Inc., HyperMed Imaging, Inc., inno-spec GmbH, Camlin Ltd., XIMEA, Photon etc. and Diaspective Vision GmbH.
Hence, the global healthcare hyperspectral imaging market has extensive growth opportunities not only in developed regions but also in the developing regions. The manufacturers are significantly focusing on improving healthcare hyperspectral imaging systems to assist image analysis and make the process faster of various imaging facilities, most importantly, during surgeries.
- The report gives a detailed perception of boosting hyperspectral imaging market growth in the next five years.
- Further presents a prediction of the hyperspectral imaging market size and its contribution to the parent market
- The study also presents precise expectations of forthcoming trends and preferences of end-users of the market.
- This research also depicts the hyperspectral imaging market's penetration across North America, APAC, Europe, and the Rest of the World.
- The market then provides a thorough analysis of the market players' hyperspectral imaging market competitive landscape and profiles.
- Executive Summary
- Industry Outlook
- Industry Overview
- Industry Trends
- Market Snapshot
- Market Definition
- Market Outlook
- PEST Analysis
- Porter Five Forces
- Related Markets
- Market characteristics
- Market Evolution
- Market Trends and Impact
- Advantages/Disadvantages of Market
- Regulatory Impact
- Market Offerings
- Market Segmentation
- Market Dynamics
- Drivers
- Restraints
- Opportunities
- DRO - Impact Analysis
- Product: Market Size & Analysis
- Overview
- Cameras
- Accessories
- Technology: Market Size & Analysis
- Overview
- Push broom
- Snapshot
- Other Technologies
- Application: Market Size & Analysis
- Overview
- Military Surveillance
- Remote Sensing
- Agriculture
- Mining/Mineral Mapping
- Environmental Monitoring
- Other Remote Sensing Applications
- Medical Diagnostics
- Machine Vision & Optical Sorting
- Other Applications
- Geography: Market Size & Analysis
- Overview
- North America
- Europe
- Asia Pacific
- Rest of the World
- Competitive Landscape
- Competitor Comparison Analysis
- Market Developments
- Mergers and Acquisitions, Legal, Awards, Partnerships
- Product Launches and execution
- Vendor Profiles
- Headwall Photonics, Inc
- Overview
- Financials
- Products & Services
- Recent Developments
- Business Strategy
- Spectral Imaging Ltd
- Overview
- Financials
- Products & Services
- Recent Developments
- Business Strategy
- Imec
- Overview
- Financials
- Products & Services
- Recent Developments
- Business Strategy
- Corning Incorporated
- Overview
- Financials
- Products & Services
- Recent Developments
- Business Strategy
- Specim
- Overview
- Financials
- Products & Services
- Recent Developments
- Business Strategy
- Norsk Elektro Optikk AS
- Overview
- Financials
- Products & Services
- Recent Developments
- Business Strategy
- Resonon Inc
- Overview
- Financials
- Products & Services
- Recent Developments
- Business Strategy
- Glana Sensors AB
- Overview
- Financials
- Products & Services
- Recent Developments
- Business Strategy
- Brandywine Photonics
- Overview
- Financials
- Products & Services
- Recent Developments
- Business Strategy
- Surface Optics Corporation
- Overview
- Financials
- Products & Services
- Recent Developments
- Business Strategy
- Headwall Photonics, Inc
- Companies to Watch
- CytoViva, Inc
- Overview
- Products & Services
- Business Strategy
- Applied Spectral Imaging Ltd
- Overview
- Products & Services
- Business Strategy
- Raytheon Company
- Overview
- Products & Services
- Business Strategy
- ChemImage Corporation
- Overview
- Products & Services
- Business Strategy
- Telops
- Overview
- Products & Services
- Business Strategy
- Cubert GmbH
- Overview
- Products & Services
- Business Strategy
- BaySpec, Inc
- Overview
- Products & Services
- Business Strategy
- HyperMed Imaging, Inc
- Overview
- Products & Services
- Business Strategy
- inno-spec GmbH
- Overview
- Products & Services
- Business Strategy
- Camlin Ltd
- Overview
- Products & Services
- Business Strategy
- XIMEA
- Overview
- Products & Services
- Business Strategy
- Photon etc
- Overview
- Products & Services
- Business Strategy
- Diaspective Vision GmbH
- Overview
- Products & Services
- Business Strategy
- CytoViva, Inc
- Analyst Opinion
- Annexure
- Report Scope
- Market Definitions
- Research Methodology
- Data Collation and In-house Estimation
- Market Triangulation
- Forecasting
- Report Assumptions
- Declarations
- Stakeholders
- Abbreviations
TABLE 1. GLOBAL HYPERSPECTRAL IMAGING SYSTEM MARKET VALUE, BY PRODUCT, 2020-2026 (USD BILLION)
TABLE 2. GLOBAL HYPERSPECTRAL IMAGING SYSTEM MARKET VALUE FOR CAMERAS, BY GEOGRAPHY, 2020-2026 (USD BILLION)
TABLE 3. GLOBAL HYPERSPECTRAL IMAGING SYSTEM MARKET VALUE FOR ACCESSORIES, BY GEOGRAPHY, 2020-2026 (USD BILLION)
TABLE 4. GLOBAL HYPERSPECTRAL IMAGING SYSTEM MARKET VALUE, BY TECHNOLOGY, 2020-2026 (USD BILLION)
TABLE 5. GLOBAL HYPERSPECTRAL IMAGING SYSTEM MARKET VALUE FOR PUSH BROOM, BY GEOGRAPHY, 2020-2026 (USD BILLION)
TABLE 6. GLOBAL HYPERSPECTRAL IMAGING SYSTEM MARKET VALUE FOR SNAPSHOT, BY GEOGRAPHY, 2020-2026 (USD BILLION)
TABLE 7. GLOBAL HYPERSPECTRAL IMAGING SYSTEM MARKET VALUE, BY APPLICATION, 2020-2026 (USD BILLION)
TABLE 8. GLOBAL HYPERSPECTRAL IMAGING SYSTEM MARKET VALUE FOR MILITARY SURVEILLANCE, 2020-2026 (USD BILLION)
TABLE 9. GLOBAL HYPERSPECTRAL IMAGING SYSTEMMARKET VALUE FOR PUBLIC HOSPITALS, BY GEOGRAPHY, 2020-2026 (USD BILLION)
TABLE 10. GLOBAL HYPERSPECTRAL IMAGING SYSTEM MARKET VALUE FOR REMOTE SENSING, BY GEOGRAPHY, 2020-2026 (USD BILLION)
TABLE 11. GLOBAL HYPERSPECTRAL IMAGING SYSTEM MARKET VALUE FOR AGRICULTURE, BY GEOGRAPHY, 2020-2026 (USD BILLION)
TABLE 12. GLOBAL HYPERSPECTRAL IMAGING SYSTEM MARKET VALUE FOR MINING/MINERAL MAPPING, BY GEOGRAPHY, 2020-2026 (USD BILLION)
TABLE 13. GLOBAL HYPERSPECTRAL IMAGING SYSTEM MARKET VALUE FOR ENVIRONMENTAL MONITORING, BY GEOGRAPHY, 2020-2026 (USD BILLION)
TABLE 14. GLOBAL HYPERSPECTRAL IMAGING SYSTEM MARKET VALUE FOR OTHER REMOTE SENSING APPLICATIONS, BY GEOGRAPHY, 2020-2026 (USD BILLION)
TABLE 15. GLOBAL HYPERSPECTRAL IMAGING SYSTEM MARKET VALUE FOR MEDICAL DIAGNOSTICS, BY GEOGRAPHY, 2020-2026 (USD BILLION)
TABLE 16. GLOBAL HYPERSPECTRAL IMAGING SYSTEM MARKET VALUE FOR MACHINE VISION & OPTICAL SORTING, BY GEOGRAPHY, 2020-2026 (USD BILLION)
TABLE 17. GLOBAL HYPERSPECTRAL IMAGING SYSTEM MARKET VALUE FOR OTHER APPLICATIONS, BY GEOGRAPHY, 2020-2026 (USD BILLION)
TABLE 18. NORTH AMERICA HYPERSPECTRAL IMAGING SYSTEM MARKET VALUE, BY COUNTRY, 2020-2026 (USD BILLION)
TABLE 19. NORTH AMERICA HYPERSPECTRAL IMAGING SYSTEM MARKET VALUE, BY PRODUCT, 2020-2026 (USD BILLION)
TABLE 20. NORTH AMERICA HYPERSPECTRAL IMAGING SYSTEM MARKET VALUE, BY TECHNOLOGY, 2020-2026 (USD BILLION)
TABLE 21. NORTH AMERICA HYPERSPECTRAL IMAGING SYSTEM MARKET VALUE, BY APPLICATION, 2020-2026 (USD BILLION)
TABLE 22. U.S HYPERSPECTRAL IMAGING SYSTEM MARKET VALUE, BY PRODUCT, 2020-2026 (USD BILLION)
TABLE 23. U.S HYPERSPECTRAL IMAGING SYSTEM MARKET VALUE, BY TECHNOLOGY, 2020-2026 (USD BILLION)
TABLE 24. U.S HYPERSPECTRAL IMAGING SYSTEM MARKET VALUE, BY APPLICATION, 2020-2026 (USD BILLION)
TABLE 25. CANADA HYPERSPECTRAL IMAGING SYSTEM MARKET VALUE, BY PRODUCT, 2020-2026 (USD BILLION)
TABLE 26. CANADA HYPERSPECTRAL IMAGING SYSTEM MARKET VALUE, BY TECHNOLOGY, 2020-2026 (USD BILLION)
TABLE 27. CANADA HYPERSPECTRAL IMAGING SYSTEM MARKET VALUE, BY APPLICATION, 2020-2026 (USD BILLION)
TABLE 28. EUROPE HYPERSPECTRAL IMAGING SYSTEM MARKET VALUE, BY COUNTRY, 2020-2026 (USD BILLION)
TABLE 29. EUROPE HYPERSPECTRAL IMAGING SYSTEM MARKET VALUE, BY PRODUCT, 2020-2026 (USD BILLION)
TABLE 30. EUROPE HYPERSPECTRAL IMAGING SYSTEM MARKET VALUE, BY TECHNOLOGY, 2020-2026 (USD BILLION)
TABLE 31. EUROPE HYPERSPECTRAL IMAGING SYSTEM MARKET VALUE, APPLICATION, 2020-2026 (USD BILLION)
TABLE 32. GERMANY HYPERSPECTRAL IMAGING SYSTEM MARKET VALUE, BY PRODUCT, 2020-2026 (USD BILLION)
TABLE 33. GERMANY HYPERSPECTRAL IMAGING SYSTEM MARKET VALUE, BY TECHNOLOGY, 2020-2026 (USD BILLION)
TABLE 34. GERMANY HYPERSPECTRAL IMAGING SYSTEM MARKET VALUE, BY APPLICATION, 2020-2026 (USD BILLION)
TABLE 35. U.K HYPERSPECTRAL IMAGING SYSTEM MARKET VALUE, BY PRODUCT, 2020-2026 (USD BILLION)
TABLE 36. U.K HYPERSPECTRAL IMAGING SYSTEM MARKET VALUE, BY TECHNOLOGY, 2020-2026 (USD BILLION)
TABLE 37. U.K HYPERSPECTRAL IMAGING SYSTEM MARKET VALUE, BY APPLICATION, 2020-2026 (USD BILLION)
TABLE 38. FRANCE HYPERSPECTRAL IMAGING SYSTEM MARKET VALUE, BY PRODUCT, 2020-2026 (USD BILLION)
TABLE 39. FRANCE HYPERSPECTRAL IMAGING SYSTEM MARKET VALUE, BY TECHNOLOGY, 2020-2026 (USD BILLION)
TABLE 40. FRANCE HYPERSPECTRAL IMAGING SYSTEM MARKET VALUE, BY APPLICATION, 2020-2026 (USD BILLION)
TABLE 41. ITALY HYPERSPECTRAL IMAGING SYSTEM MARKET VALUE, BY PRODUCT, 2020-2026 (USD BILLION)
TABLE 42. ITALY HYPERSPECTRAL IMAGING SYSTEM MARKET VALUE, BY TECHNOLOGY, 2020-2026 (USD BILLION)
TABLE 43. ITALY HYPERSPECTRAL IMAGING SYSTEM MARKET VALUE, BY APPLICATION, 2020-2026 (USD BILLION)
TABLE 44. SPAIN HYPERSPECTRAL IMAGING SYSTEM MARKET VALUE, BY PRODUCT, 2020-2026 (USD BILLION)
TABLE 45. SPAIN HYPERSPECTRAL IMAGING SYSTEM MARKET VALUE, BY TECHNOLOGY, 2020-2026 (USD BILLION)
TABLE 46. SPAIN HYPERSPECTRAL IMAGING SYSTEM MARKET VALUE, BY APPLICATION, 2020-2026 (USD BILLION)
TABLE 47. ROE HYPERSPECTRAL IMAGING SYSTEM MARKET VALUE, BY PRODUCT, 2020-2026 (USD BILLION)
TABLE 48. ROE HYPERSPECTRAL IMAGING SYSTEM MARKET VALUE, BY TECHNOLOGY, 2020-2026 (USD BILLION)
TABLE 49. ROE HYPERSPECTRAL IMAGING SYSTEM MARKET VALUE, BY APPLICATION, 2020-2026 (USD BILLION)
TABLE 50. ASIA PACIFC HYPERSPECTRAL IMAGING SYSTEM MARKET VALUE, BY COUNTRY, 2020-2026 (USD BILLION)
TABLE 51. ASIA PACIFC HYPERSPECTRAL IMAGING SYSTEM MARKET VALUE, BY PRODUCT, 2020-2026 (USD BILLION)
TABLE 52. ASIA PACIFC HYPERSPECTRAL IMAGING SYSTEM MARKET VALUE, BY TECHNOLOGY, 2020-2026 (USD BILLION)
TABLE 53. ASIA PACIFC HYPERSPECTRAL IMAGING SYSTEM MARKET VALUE, BY APPLICATION, 2020-2026 (USD BILLION)
TABLE 54. CHINA HYPERSPECTRAL IMAGING SYSTEM MARKET VALUE, BY PRODUCT, 2020-2026 (USD BILLION)
TABLE 55. CHINA HYPERSPECTRAL IMAGING SYSTEM MARKET VALUE, BY TECHNOLOGY, 2020-2026 (USD BILLION)
TABLE 56. CHINA HYPERSPECTRAL IMAGING SYSTEM MARKET VALUE, BY APPLICATION, 2020-2026 (USD BILLION)
TABLE 57. INDIA HYPERSPECTRAL IMAGING SYSTEM MARKET VALUE, BY PRODUCT, 2020-2026 (USD BILLION)
TABLE 58. INDIA HYPERSPECTRAL IMAGING SYSTEM MARKET VALUE, BY TECHNOLOGY, 2020-2026 (USD BILLION)
TABLE 59. INDIA HYPERSPECTRAL IMAGING SYSTEM MARKET VALUE, BY APPLICATION, 2020-2026 (USD BILLION)
TABLE 60. JAPAN HYPERSPECTRAL IMAGING SYSTEM MARKET VALUE, BY PRODUCT, 2020-2026 (USD BILLION)
TABLE 61. JAPAN HYPERSPECTRAL IMAGING SYSTEM MARKET VALUE, BY TECHNOLOGY, 2020-2026 (USD BILLION)
TABLE 62. JAPAN HYPERSPECTRAL IMAGING SYSTEM MARKET VALUE, BY APPLICATION, 2020-2026 (USD BILLION)
TABLE 63. REST OF APAC HYPERSPECTRAL IMAGING SYSTEM MARKET VALUE, BY PRODUCT, 2020-2026 (USD BILLION)
TABLE 64. REST OF APAC HYPERSPECTRAL IMAGING SYSTEM MARKET VALUE, BY TECHNOLOGY, 2020-2026 (USD BILLION)
TABLE 65. REST OF APAC HYPERSPECTRAL IMAGING SYSTEM MARKET VALUE, BY APPLICATION, 2020-2026 (USD BILLION)
TABLE 66. REST OF WORLD HYPERSPECTRAL IMAGING SYSTEM MARKET VALUE, BY PRODUCT, 2020-2026 (USD BILLION)
TABLE 67. REST OF WORLD HYPERSPECTRAL IMAGING SYSTEM MARKET VALUE, BY TECHNOLOGY, 2020-2026 (USD BILLION)
TABLE 68. REST OF WORLD HYPERSPECTRAL IMAGING SYSTEM MARKET VALUE, BY APPLICATION, 2020-2026 (USD BILLION)
TABLE 69. HEADWALL PHOTONICS, INC: FINANCIALS
TABLE 70. HEADWALL PHOTONICS, INC: PRODUCTS & SERVICES
TABLE 71. HEADWALL PHOTONICS, INC: RECENT DEVELOPMENTS
TABLE 72. SPECTRAL IMAGING LTD: FINANCIALS
TABLE 73. SPECTRAL IMAGING LTD: PRODUCTS & SERVICES
TABLE 74. SPECTRAL IMAGING LTD: RECENT DEVELOPMENTS
TABLE 75. IMEC: FINANCIALS
TABLE 76. IMEC: PRODUCTS & SERVICES
TABLE 77. IMEC: RECENT DEVELOPMENTS
TABLE 78. CORNING INCORPORATED: FINANCIALS
TABLE 79. CORNING INCORPORATED: PRODUCTS & SERVICES
TABLE 80. CORNING INCORPORATED: RECENT DEVELOPMENTS
TABLE 81. SPECIM: FINANCIALS
TABLE 82. SPECIM: PRODUCTS & SERVICES
TABLE 83. SPECIM: RECENT DEVELOPMENTS
TABLE 84. NORSK ELEKTRO OPTIKK AS: FINANCIALS
TABLE 85. NORSK ELEKTRO OPTIKK AS: PRODUCTS & SERVICES
TABLE 86. NORSK ELEKTRO OPTIKK AS: RECENT DEVELOPMENTS
TABLE 87. RESONON INC: FINANCIALS
TABLE 88. RESONON INC: PRODUCTS & SERVICES
TABLE 89. RESONON INC: RECENT DEVELOPMENTS
TABLE 90. GLANA SENSORS AB: FINANCIALS
TABLE 91. GLANA SENSORS AB: PRODUCTS & SERVICES
TABLE 92. GLANA SENSORS AB: RECENT DEVELOPMENTS
TABLE 93. BRANDYWINE PHOTONICS: FINANCIALS
TABLE 94. BRANDYWINE PHOTONICS: PRODUCTS & SERVICES
TABLE 95. BRANDYWINE PHOTONICS: RECENT DEVELOPMENTS
TABLE 96. SURFACE OPTICS CORPORATION: FINANCIALS
TABLE 97. SURFACE OPTICS CORPORATION: PRODUCTS & SERVICES
TABLE 98. SURFACE OPTICS CORPORATION: RECENT DEVELOPMENTS
TABLE 99. CYTOVIVA, INC: PRODUCTS & SERVICES
TABLE 100. APPLIED SPECTRAL IMAGING LTD: PRODUCTS & SERVICES
TABLE 101. RAYTHEON COMPANY: PRODUCTS & SERVICES
TABLE 102. CHEMIMAGE CORPORATION: PRODUCTS & SERVICES
TABLE 103. TELOPS: PRODUCTS & SERVICES
TABLE 104. CUBERT GMBH: PRODUCTS & SERVICES
TABLE 105. BAYSPEC, INC: PRODUCTS & SERVICES
TABLE 106. HYPERMED IMAGING, INC: PRODUCTS & SERVICES
TABLE 107. INNO-SPEC GMBH: PRODUCTS & SERVICES
TABLE 108. CAMLIN LTD: PRODUCTS & SERVICES
TABLE 109. XIMEA: PRODUCTS & SERVICES
TABLE 110. PHOTON ETC: PRODUCTS & SERVICES
TABLE 111. DIASPECTIVE VISION GMBH: PRODUCTS & SERVICES
Research Framework
Infoholic Research works on a holistic 360° approach in order to deliver high quality, validated and reliable information in our market reports. The Market estimation and forecasting involves following steps:
- Data Collation (Primary & Secondary)
- In-house Estimation (Based on proprietary data bases and Models)
- Market Triangulation
- Forecasting

Market related information is congregated from both primary and secondary sources.
Primary sources
Involved participants from all global stakeholders such as Solution providers, service providers, Industry associations, thought leaders etc. across levels such as CXOs, VPs and managers. Plus, our in-house industry experts having decades of industry experience contribute their consulting and advisory services.
Secondary sources
Include public sources such as regulatory frameworks, government IT spending, government demographic indicators, industry association statistics, and company publications along with paid sources such as Factiva, OneSource, Bloomberg among others.
![]()


