
Heparin Sales Market By Type (Low Molecular Weight Heparin, Ultra-low Molecular Weight Heparin, and Unfractionated Heparin), Application (Venous Thromboembolism, Atrial Fibrillation, Renal Impairment, Coronary Artery Disease and Others), End-Use (Outpatient and Inpatient) and Geography – Global Forecast up to 2026
- July, 2021
- Domain: Healthcare - Pharmaceuticals
- Get Free 10% Customization in this Report
Heparin is a sulfur-containing polysaccharide that performs as an anticoagulant or a blood thinner. It impedes the development of blood clots inside blood vessels and is also used to treat heart conditions such as unstable angina. Heparin is also used during dialysis and blood transfusion, and post-surgeries. It is generally injected directly into the muscle or the veins to break down the clots and maintain the effortless fluidity of the blood. The growing old population is principally affected by venous thrombosis, which will boost heparin sales market growth. Venous thromboembolism (VTE) is highly frequent in the old population; although, it can occur at any age. The increasing occurrence of several diseases such as heart failure can result in thrombosis and is most likely to occur in old age than the young age population. However, the adverse effects, including high bleeding incurred with heparin, are the key impeding factors of the market. The Heparin Sales Market is expected to grow at the rate of 5.2% CAGR by 2026.
Research Methodology:
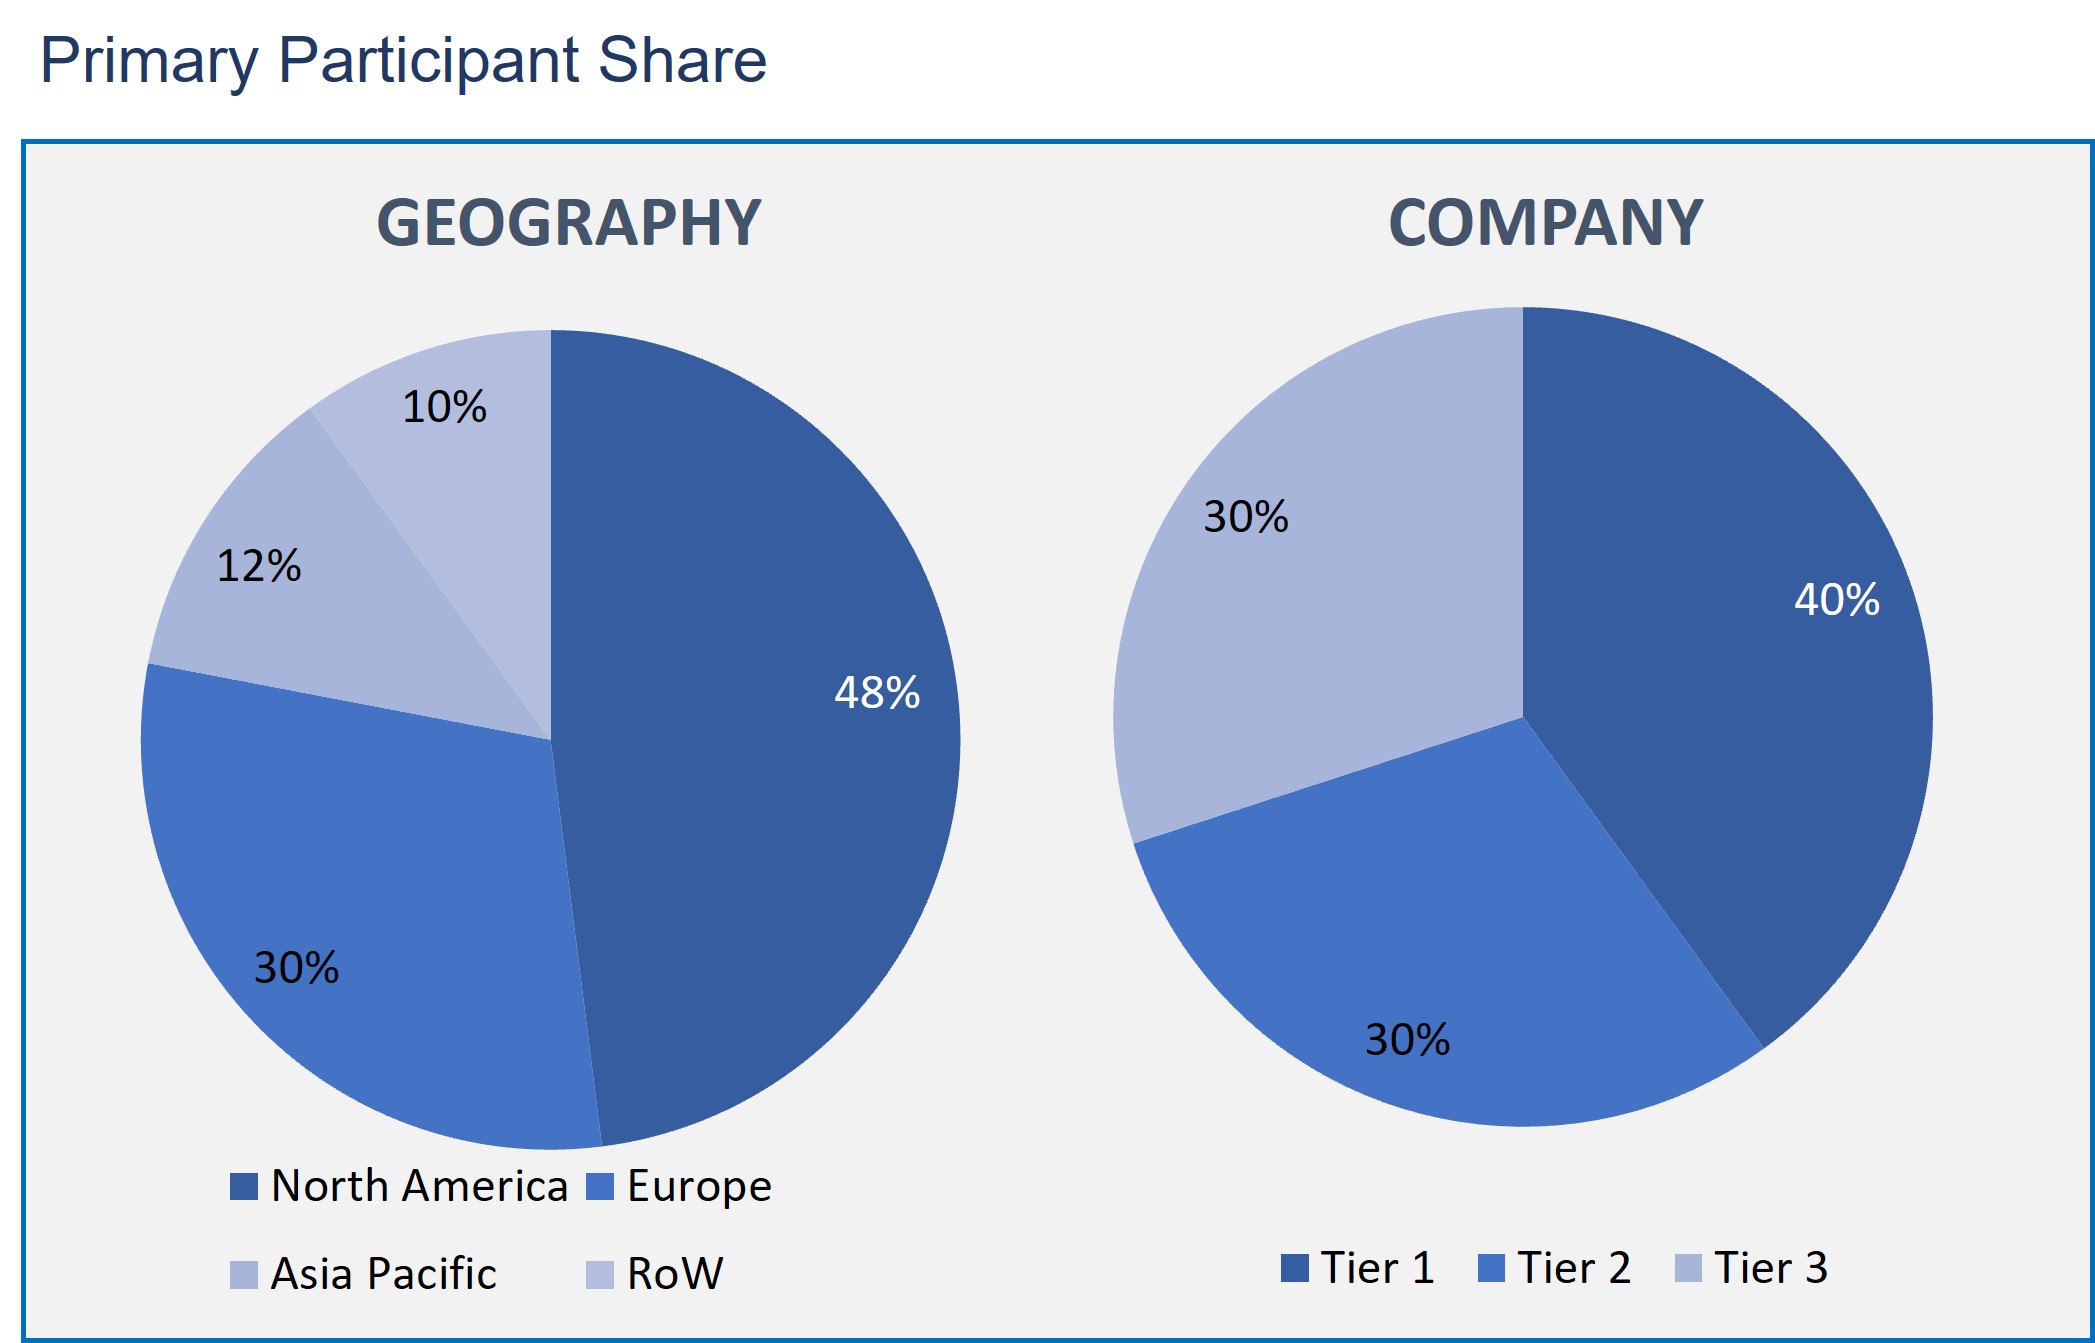
The Heparin Sales Market has been analyzed by utilizing the optimum combination of secondary sources and in-house methodology and a unique balance of primary insights. The real-time valuation of the market is an integral part of our forecasting and market sizing methodology. Industry experts and our primary participants have helped to compile related aspects with accurate parametric estimations for a complete study. The primary participants share is given below:
Heparin Sales Market on the basis of Type
- Low Molecular Weight Heparin
- Ultra-low Molecular Weight Heparin
- Unfractionated Heparin
Heparin Sales Market on the basis of Application
- Venous Thromboembolism
- Atrial Fibrillation
- Renal Impairment
- Coronary Artery Disease
- Others
Heparin Sales Market on the basis of End-Use
- Outpatient
- Inpatient
Heparin Sales Market on the basis of Geography
- North America
- Europe
- Asia Pacific
- Rest of the World
The low molecular weight heparin segment has the most significant share in the market. This is due to the high anticipated anticoagulant effect of the product. Moreover, the significant share is due to the high adoption of the low molecular weight heparin in the developed countries, the high pricing of these product offerings, and the more safety profiles of this type of product compared to other products.
Further, the venous thromboembolism segment is expected to register the highest growth rate over the forecasted years. The highest growth is attributed to the increasing awareness about thrombosis and the increasing cases of venous thromboembolism. The venous thromboembolism is further categorized into pulmonary embolism (PE) and deep vein thrombosis (DVT).
As per the end-user, the market is bifurcated into outpatient and inpatient. The outpatient segment is projected to have a substantial growth rate in the market. The preference for a subcutaneous route of administration among the patients is increasing, which is a key factor for the segment growth. Moreover, the cost of outpatient treatment is low when compared to inpatient hospital costs.
North America has held a maximum share in the heparin sales market compared to other regions. The maximum share is accredited to the growing injuries in sports and rising cardiovascular disorders. In addition, the huge healthcare expenditure levels, rising patient awareness, and experienced healthcare infrastructure in this region are the factors attributed to the region’s maximum share.
Few factors that are majorly accelerating the global heparin market growth are the rising number of accidents and medical surgeries globally, which is increasing demand for heparin. The growing disorders such as cardiovascular disorders will spur the demand for heparin. An increase in the investments to develop healthcare infrastructure and the increasing awareness among patients are also expected to boost the market demand.
The major market companies of the heparin sales market include Nanjing King-Friend Biochemical Pharmaceutical Co. Ltd., Aspen Pharmacare Holdings Ltd., Baxter International Inc., Laboratorios Farmaceuticos Rovi SA, Eisai Co. Ltd., Fresenius SE & Co. KGaA, Hikma Pharmaceuticals Plc, Mylan NV, Pfizer Inc., and Sanofi S.A.
Henceforth, the increasing prevalence of the diseases such as coronary heart disease and myocardial infections and the increasing number of accidents and injuries lead to blood clots during surgeries. Heparin is playing a prominent role in preventing blood clots from forming.
- This report of the heparin sales market consists of qualitative factors such as factors propelling and restraining and generating opportunities.
- This study depicts the competitive analysis of significant players in the heparin sales market and their strategic developments in the product.
- This research provides the analysis based on qualitative and quantitative of the market segmented.
- Additionally, this report consists of actual market shares and forecasts for all the segments which are mentioned in the report.
- Executive Summary
- Industry Outlook
- Industry Overview
- Industry Trends
- Market Snapshot
- Market Definition
- Market Outlook
- Porter Five Forces
- Related Markets
- Market characteristics
- Market Overview
- Market Segmentation
- Market Dynamics
- Drivers
- Restraints
- Opportunities
- DRO - Impact Analysis
- Type: Market Size & Analysis
- Overview
- Low Molecular Weight Heparin
- Ultra-low Molecular Weight Heparin
- Unfractionated Heparin
- Application: Market Size & Analysis
- Overview
- Venous Thromboembolism
- Atrial Fibrillation
- Renal Impairment
- Coronary Artery Disease
- Others
- End-Use: Market Size & Analysis
- Overview
- Outpatient
- Inpatient
- Geography: Market Size & Analysis
- Overview
- North America
- Europe
- Asia Pacific
- Rest of the World
- Competitive Landscape
- Competitor Comparison Analysis
- Market Developments
- Mergers and Acquisitions, Legal, Awards, Partnerships
- Product Launches and execution
- Vendor Profiles
- Nanjing King-Friend Biochemical Pharmaceutical Co. Ltd
- Overview
- Financial Overview
- Product Offerings
- Developments
- Business Strategy
- Aspen Pharmacare Holdings Ltd.
- Overview
- Financial Overview
- Product Offerings
- Developments
- Business Strategy
- Baxter International Inc.
- Overview
- Financial Overview
- Product Offerings
- Developments
- Business Strategy
- Laboratorios Farmaceuticos Rovi SA
- Overview
- Financial Overview
- Product Offerings
- Developments
- Business Strategy
- Eisai Co. Ltd.
- Overview
- Financial Overview
- Product Offerings
- Developments
- Business Strategy
- Fresenius SE & Co. KGaA
- Overview
- Financial Overview
- Product Offerings
- Developments
- Business Strategy
- Hikma Pharmaceuticals Plc
- Overview
- Financial Overview
- Product Offerings
- Developments
- Business Strategy
- Mylan NV
- Overview
- Financial Overview
- Product Offerings
- Developments
- Business Strategy
- Pfizer Inc.
- Overview
- Financial Overview
- Product Offerings
- Developments
- Business Strategy
- Sanofi S.A.
- Overview
- Financial Overview
- Product Offerings
- Developments
- Business Strategy
- Nanjing King-Friend Biochemical Pharmaceutical Co. Ltd
- Analyst Opinion
- Annexure
- Report Scope
- Market Definitions
- Research Methodology
- Data Collation and In-house Estimation
- Market Triangulation
- Forecasting
- Report Assumptions
- Declarations
- Stakeholders
- Abbreviations
TABLE 1. GLOBAL HEPARIN SALES MARKET VALUE, BY TYPE, 2020-2026 (USD BILLION)
TABLE 2. GLOBAL HEPARIN SALES MARKET VALUE FOR LOW MOLECULAR WEIGHT HEPARIN, BY GEOGRAPHY, 2020-2026 (USD BILLION)
TABLE 3. GLOBAL HEPARIN SALES MARKET VALUE FOR ULTRA-LOW MOLECULAR WEIGHT HEPARIN, BY GEOGRAPHY, 2020-2026 (USD BILLION)
TABLE 4. GLOBAL HEPARIN SALES MARKET VALUE FOR UNFRACTIONATED HEPARIN, BY GEOGRAPHY, 2020-2026 (USD BILLION)
TABLE 5. GLOBAL HEPARIN SALES MARKET VALUE, BY APPLICATION, BY GEOGRAPHY, 2020-2026 (USD BILLION)
TABLE 6. GLOBAL HEPARIN SALES MARKET VALUE FOR VENOUS THROMBOEMBOLISM, BY GEOGRAPHY, 2020-2026 (USD BILLION)
TABLE 7. GLOBAL HEPARIN SALES MARKET VALUE FOR ATRIAL FIBRILLATION, BY GEOGRAPHY, 2020-2026 (USD BILLION)
TABLE 8. GLOBAL HEPARIN SALES MARKET VALUE FOR RENAL IMPAIRMENT, BY GEOGRAPHY, 2020-2026 (USD BILLION)
TABLE 9. GLOBAL HEPARIN SALES MARKET VALUE FOR CORONARY ARTERY DISEASE, BY GEOGRAPHY, 2020-2026 (USD BILLION)
TABLE 10. GLOBAL HEPARIN SALES MARKET VALUE FOR OTHERS, BY GEOGRAPHY, 2020-2026 (USD BILLION)
TABLE 11. GLOBAL HEPARIN SALES MARKET VALUE, BY END-USE, 2020-2026 (USD BILLION)
TABLE 12. GLOBAL HEPARIN SALES MARKET VALUE FOR OUTPATIENT, BY GEOGRAPHY, 2020-2026 (USD BILLION)
TABLE 13. GLOBAL HEPARIN SALES MARKET VALUE FOR INPATIENT, BY GEOGRAPHY, 2020-2026 (USD BILLION)
TABLE 14. NORTH AMERICA HEPARIN SALES MARKET VALUE, BY COUNTRY, 2020-2026 (USD BILLION)
TABLE 15. NORTH AMERICA HEPARIN SALES MARKET VALUE, BY TYPE, 2020-2026 (USD BILLION)
TABLE 16. NORTH AMERICA HEPARIN SALES MARKET VALUE, BY APPLICATION, 2020-2026 (USD BILLION)
TABLE 17. NORTH AMERICA HEPARIN SALES MARKET VALUE, BY END-USE, 2020-2026 (USD BILLION)
TABLE 18. U.S HEPARIN SALES MARKET VALUE, BY TYPE, 2020-2026 (USD BILLION)
TABLE 19. U.S HEPARIN SALES MARKET VALUE, BY APPLICATION, 2020-2026 (USD BILLION)
TABLE 20. U.S HEPARIN SALES MARKET VALUE, BY END-USE, 2020-2026 (USD BILLION)
TABLE 21. CANADA HEPARIN SALES MARKET VALUE, BY TYPE, 2020-2026 (USD BILLION)
TABLE 22. CANADA HEPARIN SALES MARKET VALUE, BY APPLICATION, 2020-2026 (USD BILLION)
TABLE 23. CANADA HEPARIN SALES MARKET VALUE, BY END-USE, 2020-2026 (USD BILLION)
TABLE 24. EUROPE HEPARIN SALES MARKET VALUE, BY COUNTRY, 2020-2026 (USD BILLION)
TABLE 25. EUROPE HEPARIN SALES MARKET VALUE, BY TYPE, 2020-2026 (USD BILLION)
TABLE 26. EUROPE HEPARIN SALES MARKET VALUE, BY APPLICATION, 2020-2026 (USD BILLION)
TABLE 27. EUROPE HEPARIN SALES MARKET VALUE, END-USE, 2020-2026 (USD BILLION)
TABLE 28. GERMANY HEPARIN SALES MARKET VALUE, BY TYPE, 2020-2026 (USD BILLION)
TABLE 29. GERMANY HEPARIN SALES MARKET VALUE, BY APPLICATION, 2020-2026 (USD BILLION)
TABLE 30. GERMANY HEPARIN SALES MARKET VALUE, BY END-USE, 2020-2026 (USD BILLION)
TABLE 31. U.K HEPARIN SALES MARKET VALUE, BY TYPE, 2020-2026 (USD BILLION)
TABLE 32. U.K HEPARIN SALES MARKET VALUE, BY APPLICATION, 2020-2026 (USD BILLION)
TABLE 33. U.K HEPARIN SALES MARKET VALUE, BY END-USE, 2020-2026 (USD BILLION)
TABLE 34. FRANCE HEPARIN SALES MARKET VALUE, BY TYPE, 2020-2026 (USD BILLION)
TABLE 35. FRANCE HEPARIN SALES MARKET VALUE, BY APPLICATION, 2020-2026 (USD BILLION)
TABLE 36. FRANCE HEPARIN SALES MARKET VALUE, BY END-USE, 2020-2026 (USD BILLION)
TABLE 37. ITALY HEPARIN SALES MARKET VALUE, BY TYPE, 2020-2026 (USD BILLION)
TABLE 38. ITALY HEPARIN SALES MARKET VALUE, BY APPLICATION, 2020-2026 (USD BILLION)
TABLE 39. ITALY HEPARIN SALES MARKET VALUE, BY END-USE, 2020-2026 (USD BILLION)
TABLE 40. SPAIN HEPARIN SALES MARKET VALUE, BY TYPE, 2020-2026 (USD BILLION)
TABLE 41. SPAIN HEPARIN SALES MARKET VALUE, BY APPLICATION, 2020-2026 (USD BILLION)
TABLE 42. SPAIN HEPARIN SALES MARKET VALUE, BY END-USE, 2020-2026 (USD BILLION)
TABLE 43. ROE HEPARIN SALES MARKET VALUE, BY TYPE, 2020-2026 (USD BILLION)
TABLE 44. ROE HEPARIN SALES MARKET VALUE, BY APPLICATION, 2020-2026 (USD BILLION)
TABLE 45. ROE HEPARIN SALES MARKET VALUE, BY END-USE, 2020-2026 (USD BILLION)
TABLE 46. ASIA PACIFIC HEPARIN SALES MARKET VALUE, BY COUNTRY, 2020-2026 (USD BILLION)
TABLE 47. ASIA PACIFIC HEPARIN SALES MARKET VALUE, BY TYPE, 2020-2026 (USD BILLION)
TABLE 48. ASIA PACIFIC HEPARIN SALES MARKET VALUE, BY APPLICATION, 2020-2026 (USD BILLION)
TABLE 49. ASIA PACIFIC HEPARIN SALES MARKET VALUE, BY END-USE, 2020-2026 (USD BILLION)
TABLE 50. CHINA HEPARIN SALES MARKET VALUE, BY TYPE, 2020-2026 (USD BILLION)
TABLE 51. CHINA HEPARIN SALES MARKET VALUE, BY APPLICATION, 2020-2026 (USD BILLION)
TABLE 52. CHINA HEPARIN SALES MARKET VALUE, BY END-USE, 2020-2026 (USD BILLION)
TABLE 53. INDIA HEPARIN SALES MARKET VALUE, BY TYPE, 2020-2026 (USD BILLION)
TABLE 54. INDIA HEPARIN SALES MARKET VALUE, BY APPLICATION, 2020-2026 (USD BILLION)
TABLE 55. INDIA HEPARIN SALES MARKET VALUE, BY END-USE, 2020-2026 (USD BILLION)
TABLE 56. JAPAN HEPARIN SALES MARKET VALUE, BY TYPE, 2020-2026 (USD BILLION)
TABLE 57. JAPAN HEPARIN SALES MARKET VALUE, BY APPLICATION, 2020-2026 (USD BILLION)
TABLE 58. JAPAN HEPARIN SALES MARKET VALUE, BY END-USE, 2020-2026 (USD BILLION)
TABLE 59. REST OF APAC HEPARIN SALES MARKET VALUE, BY TYPE, 2020-2026 (USD BILLION)
TABLE 60. REST OF APAC HEPARIN SALES MARKET VALUE, BY APPLICATION, 2020-2026 (USD BILLION)
TABLE 61. REST OF APAC HEPARIN SALES MARKET VALUE, BY END-USE, 2020-2026 (USD BILLION)
TABLE 62. REST OF WORLD HEPARIN SALES MARKET VALUE, BY TYPE, 2020-2026 (USD BILLION)
TABLE 63. REST OF WORLD HEPARIN SALES MARKET VALUE, BY APPLICATION, 2020-2026 (USD BILLION)
TABLE 64. REST OF WORLD HEPARIN SALES MARKET VALUE, BY END-USE, 2020-2026 (USD BILLION)
TABLE 65. NANJING KING-FRIEND BIOCHEMICAL PHARMACEUTICAL CO. LTD: FINANCIALS
TABLE 66. NANJING KING-FRIEND BIOCHEMICAL PHARMACEUTICAL CO. LTD: PRODUCTS & SERVICES
TABLE 67. NANJING KING-FRIEND BIOCHEMICAL PHARMACEUTICAL CO. LTD: RECENT DEVELOPMENT
TABLE 68. ASPEN PHARMACARE HOLDINGS LTD: FINANCIALS
TABLE 69. ASPEN PHARMACARE HOLDINGS LTD: PRODUCTS & SERVICES
TABLE 70. ASPEN PHARMACARE HOLDINGS LTD: RECENT DEVELOPMENTS
TABLE 71. BAXTER INTERNATIONAL INC: FINANCIALS
TABLE 72. BAXTER INTERNATIONAL INC: PRODUCTS & SERVICES
TABLE 73. BAXTER INTERNATIONAL INC: RECENT DEVELOPMENTS
TABLE 74. LABORATORIOS FARMACEUTICOS ROVI SA: FINANCIALS
TABLE 75. LABORATORIOS FARMACEUTICOS ROVI SA: PRODUCTS & SERVICES
TABLE 76. LABORATORIOS FARMACEUTICOS ROVI SA: RECENT DEVELOPMENTS
TABLE 77. EISAI CO. LTD: FINANCIALS
TABLE 78. EISAI CO. LTD: PRODUCTS & SERVICES
TABLE 79. EISAI CO. LTD: RECENT DEVELOPMENTS
TABLE 80. FRESENIUS SE & CO. KGAA: FINANCIALS
TABLE 81. FRESENIUS SE & CO. KGAA: PRODUCTS & SERVICES
TABLE 82. FRESENIUS SE & CO. KGAA: RECENT DEVELOPMENTS
TABLE 83. HIKMA PHARMACEUTICALS PLC: FINANCIALS
TABLE 84. HIKMA PHARMACEUTICALS PLC: PRODUCTS & SERVICES
TABLE 85. HIKMA PHARMACEUTICALS PLC: RECENT DEVELOPMENTS
TABLE 86. MYLAN NV: FINANCIALS
TABLE 87. MYLAN NV: PRODUCTS & SERVICES
TABLE 88. MYLAN NV: RECENT DEVELOPMENTS
TABLE 89. PFIZER INC: FINANCIALS
TABLE 90. PFIZER INC: PRODUCTS & SERVICES
TABLE 91. PFIZER INC: RECENT DEVELOPMENTS
TABLE 92. SANOFI S.A: FINANCIALS
TABLE 93. SANOFI S.A: PRODUCTS & SERVICES
TABLE 94. SANOFI S.A: RECENT DEVELOPMENTS
Research Framework
Infoholic Research works on a holistic 360° approach in order to deliver high quality, validated and reliable information in our market reports. The Market estimation and forecasting involves following steps:
- Data Collation (Primary & Secondary)
- In-house Estimation (Based on proprietary data bases and Models)
- Market Triangulation
- Forecasting

Market related information is congregated from both primary and secondary sources.
Primary sources
Involved participants from all global stakeholders such as Solution providers, service providers, Industry associations, thought leaders etc. across levels such as CXOs, VPs and managers. Plus, our in-house industry experts having decades of industry experience contribute their consulting and advisory services.
Secondary sources
Include public sources such as regulatory frameworks, government IT spending, government demographic indicators, industry association statistics, and company publications along with paid sources such as Factiva, OneSource, Bloomberg among others.
![]()


