
Healthcare Chatbots Market by Application (Symptom Check, Medical Assistance, Appointment Booking), End-User (Patient, Healthcare Providers, Insurance Companies), Component (Software, Service), Deployment Model (Cloud, On-Premise), and Geography – Global Forecast to 2026
- April, 2021
- Domain: ICT - smart technologies
- Get Free 10% Customization in this Report
Healthcare chatbots are programmed that assists patients with any concerns they may have. This software, which uses cutting-edge technology, assists in responding to patients' minor concerns. The nursing staff has saved a lot of time due to this invention, and they can now concentrate more intently on their work. Due to the automation of various workflows with advanced technologies, a market for these virtual assistants has arisen in the healthcare sector. The global healthcare chatbots market is being driven by rising internet access and smart device adoption, limited availability of healthcare services to address a growing patient population, technical advances in artificial intelligence, chatbots minimizing healthcare costs, and increasing demand for virtual health assistance. However, concerns about data protection, a lack of expertise in chatbot creation, and a lack of knowledge and misconceptions impede the market's growth. The Healthcare Chatbots Market is predicted to grow at the rate of 22.36% CAGR by 2026.
Research Methodology:
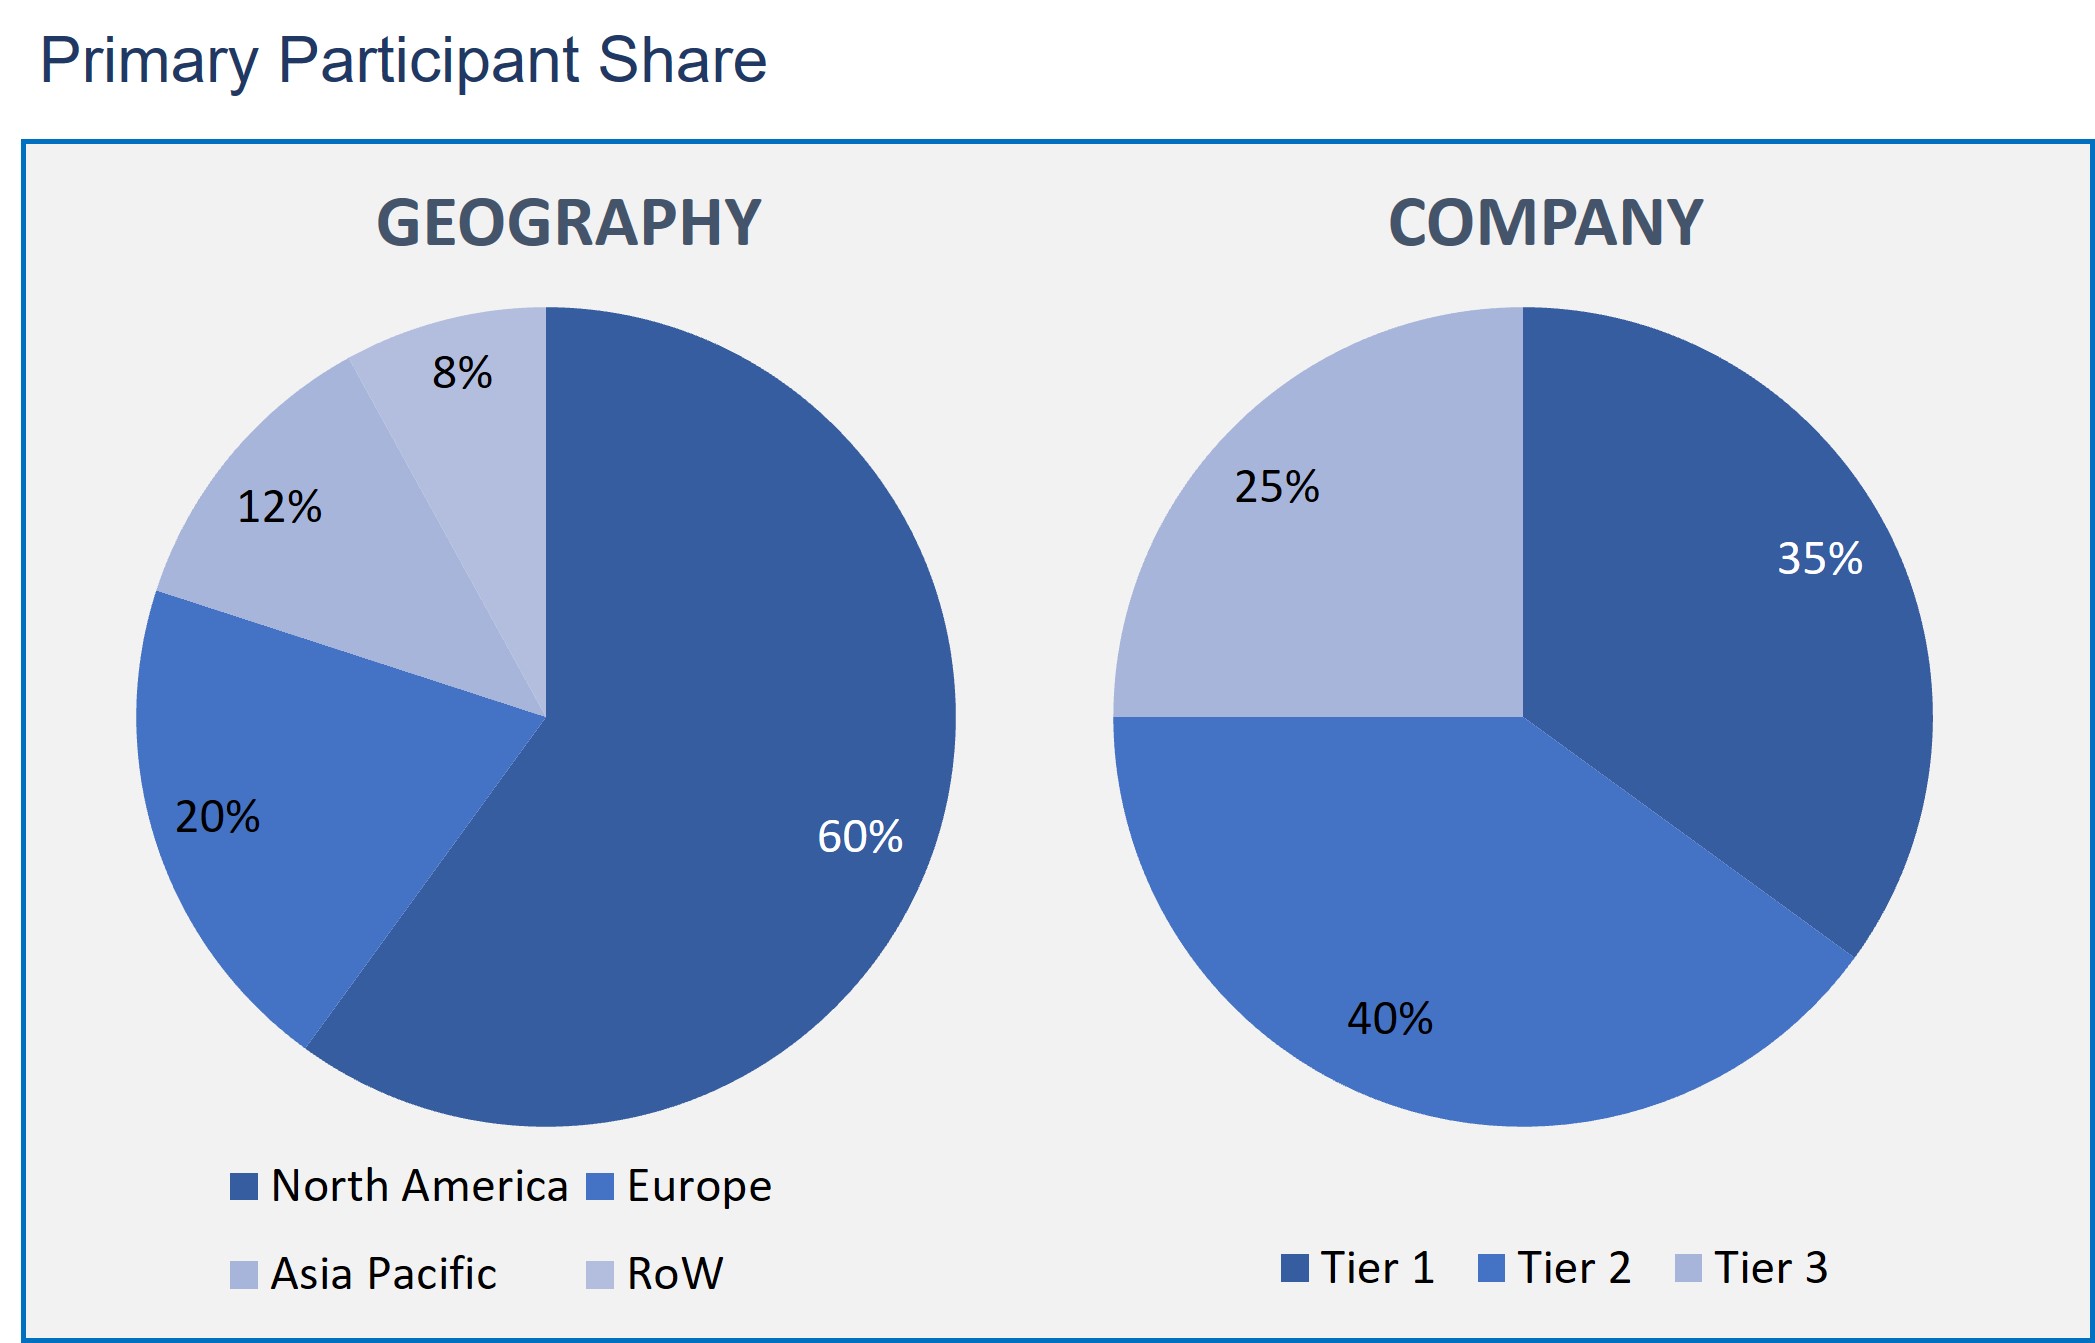
The Healthcare Chatbots market is analyzed by utilizing the optimum combination of secondary sources and in-house methodology and a unique balance of primary insights. The real-time valuation of the market is an integral part of our forecasting and market sizing methodology. Industry experts and our primary participants have helped to compile related aspects with accurate parametric estimations for a complete study. The primary participants share is given below:
Healthcare Chatbots Market is based on Application:
- Appointment Scheduling & Medical Guidance
- Symptom Checking & Medication Assistance
Healthcare Chatbots Market is based on End User:
- Insurance Companies
- Patients
- Healthcare Providers
- Other End Users
Healthcare Chatbots Market is based on Deployment Model:
- Cloud-based Model
- On-premise Model
Healthcare Chatbots Market is based on Component
- Services
- Software
Healthcare Chatbots Market is based on Geography
- North America
- Europe
- Asia Pacific
- Rest of the World
In the market based on components, the healthcare chatbots market is divided into software and services. The software segment is estimated to hold a larger share in 2018 compared to the services segment. Improved technological features in chatbot software, like cloud-based deployment, Application Programming Interface (API), Natural Language Processing, multilingual capabilities, interference engine, mobile platform compatibility, and single point of search are boosting the development of the software segment.
Based on deployment mode, the overall healthcare chatbots market is generally segmented into two main segments: on-premise and cloud-based. An on-premise solution is the most preferred way to deploy chatbots among healthcare providers and players. On-premise type of deployment includes purpose-built software installed in mobile, laptops, tablets, and PCs.
The global healthcare chatbots' application segment is bifurcated into symptom checking, medication assistance & guidance, coverage & claims management, and appointment management.
The healthcare chatbots market covers trends and opportunities across the Americas, Asia Pacific, Europe, and the Middle East & Africa in terms of geography. Europe accounted for the highest share of the market in 2017 due to technological awareness and virtual assistants' adoption. But the Americas region is expected to display a robust development rate due to investments in artificial intelligence and technological development.
The Healthcare Chatbots Market is providing with the few notable companies of the market, such as Your.MD, HealthTap, Inc, Sensely, Inc, Buoy Health, Inc, Infermedica, Babylon Healthcare Service Limited, Baidu, Inc, Ada Digital Health Ltd, PACT Care BV, Woebot Labs, Inc, and GYANT.Com, Inc.
- The report provides the overall analysis of the market present trends, challenges, and other factors influencing the market growth.
- Research gives the information of every segmentation of the market and the challenges and opportunities of the market.
- The report describes the major market players' profiles and innovations in rendering the services to the end-users.
- Executive Summary
- Industry Outlook
- Industry Overview
- Industry Trends
- Market Snapshot
- Market Definition
- Market Outlook
- Porter Five Forces
- Related Markets
- Market characteristics
- Market Overview
- Market Segmentation
- Market Dynamics
- Drivers
- Restraints
- Opportunities
- DRO - Impact Analysis
- Application: Market Size & Analysis
- Overview
- Appointment Scheduling & Medical Guidance
- Symptom Checking & Medication Assistance
- End-User: Market Size & Analysis
- Overview
- Insurance Companies
- Patients
- Healthcare Providers
- Other End Users
- Deployment Mode: Market Size & Analysis
- Overview
- Cloud-based Model
- On-premise Model
- Component: Market Size & Analysis
- Overview
- Services
- Software
- Geography: Market Size & Analysis
- Overview
- North America
- Europe
- Asia Pacific
- Rest of the World
- Competitive Landscape
- Competitor Comparison Analysis
- Market Developments
- Mergers and Acquisitions, Legal, Awards, Partnerships
- Product Launches and execution
- Vendor Profiles
- Sensely, Inc.
- Overview
- Financial Overview
- Product offerings
- Developments
- Business Strategy
- Your.MD Limited
- Overview
- Financial Overview
- Product offerings
- Developments
- Business Strategy
- Buoy Health, Inc.
- Overview
- Financial Overview
- Product offerings
- Developments
- Business Strategy
- Infermedica
- Overview
- Financial Overview
- Product offerings
- Developments
- Business Strategy
- PACT Care BV
- Overview
- Financial Overview
- Product offerings
- Developments
- Business Strategy
- HealthTap, Inc.
- Overview
- Financial Overview
- Product offerings
- Developments
- Business Strategy
- Babylon Health
- Overview
- Financial Overview
- Product offerings
- Developments
- Business Strategy
- Ada Health GmbH
- Overview
- Financial Overview
- Product offerings
- Developments
- Business Strategy
- Woebot Labs, Inc.
- Overview
- Financial Overview
- Product offerings
- Developments
- Business Strategy
- COM, Inc.
- Overview
- Financial Overview
- Product offerings
- Developments
- Business Strategy
- Sensely, Inc.
- Companies to Watch
- GYANT.Com, Inc.
- Overview
- Products & Services
- Business Strategy
- GYANT.Com, Inc.
- Analyst Opinion
- Annexure
- Report Scope
- Market Definitions
- Research Methodology
- Data Collation and In-house Estimation
- Market Triangulation
- Forecasting
- Report Assumptions
- Declarations
- Stakeholders
- Abbreviations
TABLE 1. GLOBAL HEALTHCARE CHATBOTS MARKET VALUE, BY APPLICATION, 2020-2026 (USD BILLION)
TABLE 2. GLOBAL HEALTHCARE CHATBOTS MARKET VALUE FOR APPOINTMENT SCHEDULING & MEDICAL GUIDANCE, BY GEOGRAPHY, 2020-2026 (USD BILLION)
TABLE 3. GLOBAL HEALTHCARE CHATBOTS MARKET VALUE FOR SYMPTOM CHECKING & MEDICATION ASSISTANCE, BY GEOGRAPHY, 2020-2026 (USD BILLION)
TABLE 4. GLOBAL HEALTHCARE CHATBOTS MARKET VALUE, BY END USER, 2020-2026 (USD BILLION)
TABLE 5. GLOBAL HEALTHCARE CHATBOTS MARKET VALUE FOR INSURANCE COMPANIES, BY GEOGRAPHY, 2020-2026 (USD BILLION)
TABLE 6. GLOBAL HEALTHCARE CHATBOTS MARKET VALUE FOR PATIENTS, BY GEOGRAPHY, 2020-2026 (USD BILLION)
TABLE 7. GLOBAL HEALTHCARE CHATBOTS MARKET VALUE FOR HEALTHCARE PROVIDERS, BY GEOGRAPHY, 2020-2026 (USD BILLION)
TABLE 8. GLOBAL HEALTHCARE CHATBOTS MARKET VALUE FOR OTHER END USERS, BY GEOGRAPHY, 2020-2026 (USD BILLION)
TABLE 9. GLOBAL HEALTHCARE CHATBOTS MARKET VALUE, BY DEPLOYMENT MODEL, BY GEOGRAPHY, 2020-2026 (USD BILLION)
TABLE 10. GLOBAL HEALTHCARE CHATBOTS MARKET VALUE FOR CLOUD-BASED MODEL, BY GEOGRAPHY, 2020-2026 (USD BILLION)
TABLE 11. GLOBAL HEALTHCARE CHATBOTS MARKET VALUE FOR ON-PREMISE MODEL, BY GEOGRAPHY, 2020-2026 (USD BILLION)
TABLE 12. GLOBAL HEALTHCARE CHATBOTS MARKET VALUE, BY COMPONENT, 2020-2026 (USD BILLION)
TABLE 13. GLOBAL HEALTHCARE CHATBOTS MARKET VALUE FOR SERVICES, BY GEOGRAPHY 2020-2026 (USD BILLION)
TABLE 14. GLOBAL HEALTHCARE CHATBOTS MARKET VALUE FOR SOFTWARE, BY GEOGRAPHY, 2020-2026 (USD BILLION)
TABLE 15. NORTH AMERICA HEALTHCARE CHATBOTS MARKET VALUE, BY COUNTRY, 2020-2026 (USD BILLION)
TABLE 16. NORTH AMERICA HEALTHCARE CHATBOTS MARKET VALUE, BY END USER, 2020-2026 (USD BILLION)
TABLE 17. NORTH AMERICA HEALTHCARE CHATBOTS MARKET VALUE, BY APPLICATION, 2020-2026 (USD BILLION)
TABLE 18. NORTH AMERICA HEALTHCARE CHATBOTS MARKET VALUE, BY DEPLOYMENT MODEL, 2020-2026 (USD BILLION)
TABLE 19. NORTH AMERICA HEALTHCARE CHATBOTS MARKET VALUE, BY COMPONENT, 2020-2026 (USD BILLION)
TABLE 20. U.S HEALTHCARE CHATBOTS MARKET VALUE, BY END USER, 2020-2026 (USD BILLION)
TABLE 21. U.S HEALTHCARE CHATBOTS MARKET VALUE, BY APPLICATION, 2020-2026 (USD BILLION)
TABLE 22. U.S HEALTHCARE CHATBOTS MARKET VALUE, BY DEPLOYMENT MODEL, 2020-2026 (USD BILLION)
TABLE 23. U.S. HEALTHCARE CHATBOTS MARKET VALUE, BY COMPONENT, 2020-2026 (USD BILLION)
TABLE 24. CANADA HEALTHCARE CHATBOTS MARKET VALUE, BY END USER, 2020-2026 (USD BILLION)
TABLE 25. CANADA HEALTHCARE CHATBOTS MARKET VALUE, BY APPLICATION, 2020-2026 (USD BILLION)
TABLE 26. CANADA HEALTHCARE CHATBOTS MARKET VALUE, BY DEPLOYMENT MODEL, 2020-2026 (USD BILLION)
TABLE 27. CANADA HEALTHCARE CHATBOTS MARKET VALUE, BY COMPONENT, 2020-2026 (USD BILLION)
TABLE 28. EUROPE HEALTHCARE CHATBOTS MARKET VALUE, BY COUNTRY, 2020-2026 (USD BILLION)
TABLE 29. EUROPE HEALTHCARE CHATBOTS MARKET VALUE, BY END USER, 2020-2026 (USD BILLION)
TABLE 30. EUROPE HEALTHCARE CHATBOTS MARKET VALUE, BY APPLICATION, 2020-2026 (USD BILLION)
TABLE 31. EUROPE HEALTHCARE CHATBOTS MARKET VALUE, DEPLOYMENT MODEL, 2020-2026 (USD BILLION)
TABLE 32. EUROPE HEALTHCARE CHATBOTS MARKET VALUE, BY COMPONENT, 2020-2026 (USD BILLION)
TABLE 33. GERMANY HEALTHCARE CHATBOTS MARKET VALUE, BY END USER, 2020-2026 (USD BILLION)
TABLE 34. GERMANY HEALTHCARE CHATBOTS MARKET VALUE, BY APPLICATION, 2020-2026 (USD BILLION)
TABLE 35. GERMANY HEALTHCARE CHATBOTS MARKET VALUE, BY DEPLOYMENT MODEL, 2020-2026 (USD BILLION)
TABLE 36. GERMANY HEALTHCARE CHATBOTS MARKET VALUE, BY COMPONENT, 2020-2026 (USD BILLION)
TABLE 37. U.K HEALTHCARE CHATBOTS MARKET VALUE, BY END USER, 2020-2026 (USD BILLION)
TABLE 38. U.K HEALTHCARE CHATBOTS MARKET VALUE, BY APPLICATION, 2020-2026 (USD BILLION)
TABLE 39. U.K HEALTHCARE CHATBOTS MARKET VALUE, BY DEPLOYMENT MODEL, 2020-2026 (USD BILLION)
TABLE 40. U.K HEALTHCARE CHATBOTS MARKET VALUE, BY COMPONENT, 2020-2026 (USD BILLION)
TABLE 41. FRANCE HEALTHCARE CHATBOTS MARKET VALUE, BY END USER, 2020-2026 (USD BILLION)
TABLE 42. FRANCE HEALTHCARE CHATBOTS MARKET VALUE, BY APPLICATION, 2020-2026 (USD BILLION)
TABLE 43. FRANCE HEALTHCARE CHATBOTS MARKET VALUE, BY DEPLOYMENT MODEL, 2020-2026 (USD BILLION)
TABLE 44. FRANCE HEALTHCARE CHATBOTS MARKET VALUE, BY COMPONENT, 2020-2026 (USD BILLION)
TABLE 45. ITALY HEALTHCARE CHATBOTS MARKET VALUE, BY END USER, 2020-2026 (USD BILLION)
TABLE 46. ITALY HEALTHCARE CHATBOTS MARKET VALUE, BY APPLICATION, 2020-2026 (USD BILLION)
TABLE 47. ITALY HEALTHCARE CHATBOTS MARKET VALUE, BY DEPLOYMENT MODEL, 2020-2026 (USD BILLION)
TABLE 48. ITALY HEALTHCARE CHATBOTS MARKET VALUE, BY COMPONENT, 2020-2026 (USD BILLION)
TABLE 49. SPAIN HEALTHCARE CHATBOTS MARKET VALUE, BY END USER, 2020-2026 (USD BILLION)
TABLE 50. SPAIN HEALTHCARE CHATBOTS MARKET VALUE, BY APPLICATION, 2020-2026 (USD BILLION)
TABLE 51. SPAIN HEALTHCARE CHATBOTS MARKET VALUE, BY DEPLOYMENT MODEL, 2020-2026 (USD BILLION)
TABLE 52. SPAIN HEALTHCARE CHATBOTS MARKET VALUE, BY COMPONENT, 2020-2026 (USD BILLION)
TABLE 53. ROE HEALTHCARE CHATBOTS MARKET VALUE, BY END USER, 2020-2026 (USD BILLION)
TABLE 54. ROE HEALTHCARE CHATBOTS MARKET VALUE, BY APPLICATION, 2020-2026 (USD BILLION)
TABLE 55. ROE HEALTHCARE CHATBOTS MARKET VALUE, BY DEPLOYMENT MODEL, 2020-2026 (USD BILLION)
TABLE 56. ROE HEALTHCARE CHATBOTS MARKET VALUE, BY COMPONENT, 2020-2026 (USD BILLION)
TABLE 57. ASIA PACIFIC HEALTHCARE CHATBOTS MARKET VALUE, BY COUNTRY, 2020-2026 (USD BILLION)
TABLE 58. ASIA PACIFIC HEALTHCARE CHATBOTS MARKET VALUE, BY END USER, 2020-2026 (USD BILLION)
TABLE 59. ASIA PACIFIC HEALTHCARE CHATBOTS MARKET VALUE, BY APPLICATION, 2020-2026 (USD BILLION)
TABLE 60. ASIA PACIFIC HEALTHCARE CHATBOTS MARKET VALUE, BY DEPLOYMENT MODEL, 2020-2026 (USD BILLION)
TABLE 61. ASIA PACIFIC HEALTHCARE CHATBOTS MARKET VALUE, BY COMPONENT, 2020-2026 (USD BILLION)
TABLE 62. CHINA HEALTHCARE CHATBOTS MARKET VALUE, BY END USER, 2020-2026 (USD BILLION)
TABLE 63. CHINA HEALTHCARE CHATBOTS MARKET VALUE, BY APPLICATION, 2020-2026 (USD BILLION)
TABLE 64. CHINA HEALTHCARE CHATBOTS MARKET VALUE, BY DEPLOYMENT MODEL, 2020-2026 (USD BILLION)
TABLE 65. CHINA HEALTHCARE CHATBOTS MARKET VALUE, BY COMPONENT, 2020-2026 (USD BILLION)
TABLE 66. INDIA HEALTHCARE CHATBOTS MARKET VALUE, BY END USER, 2020-2026 (USD BILLION)
TABLE 67. INDIA HEALTHCARE CHATBOTS MARKET VALUE, BY APPLICATION, 2020-2026 (USD BILLION)
TABLE 68. INDIA HEALTHCARE CHATBOTS MARKET VALUE, BY DEPLOYMENT MODEL, 2020-2026 (USD BILLION)
TABLE 69. INDIA HEALTHCARE CHATBOTS MARKET VALUE, BY COMPONENT, 2020-2026 (USD BILLION)
TABLE 70. JAPAN HEALTHCARE CHATBOTS MARKET VALUE, BY END USER, 2020-2026 (USD BILLION)
TABLE 71. JAPAN HEALTHCARE CHATBOTS MARKET VALUE, BY APPLICATION, 2020-2026 (USD BILLION)
TABLE 72. JAPAN HEALTHCARE CHATBOTS MARKET VALUE, BY DEPLOYMENT MODEL, 2020-2026 (USD BILLION)
TABLE 73. JAPAN HEALTHCARE CHATBOTS MARKET VALUE, BY COMPONENT, 2020-2026 (USD BILLION)
TABLE 74. REST OF APAC HEALTHCARE CHATBOTS MARKET VALUE, BY END USER, 2020-2026 (USD BILLION)
TABLE 75. REST OF APAC HEALTHCARE CHATBOTS MARKET VALUE, BY APPLICATION, 2020-2026 (USD BILLION)
TABLE 76. REST OF APAC HEALTHCARE CHATBOTS MARKET VALUE, BY DEPLOYMENT MODEL, 2020-2026 (USD BILLION)
TABLE 77. REST OF APAC HEALTHCARE CHATBOTS MARKET VALUE, BY COMPONENT, 2020-2026 (USD BILLION)
TABLE 78. REST OF WORLD HEALTHCARE CHATBOTS MARKET VALUE, BY END USER, 2020-2026 (USD BILLION)
TABLE 79. REST OF WORLD HEALTHCARE CHATBOTS MARKET VALUE, BY APPLICATION, 2020-2026 (USD BILLION)
TABLE 80. REST OF WORLD HEALTHCARE CHATBOTS MARKET VALUE, BY DEPLOYMENT MODEL, 2020-2026 (USD BILLION)
TABLE 81. REST OF WORLD HEALTHCARE CHATBOTS MARKET VALUE, BY COMPONENT, 2020-2026 (USD BILLION)
TABLE 82. SENSELY, INC.: FINANCIALS
TABLE 83. SENSELY, INC.: PRODUCTS & SERVICES
TABLE 84. SENSELY, INC.: RECENT DEVELOPMENTS
TABLE 85. YOUR.MD LIMITED: FINANCIALS
TABLE 86. YOUR.MD LIMITED: PRODUCTS & SERVICES
TABLE 87. YOUR.MD LIMITED: RECENT DEVELOPMENTS
TABLE 88. BUOY HEALTH, INC.: FINANCIALS
TABLE 89. BUOY HEALTH, INC.: PRODUCTS & SERVICES
TABLE 90. BUOY HEALTH, INC.: RECENT DEVELOPMENTS
TABLE 91. INFERMEDICA: FINANCIALS
TABLE 92. INFERMEDICA: PRODUCTS & SERVICES
TABLE 93. INFERMEDICA: RECENT DEVELOPMENTS
TABLE 94. PACT CARE BV: FINANCIALS
TABLE 95. PACT CARE BV: PRODUCTS & SERVICES
TABLE 96. PACT CARE BV: RECENT DEVELOPMENTS
TABLE 97. HEALTHTAP, INC.: FINANCIALS
TABLE 98. HEALTHTAP, INC.: PRODUCTS & SERVICES
TABLE 99. HEALTHTAP, INC.: RECENT DEVELOPMENTS
TABLE 100. BABYLON HEALTH: FINANCIALS
TABLE 101. BABYLON HEALTH: PRODUCTS & SERVICES
TABLE 102. BABYLON HEALTH: RECENT DEVELOPMENTS
TABLE 103. ADA HEALTH GMBH: FINANCIALS
TABLE 104. ADA HEALTH GMBH: PRODUCTS & SERVICES
TABLE 105. ADA HEALTH GMBH: RECENT DEVELOPMENTS
TABLE 106. WOEBOT LABS, INC.: FINANCIALS
TABLE 107. WOEBOT LABS, INC.: PRODUCTS & SERVICES
TABLE 108. WOEBOT LABS, INC.: RECENT DEVELOPMENTS
TABLE 109. COM, INC.: FINANCIALS
TABLE 110. COM, INC.: PRODUCTS & SERVICES
TABLE 111. COM, INC.: RECENT DEVELOPMENTS
TABLE 112. GYANT.COM, INC.: PRODUCTS & SERVICES
Research Framework
Infoholic Research works on a holistic 360° approach in order to deliver high quality, validated and reliable information in our market reports. The Market estimation and forecasting involves following steps:
- Data Collation (Primary & Secondary)
- In-house Estimation (Based on proprietary data bases and Models)
- Market Triangulation
- Forecasting

Market related information is congregated from both primary and secondary sources.
Primary sources
Involved participants from all global stakeholders such as Solution providers, service providers, Industry associations, thought leaders etc. across levels such as CXOs, VPs and managers. Plus, our in-house industry experts having decades of industry experience contribute their consulting and advisory services.
Secondary sources
Include public sources such as regulatory frameworks, government IT spending, government demographic indicators, industry association statistics, and company publications along with paid sources such as Factiva, OneSource, Bloomberg among others.
![]()


