
Graphite Lubricant Market, By Application (Solution, Pure Powder, and composites), By End-user (Transportation, Industrial Application, and Electrical & Electronics) and By Geography – Drivers, Restraints, Opportunities, Trends and Forecast up to 2022
- August, 2017
- Domain: Chemicals, Materials & Food - Inorganic Chemicals
- Get Free 10% Customization in this Report
Graphite is one of the most common forms of carbon. Graphite with or without other chemicals or materials used for lubrication is commonly termed as graphite lubricants, which come under dry lubricant or solid lubricant. Although being in the solid phase, dry lubricants or solid lubricants are materials that reduce friction between two surfaces sliding against each other without the need for any liquid medium. Due to its superior property, such as high temperature resistance and low coefficient of friction, it is widely being used in various end-user industries like transportation, industrial application, and electric & electronics. Transportation is the largest end-user of graphite lubricant owing to its high lubrication property even at higher temperatures followed by industrial applications. The application of graphite lubricants is also increasing in electrical equipment due to the added advantage of conductivity. These lubricating solids can stay longer than unfortified oils, thus reducing the maintenance cost.
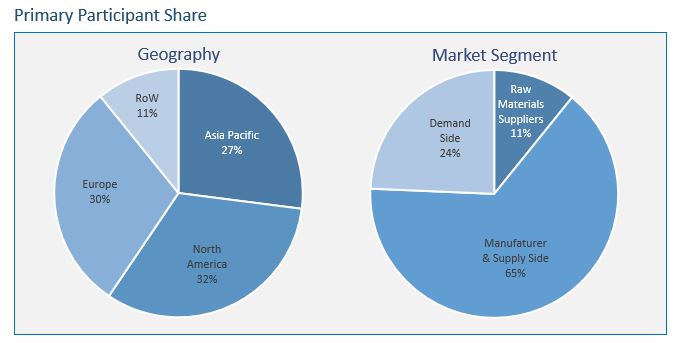
Research Methodology
The graphite lubricant market has been analyzed by utilizing the optimum combination of secondary sources and in-house methodology along with an irreplaceable blend of primary insights. The real-time assessment of the market is an integral part of our market sizing and forecasting methodology, wherein our industry experts and panel of primary participants helped in compiling the best quality with realistic parametric estimations. Further, the participation share of different categories of primary participants is given below:
Globally, the demand for graphite lubricant is growing consistently, especially in the Asia Pacific and North America markets. This growth is supported by the increasing industrialization and electronic applications industries in these regions respectively. Currently, Asia Pacific is the global leader in the graphite lubricant market. China and India have an advantage of having the most number of manufacturing and consumption markets, thus providing maximum contribution to the global graphite lubricant market. North America is the second major consumer of global graphite lubricant owing to large automotive and industrial applications in the region. Europe and Middle East & African countries show high growth rate during the forecast period due to the increasing acceptance and industrialization in respective regions.
According to Infoholic Research, the global graphite lubricant market is expected to grow at a CAGR of 4.2% during the forecast period to reach around $1.67 billion by 2022. The transportation segment is expected to be dominant in the application segment, which is driven by China and India. In geographic terms, Asia Pacific is expected to retain its top position in the global graphite lubricant market followed by North America. Some of the key players in the graphite lubricants market are Imerys, Dow Corning, Superior Graphite, Henkal, etc.
Report Scope:
- Applications
- Solution
- Pure powder
- Composites
- End-user
- Transportation
- Industrial Application
- Electrical & Electronics
- Others
- Regions
- Asia Pacific
- North America
- Europe
- Rest of the World
- Industry outlook: Market trends, drivers, restraints, and opportunities
1 Report Outline
1.1 Introduction
1.2 Report Scope
1.3 Market Definition
1.4 Research Methodology
1.4.1 Data Collation & In-House Estimation
1.4.2 Market Triangulation
1.4.3 Forecasting
1.5 Study Declarations
1.6 Report Assumptions
1.7 Stakeholders
2 Executive Summary
2.1 Asia Pacific Continues To Dominate The Graphite Lubricant Market
2.2 Graphite Lubricant in Transportation is Increasing Its Lead With High Growth Coming From Developing Countries
3 Market Positioning
3.1 Total Addressable Market (TAM): Dry Lubricant
3.1.1 Market Overview
3.2 Segmented Addressable Market (SAM)
3.3 Related Markets
4 Market Outlook
4.1 Overview
4.2 Value Chain Analysis
4.3 PESTLE Analysis
4.4 Porter 5 (Five) Forces
4.5 Patent Analysis
5 Market Characteristics
5.1 Market Segmentation
5.2 Market Dynamics
5.2.1 Drivers
5.2.1.1 Increasing industrialization in Asia Pacific
5.2.1.2 Growing demand of spray application in dry lubricants
5.2.2 Restraints
5.2.2.1 Stringent government regulations on raw materials
5.2.2.2 Availability of better alternatives
5.2.3 Opportunities
5.2.3.1 Large untapped market in developing & under developed countries
5.2.3.2 Technological advancement of graphite lubricant
5.2.4 DRO – Impact Analysis
6 Application Method: Market Size And Analysis
6.1 Overview
6.2 Solution
6.3 Pure Powder
6.4 Composites
6.5 Vendor Profiles
6.5.1 Henkel AG & Company.
6.5.2 Imerys S.A.
6.5.3 Dow Chemical Company
6.5.4 Permatex
6.5.5 Superior Graphite
(Overview, business units, geographic revenues, product profile, recent developments, business focus, SWOT analysis, and business strategy have been covered for all vendors)
7 End-user: Market Size And Analysis
7.1 Overview
7.2 Transportation
7.3 Industrial Application
7.4 Electrical and electronics
7.5 Customer Profile
7.5.1 Toshiba Corporation
7.5.2 TDK Corporation
7.5.3 General Electric (GE)
7.5.4 Fiat Chrysler Automobiles N.V.
7.5.5 Siemens AG
(Overview, business units, geographic revenues, product profile, recent developments, business focus, SWOT analysis, and business strategy have been covered for all customers)
8 Regions: Market Size And Analysis
8.1 Overview
8.2 Asia Pacific
8.2.1 Asia Pacific Market, By Countries
8.2.2 Asia Pacific Market, By Application
8.2.3 Asia Pacific Market, By End-user
8.3 North America
8.3.1 North America Market, By Countries
8.3.2 North America Market, By Application
8.3.3 North America Market, By End-user
8.4 Europe
8.4.1 Europe Market, By Country
8.4.2 Europe Market, By Application
8.4.3 Europe Market, By End-User
8.5 Rest of the World
8.5.1 Rest of the World Market, By Application
8.5.2 Rest of the World Market, By End-user
9 Companies to watch for
9.1 OKS Lubricants
9.2 Overview
9.3 Absury Carbons
10 Competitive Landscape
10.1 Competitor Comparison Analysis
10.2 Market Landscape
10.2.1 Mergers, Acquisitions & Joint Ventures
10.2.2 Expansion
10.2.3 Awards & Recognition
10.2.4 Divestment & Divestiture
11 Expert’s Views
Annexure
Abbreviations
TABLE 1 GLOBAL GRAPHITE LUBRICANT MARKET VALUE, BY APPLICATION, 2015−2022 ($MILLION) 31
TABLE 2 GLOBAL GRAPHITE LUBRICANT MARKET VOLUME, BY APPLICATION, 2015−2022 (KILOTONS) 32
TABLE 3 GLOBAL GRAPHITE SOLUTION LUBRICANT MARKET VALUE, BY GEOGRAPHY, 2015−2022 ($MILLION) 33
TABLE 4 GLOBAL GRAPHITE SOLUTION LUBRICANT MARKET VOLUME, BY GEOGRAPHY, 2015−2022 (KILOTONS) 33
TABLE 5 GLOBAL GRAPHITE PURE POWDER LUBRICANT MARKET VALUE, BY GEOGRAPHY, 2015−2022 ($MILLION) 34
TABLE 6 GLOBAL GRAPHITE PURE POWDER LUBRICANT MARKET VOLUME, BY GEOGRAPHY, 2015−2022 (KILOTONS) 35
TABLE 7 GLOBAL GRAPHITE COMPOSITES LUBRICANT MARKET VALUE, BY GEOGRAPHY, 2015−2022 ($MILLION) 36
TABLE 8 GLOBAL GRAPHITE COMPOSITES LUBRICANT MARKET VOLUME, BY GEOGRAPHY, 2015−2022 (KILOTONS) 36
TABLE 9 HENKEL AG & COMPANY: PRODUCT PROFILE 40
TABLE 10 HENKEL AG & COMPANY: RECENT DEVELOPMENTS 41
TABLE 11 IMERYS S.A.: PRODUCT PROFILE 46
TABLE 12 IMERYS S.A.: RECENT DEVELOPMENTS 46
TABLE 13 DOW CHEMICAL COMPANY: PRODUCT PROFILE 52
TABLE 14 DOW CHEMICAL COMPANY: RECENT DEVELOPMENTS 52
TABLE 15 PERMATEX : PRODUCT PROFILE 56
TABLE 16 PERMATEX: RECENT DEVELOPMENTS 56
TABLE 17 SUPERIOR GRAPHITE: PRODUCT PROFILE 60
TABLE 18 SUPERIOR GRAPHITE: RECENT DEVELOPMENTS 61
TABLE 19 GLOBAL GRAPHITE LUBRICANT MARKET VALUE, BY END-USER, 2015−2022 ($MILLION) 64
TABLE 20 GLOBAL GRAPHITE LUBRICANT MARKET VOLUME, BY END-USER, 2015−2022 (KILOTONS) 65
TABLE 21 GLOBAL GRAPHITE LUBRICANT MARKET VALUE IN TRANSPORTATION, BY GEOGRAPHY, 2015−2022 ($MILLION) 66
TABLE 22 GLOBAL GRAPHITE LUBRICANT MARKET VOLUME IN TRANSPORTATION, BY GEOGRAPHY, 2015−2022 (KILOTONS) 67
TABLE 23 GLOBAL GRAPHITE LUBRICANT MARKET VALUE IN INDUSTRIAL APPLICATION, BY GEOGRAPHY, 2015−2022 ($MILLION) 68
TABLE 24 GLOBAL GRAPHITE APPLICATION MARKET VOLUME IN INDUSTRIAL APPLICATION, BY GEOGRAPHY, 2015−2022 (KILOTONS) 68
TABLE 25 GLOBAL GRAPHITE LUBRICANT MARKET VALUE IN ELECTRICAL AND ELECTRONICS, BY GEOGRAPHY, 2015−2022 ($MILLION) 70
TABLE 26 GLOBAL GRAPHITE LUBRICANT MARKET VOLUME IN ELECTRICAL AND ELECTRONICS, BY GEOGRAPHY, 2015−2022 (KILOTONS) 71
TABLE 27 TOSHIBA CORPORATION.: PRODUCT PROFILE 74
TABLE 28 TOSHIBA CORPORATION.: RECENT DEVELOPMENTS 75
TABLE 29 TDK CORPORATION: PRODUCT PROFILE 80
TABLE 30 TDK CORPORATION: RECENT DEVELOPMENTS 80
TABLE 31 GENERAL ELECTRIC: BUSINESS ACTIVITIES 87
TABLE 32 GENERAL ELECTRIC (GE): RECENT DEVELOPMENTS 87
TABLE 33 FIAT CHRYSLER AUTOMOBILES N.V.: PRODUCT PROFILE 93
TABLE 34 FIAT CHRYSLER AUTOMOBILES N.V.: RECENT DEVELOPMENTS 93
TABLE 35 SIEMENS AG: BUSINESS UNITS (2012 AND 2013) 97
TABLE 36 SIEMENS AG: BUSINESS UNITS (2014–2016) 98
TABLE 37 SIEMENS AG: GEOGRAPHIC REVENUE 100
TABLE 38 SIEMENS AG: RECENT DEVELOPMENTS 100
TABLE 39 GLOBAL GRAPHITE LUBRICANT MARKET VALUE, BY GEOGRAPHY, 2015−2022 ($MILLION) 105
TABLE 40 GLOBAL GRAPHITE LUBRICANT MARKET VOLUME, BY GEOGRAPHY, 2015−2022 (KILOTONS) 105
TABLE 41 ASIA PACIFIC GRAPHITE LUBRICANT VALUE, BY COUNTRY, 2015−2022 ($MILLION) 106
TABLE 42 ASIA PACIFIC GRAPHITE LUBRICANT MARKET VOLUME, BY COUNTRY, 2015−2022 (KILOTONS) 106
TABLE 43 ASIA PACIFIC GRAPHITE LUBRICANT MARKET VALUE, BY APPLICATION, 2015−2022 ($MILLION) 107
TABLE 44 ASIA PACIFIC GRAPHITE LUBRICANT MARKET VOLUME, BY APPLICATION, 2015−2022 (KILOTONS) 108
TABLE 45 ASIA PACIFIC GRAPHITE LUBRICANT MARKET VALUE, BY APPLICATION, 2015−2022 ($MILLION) 109
TABLE 46 ASIA PACIFIC GRAPHITE LUBRICANT MARKET VOLUME, BY END-USER, 2015−2022 (KILOTONS) 109
TABLE 47 NORTH AMERICA GRAPHITE LUBRICANT MARKET VALUE, BY COUNTRY, 2015−2022 ($MILLION) 111
TABLE 48 NORTH AMERICA GRAPHITE LUBRICANT MARKET VOLUME, BY COUNTRY, 2015−2022 (KILOTONS) 111
TABLE 49 NORTH AMERICA GRAPHITE LUBRICANT MARKET VALUE, BY APPLICATION, 2015−2022 ($MILLION) 113
TABLE 50 NORTH AMERICA GRAPHITE LUBRICANT MARKET VOLUME, BY APPLICATION, 2015−2022 (KILOTONS) 113
TABLE 51 NORTH AMERICA GRAPHITE LUBRICANT MARKET VALUE, BY END-USER, 2015−2022 ($MILLION) 114
TABLE 52 NORTH AMERICA GRAPHITE LUBRICANT MARKET VOLUME, BY END-USER, 2015−2022 (KILOTONS) 114
TABLE 53 EUROPE GRAPHITE LUBRICANT MARKET VALUE, BY COUNTRY, 2015−2022 ($MILLION) 116
TABLE 54 EUROPE GRAPHITE LUBRICANT MARKET VOLUME, BY COUNTRY, 2015−2022 (KILOTONS) 116
TABLE 55 EUROPE GRAPHITE LUBRICANT MARKET VALUE, BY APPLICATION, 2015−2022 ($MILLION) 117
TABLE 56 EUROPE GRAPHITE LUBRICANT MARKET VOLUME, BY APPLICATION, 2015−2022 (KILOTONS) 117
TABLE 57 EUROPE GRAPHITE LUBRICANT MARKET VALUE, BY END-USER, 2015−2022 ($MILLION) 118
TABLE 58 EUROPE GRAPHITE LUBRICANT MARKET VOLUME, BY APPLICATION, 2015−2022 (KILOTONS) 119
TABLE 59 REST OF THE WORLD GRAPHITE LUBRICANT MARKET VALUE, BY GEOGRAPHY, 2015−2022 ($MILLION) 120
TABLE 60 REST OF THE WORLD GRAPHITE LUBRICANT MARKET VOLUME, BY GEOGRAPHY, 2015−2022 (KILOTONS) 121
TABLE 61 REST OF THE WORLD GRAPHITE LUBRICANT MARKET VALUE, BY APPLICATION, 2015−2022 ($MILLION) 121
TABLE 62 REST OF THE WORLD GRAPHITE LUBRICANT MARKET VOLUME, BY APPLICATION, 2015−2022 (KILOTONS) 122
TABLE 63 REST OF THE WORLD GRAPHITE LUBRICANT MARKET VALUE, BY END-USER, 2015−2022 ($MILLION) 123
TABLE 64 REST OF THE WORLD GRAPHITE LUBRICANT MARKET VOLUME, BY END-USER, 2015−2022 (KILOTONS) 123
TABLE 65 MERGER, ACQUISITIONS & JOINT VENTURE, 2013–2017
Research Framework
Infoholic Research works on a holistic 360° approach in order to deliver high quality, validated and reliable information in our market reports. The Market estimation and forecasting involves following steps:
- Data Collation (Primary & Secondary)
- In-house Estimation (Based on proprietary data bases and Models)
- Market Triangulation
- Forecasting

Market related information is congregated from both primary and secondary sources.
Primary sources
Involved participants from all global stakeholders such as Solution providers, service providers, Industry associations, thought leaders etc. across levels such as CXOs, VPs and managers. Plus, our in-house industry experts having decades of industry experience contribute their consulting and advisory services.
Secondary sources
Include public sources such as regulatory frameworks, government IT spending, government demographic indicators, industry association statistics, and company publications along with paid sources such as Factiva, OneSource, Bloomberg among others.
![]()
