
Gluten-free Products Market by Type (Bakery Products, Snacks & RTE Products, Condiments & dressings, Pizzas & Pastas and Other types), Distribution Channel (Conventional stores, specialty stores, and Drugstores and Pharmacies), Form (Solid and Liquid) and Geography (North America, Europe, Asia Pacific, and RoW) – Global Forecast to 2026
- March, 2021
- Domain: Chemicals, Materials & Food - Agro, Pharma, Food & Personal Care
- Get Free 10% Customization in this Report
Gluten is a type of protein that is generally found in some cereals. A gluten-free diet is important for people with allergies to gluten and with celiac disease, a condition that results in inflammation in the small intestines. Also, gluten leads to gas, abdominal bloating, diarrhea, vomiting, and other illnesses. Several manufacturers are developing new products that are gluten-free and prepared from rice, cassava, corn, chia, and soybeans. Celiac disease is one of the major factors impelling the demand for gluten-free food products. It has a niche market due to an autoimmune disease where the small intestine will not be able to process the gluten present in few foods such as wheat, barley, and rye. In the present situation, the only beneficial treatment is a lifelong gluten-free food. As a result, individuals have only the choice to use gluten-free food products. On the other hand, gluten-free products have inadequate dietary fibers, which may result in constipation and other problems related to the digestive system. The Gluten-free Products Market is expected to grow at the rate of 8.2% CAGR by 2026.
Research Methodology:
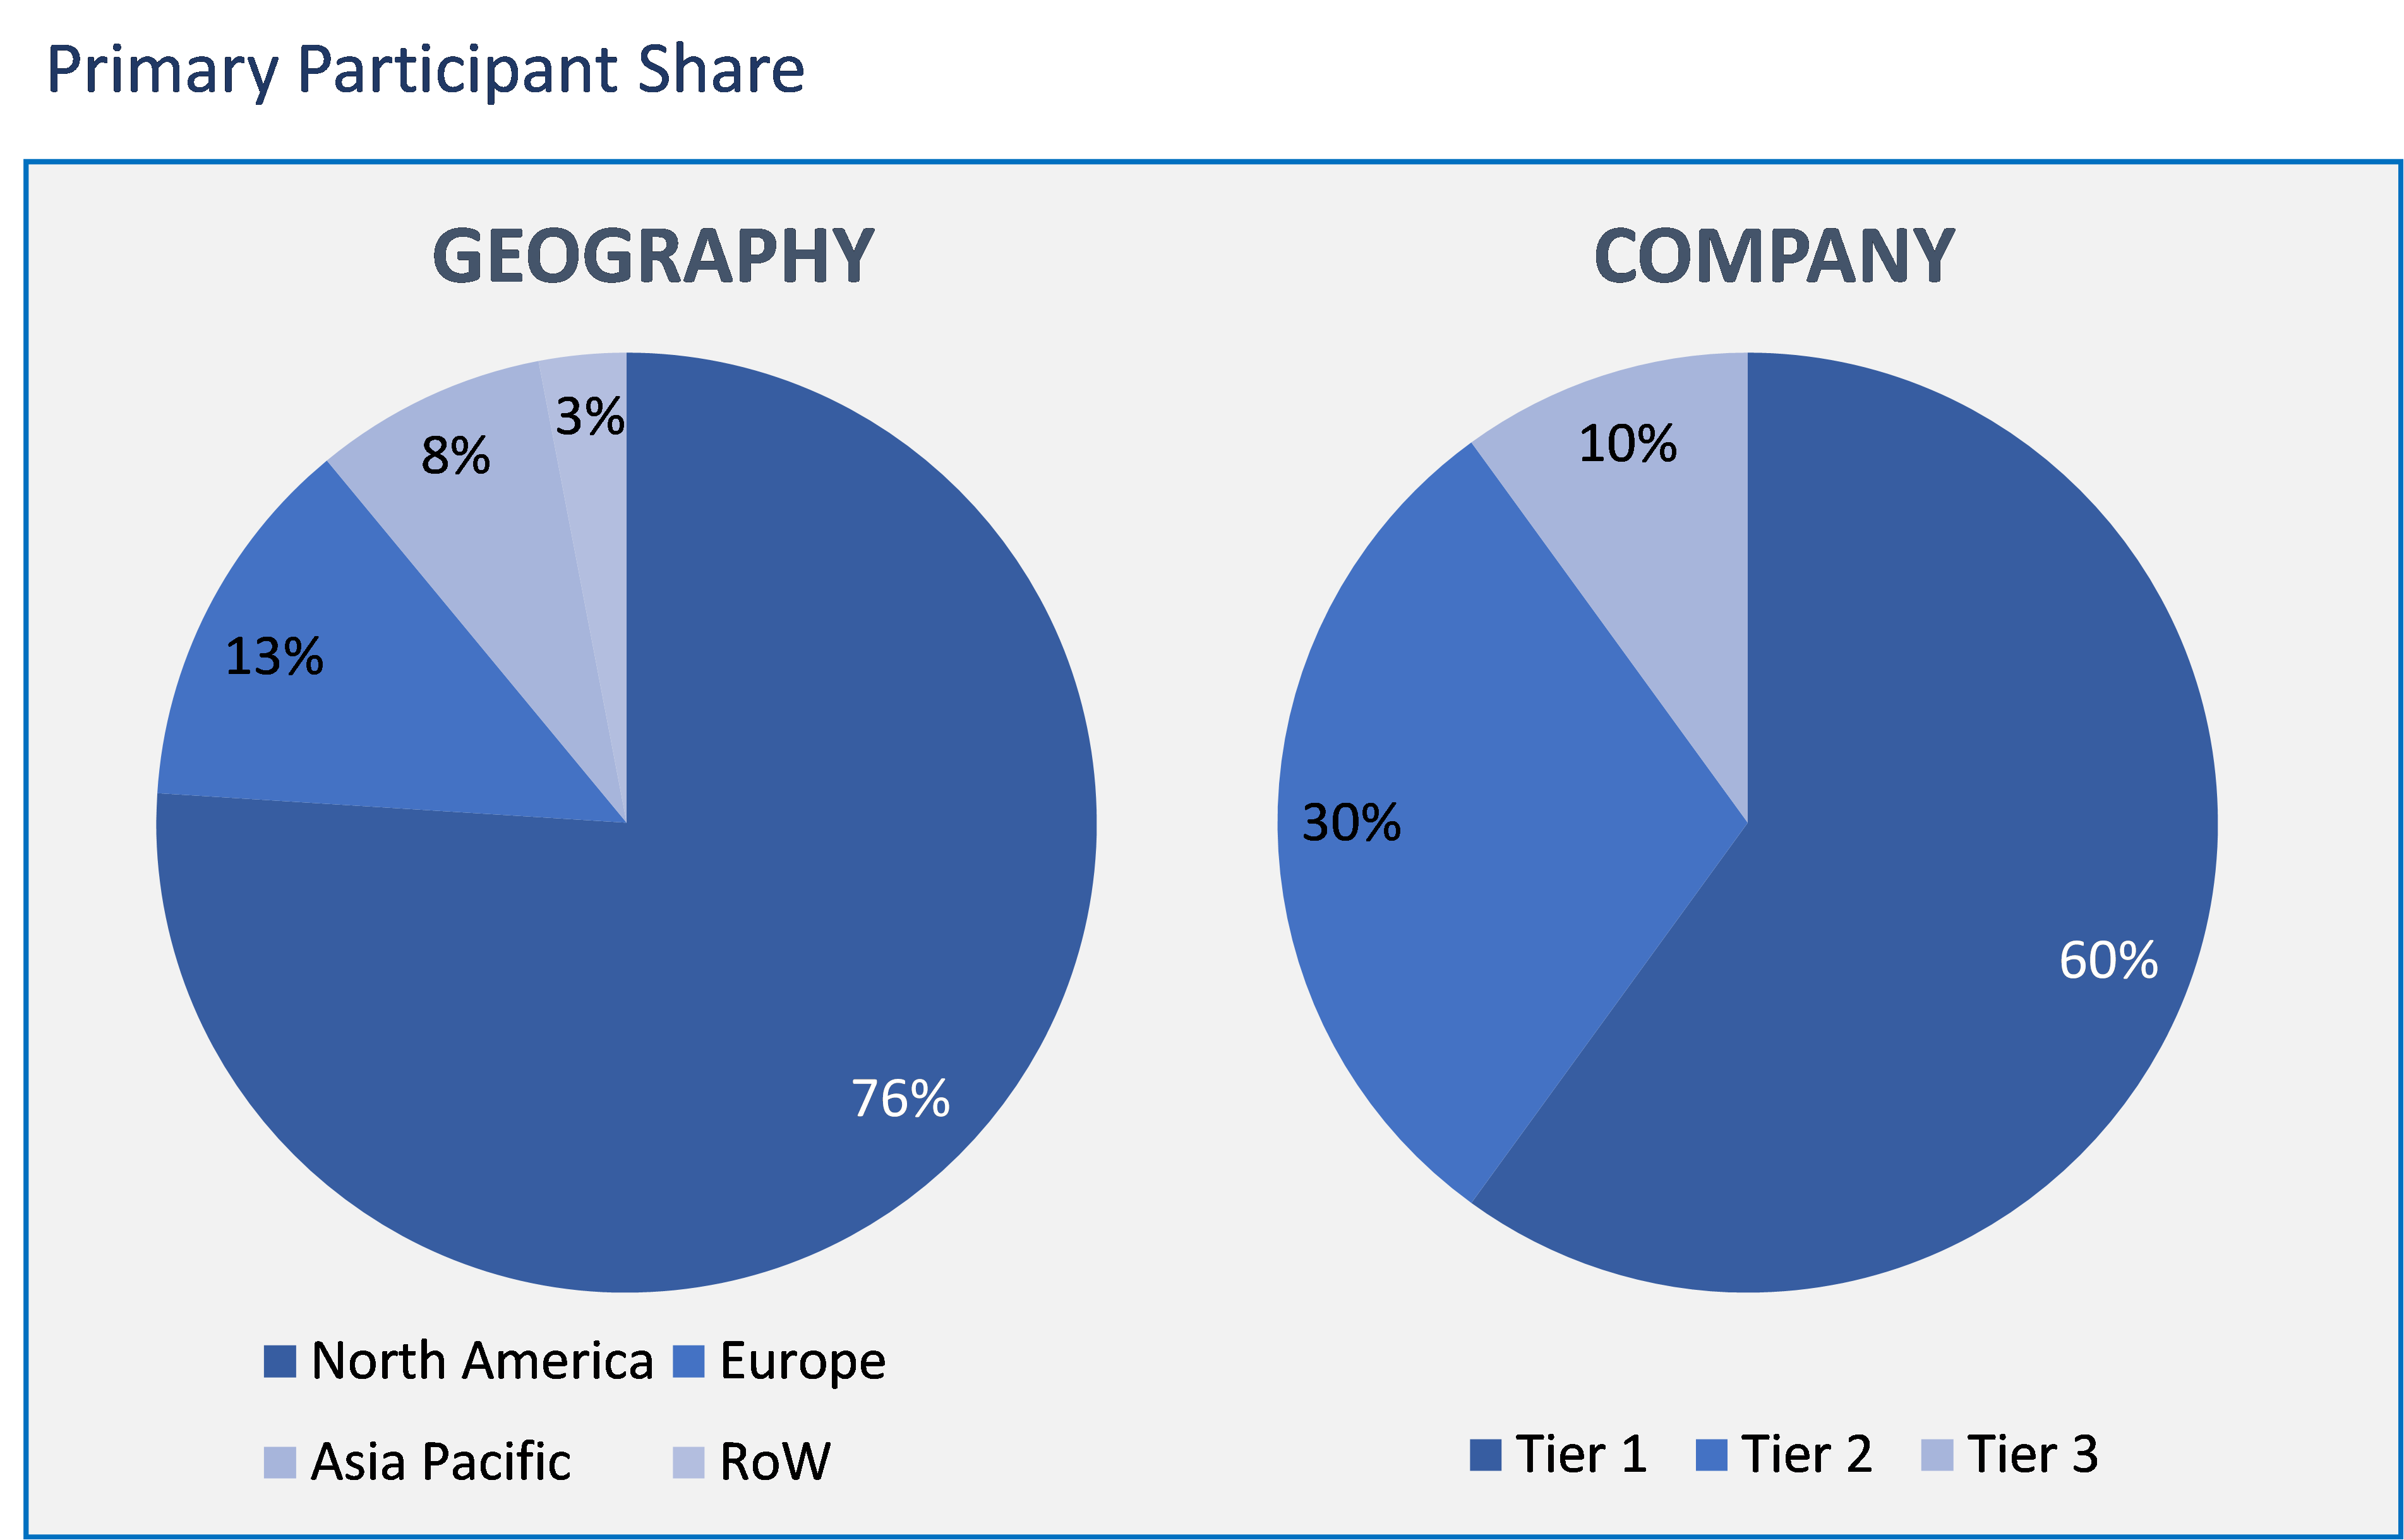
The gluten-free products market has been analyzed by utilizing the optimum combination of secondary sources and in-house methodology, along with an irreplaceable blend of primary insights. The real-time assessment of the market is an integral part of our market sizing and forecasting methodology. Our industry experts and panel of primary participants have helped in compiling relevant aspects with realistic parametric estimations for a comprehensive study. The participation share of different categories of primary participants is given below:
Gluten-free Products Market by Type:
- Bakery products
- Snacks & RTE products
- Condiments & dressings
- Pizzas & Pastas
- Other types
Gluten-free Products Market by Distribution Channel:
- Conventional stores
- Grocery stores
- Mass merchandizers
- Warehouse clubs
- Online retailers
- Specialty stores
- Bakery stores
- Confectionery stores
- Gourmet stores
- Drugstores & pharmacies
Gluten-free Products Market by Form:
- Solid
- Liquid
Gluten-free Products Market by Geography:
- North America
- Europe
- Asia Pacific
- Rest of the World
The gluten-free products market is segmented firstly based on type. Among all types, the bakery food segment is estimated to acquire the maximum share in the market. This is due to the increasing demand for gluten-free bakery products in North America and European countries, where food including buns, bread, cakes, cookies, and other baking food is a staple food. Increasing awareness about celiac and other digestive problems is resulting in increasing demand for gluten-free products in the above-mentioned regions.
In the distribution channel segmentation, the conventional stores are the major distribution channels that acquire a maximum share in the market. Conventional stores are most commonly preferred for purchasing gluten-free products. Ease to access, availability of several products, and regular purchasing destination are few benefits associated with conventional stores.
As per the form of the products, the solid form of gluten-free products is most commonly available in this market. This is due to the large-scale production of the solid form of gluten-free products by manufacturers. Products such as buns, rolls, cookies, crackers, wafers, snack bars, and other various baked products are mostly consumed. Moreover, the large-scale production is attributed to the high demand, increased shelf life, convenience in manufacturing, and less cost of production for the solid form of products.
North America is witnessing the highest market share in the gluten-free market. This is ascribed to the rapidly increasing incidence of celiac diseases, high preference for gluten-free products, and increasing awareness about the diseases caused by gluten-contained products.
Advantageous regulatory framework and initiatives to encourage a gluten-free diet by the U.S. Food and Drug Administration and allowances are projected to boost the global market for gluten-free products in the countries of North America. Additionally, an increase in the population suffering from gluten allergies and celiac disease is likely to have a positive influence on the gluten-free products market growth.
The major vendors of the gluten-free products market include The Kraft Heinz Company, The Hain Celestial Group Inc, Barilla G.E.R Fratelli S.P.A, Freedom Foods Group Limited, Koninklijke Wessanen N.V, General Mills, Kellogg’s Company, ConAgra Brands Inc, Hero AG, Quinoa Corporation, Raisio PLC, Dr Schär AG/SPA, Enjoy Life Foods and Farmo S.P.A.
Therefore, gluten-free food is beneficial for many health issues. Change in the lifestyle is giving a wide scope for gluten-free readymade food due to the busy schedule and less time. The gluten-free products are available in the market without any effort which is inclining consumers towards the gluten-free products.
- This report includes the aspects that are majorly impacting the market positively and restricting the market's growth.
- This report gives the information of the market segments and sub-segments and the major contribution of the segments in the market growth.
This report provides a quantitative analysis of the market, which helps users understand the market penetration across the world.
- Executive Summary
- Industry Outlook
- Industry Overview
- Industry Trends
- Market Snapshot
- Market Definition
- Market Outlook
- Porter Five Forces
- Market characteristics
- Related Markets
- Market Overview
- Market Segmentation
- Market Dynamics
- Drivers
- Restraints
- Opportunities
- DRO - Impact Analysis
- Type: Market Size & Analysis
- Overview
- Bakery products
- Snacks & RTE products
- Condiments & dressings
- Pizzas & Pastas
- Other types
- Distribution Channel: Market Size & Analysis
- Overview
- Conventional stores
- Grocery stores
- Mass merchandizers
- Warehouse clubs
- Online retailers
- Specialty stores
- Bakery stores
- Confectionery stores
- Gourmet stores
- Drugstores & pharmacies
- Form: Market Size & Analysis
- Overview
- Solid
- Liquid
- Geography: Market Size & Analysis
- Overview
- North America
- Europe
- Asia Pacific
- Rest of the World
- Competitive Landscape
- Competitor Comparison Analysis
- Market Developments
- Mergers and Acquisitions, Legal, Awards, Partnerships
- Product Launches and execution
- Vendor Profiles
- The Kraft Heinz Company
- Overview
- Financial Overview
- Product Offerings
- Developments
- Business Strategy
- The Hain Celestial Group Inc
- Overview
- Financial Overview
- Product Offerings
- Developments
- Business Strategy
- Barilla G.E.R Fratelli S.P.A
- Overview
- Financial Overview
- Product Offerings
- Developments
- Business Strategy
- Freedom Foods Group Limited
- Overview
- Financial Overview
- Product Offerings
- Developments
- Business Strategy
- Koninklijke Wessanen N.V
- Overview
- Financial Overview
- Product Offerings
- Developments
- Business Strategy
- General Mills
- Overview
- Financial Overview
- Product Offerings
- Developments
- Business Strategy
- Kellogg’s Company
- Overview
- Financial Overview
- Product Offerings
- Developments
- Business Strategy
- ConAgra Brands Inc
- Overview
- Financial Overview
- Product Offerings
- Developments
- Business Strategy
- Hero AG
- Overview
- Financial Overview
- Product Offerings
- Developments
- Business Strategy
- Quinoa Corporation
- Overview
- Financial Overview
- Product Offerings
- Developments
- Business Strategy
- The Kraft Heinz Company
- Companies to Watch
- Raisio PLC
- Overview
- Products & Services
- Business Strategy
- Dr Schär AG/SPA
- Overview
- Products & Services
- Business Strategy
- Enjoy Life Foods
- Overview
- Products & Services
- Business Strategy
- Farmo S.P.A.
- Overview
- Products & Services
- Business Strategy
- Raisio PLC
- Analyst Opinion
- Annexure
- Report Scope
- Market Definitions
- Research Methodology
- Data Collation and In-house Estimation
- Market Triangulation
- Forecasting
- Report Assumptions
- Declarations
- Stakeholders
- Abbreviations
TABLE 1. GLOBAL GLUTEN-FREE PRODUCTS MARKET VALUE, BY TYPE, 2020-2026 (USD BILLION)
TABLE 2. GLOBAL GLUTEN-FREE PRODUCTS MARKET VALUE FOR BAKERY PRODUCTS, BY GEOGRAPHY, 2020-2026 (USD BILLION)
TABLE 3. GLOBAL GLUTEN-FREE PRODUCTS MARKET VALUE FOR SNACKS & RTE PRODUCTS, BY GEOGRAPHY, 2020-2026 (USD BILLION)
TABLE 4. GLOBAL GLUTEN-FREE PRODUCTS MARKET VALUE FOR CONDIMENTS & DRESSINGS, BY GEOGRAPHY, 2020-2026 (USD BILLION)
TABLE 5. GLOBAL GLUTEN-FREE PRODUCTS MARKET VALUE FOR PIZZAS & PASTAS, BY GEOGRAPHY, 2020-2026 (USD BILLION)
TABLE 6. GLOBAL GLUTEN-FREE PRODUCTS MARKET VALUE FOR OTHER TYPES, BY GEOGRAPHY, 2020-2026 (USD BILLION)
TABLE 7. GLOBAL GLUTEN-FREE PRODUCTS MARKET VALUE, BY DISTRIBUTION CHANNEL, 2020-2026 (USD BILLION)
TABLE 8. GLOBAL GLUTEN-FREE PRODUCTS MARKET VALUE FOR CONVENTIONAL STORES, BY GEOGRAPHY, 2020-2026 (USD BILLION)
TABLE 9. GLOBAL GLUTEN-FREE PRODUCTS MARKET VALUE FOR GROCERY STORES, BY TYPE, 2020-2026 (USD BILLION)
TABLE 10. GLOBAL GLUTEN-FREE PRODUCTS MARKET VALUE FOR MASS MERCHANDIZERS, BY TYPE, 2020-2026 (USD BILLION)
TABLE 11. GLOBAL GLUTEN-FREE PRODUCTS MARKET VALUE FOR WAREHOUSE CLUBS, BY TYPE, 2020-2026 (USD BILLION)
TABLE 12. GLOBAL GLUTEN-FREE PRODUCTS MARKET VALUE FOR ONLINE RETAILERS, BY TYPE, 2020-2026 (USD BILLION)
TABLE 13. GLOBAL GLUTEN-FREE PRODUCTS MARKET VALUE FOR SPECIALTY STORES, BY GEOGRAPHY, 2020-2026 (USD BILLION)
TABLE 14. GLOBAL GLUTEN-FREE PRODUCTS MARKET VALUE FOR BAKERY STORES, BY TYPE, 2020-2026 (USD BILLION)
TABLE 15. GLOBAL GLUTEN-FREE PRODUCTS MARKET VALUE FOR CONFECTIONERY STORES, BY TYPE, 2020-2026 (USD BILLION)
TABLE 16. GLOBAL GLUTEN-FREE PRODUCTS MARKET VALUE FOR GOURMET STORES, BY TYPE, 2020-2026 (USD BILLION)
TABLE 17. GLOBAL GLUTEN-FREE PRODUCTS MARKET VALUE FOR DRUGSTORES & PHARMACIES, BY GEOGRAPHY, 2020-2026 (USD BILLION)
TABLE 18. GLOBAL GLUTEN-FREE PRODUCTS MARKET VALUE, BY FORM, 2020-2026 (USD BILLION)
TABLE 19. GLOBAL GLUTEN-FREE PRODUCTS MARKET VALUE FOR SOLID, 2020-2026 (USD BILLION)
TABLE 20. GLOBAL GLUTEN-FREE PRODUCTSMARKET VALUE FOR LIQUID, BY GEOGRAPHY, 2020-2026 (USD BILLION)
TABLE 21. NORTH AMERICA GLUTEN-FREE PRODUCTS MARKET VALUE, BY COUNTRY, 2020-2026 (USD BILLION)
TABLE 22. NORTH AMERICA GLUTEN-FREE PRODUCTS MARKET VALUE, BY TYPE, 2020-2026 (USD BILLION)
TABLE 23. NORTH AMERICA GLUTEN-FREE PRODUCTS MARKET VALUE, BY DISTRIBUTION CHANNEL, 2020-2026 (USD BILLION)
TABLE 24. NORTH AMERICA GLUTEN-FREE PRODUCTS MARKET VALUE, BY FORM, 2020-2026 (USD BILLION)
TABLE 25. U.S GLUTEN-FREE PRODUCTS MARKET VALUE, BY TYPE, 2020-2026 (USD BILLION)
TABLE 26. U.S GLUTEN-FREE PRODUCTS MARKET VALUE, BY DISTRIBUTION CHANNEL, 2020-2026 (USD BILLION)
TABLE 27. U.S GLUTEN-FREE PRODUCTS MARKET VALUE, BY FORM, 2020-2026 (USD BILLION)
TABLE 28. CANADA GLUTEN-FREE PRODUCTS MARKET VALUE, BY TYPE, 2020-2026 (USD BILLION)
TABLE 29. CANADA GLUTEN-FREE PRODUCTS MARKET VALUE, BY DISTRIBUTION CHANNEL, 2020-2026 (USD BILLION)
TABLE 30. CANADA GLUTEN-FREE PRODUCTS MARKET VALUE, BY FORM, 2020-2026 (USD BILLION)
TABLE 31. EUROPE GLUTEN-FREE PRODUCTS MARKET VALUE, BY COUNTRY, 2020-2026 (USD BILLION)
TABLE 32. EUROPE GLUTEN-FREE PRODUCTS MARKET VALUE, BY TYPE, 2020-2026 (USD BILLION)
TABLE 33. EUROPE GLUTEN-FREE PRODUCTS MARKET VALUE, BY DISTRIBUTION CHANNEL, 2020-2026 (USD BILLION)
TABLE 34. EUROPE GLUTEN-FREE PRODUCTS MARKET VALUE, FORM, 2020-2026 (USD BILLION)
TABLE 35. GERMANY GLUTEN-FREE PRODUCTS MARKET VALUE, BY TYPE, 2020-2026 (USD BILLION)
TABLE 36. GERMANY GLUTEN-FREE PRODUCTS MARKET VALUE, BY DISTRIBUTION CHANNEL, 2020-2026 (USD BILLION)
TABLE 37. GERMANY GLUTEN-FREE PRODUCTS MARKET VALUE, BY FORM, 2020-2026 (USD BILLION)
TABLE 38. U.K GLUTEN-FREE PRODUCTS MARKET VALUE, BY TYPE, 2020-2026 (USD BILLION)
TABLE 39. U.K GLUTEN-FREE PRODUCTS MARKET VALUE, BY DISTRIBUTION CHANNEL, 2020-2026 (USD BILLION)
TABLE 40. U.K GLUTEN-FREE PRODUCTS MARKET VALUE, BY FORM, 2020-2026 (USD BILLION)
TABLE 41. FRANCE GLUTEN-FREE PRODUCTS MARKET VALUE, BY TYPE, 2020-2026 (USD BILLION)
TABLE 42. FRANCE GLUTEN-FREE PRODUCTS MARKET VALUE, BY DISTRIBUTION CHANNEL, 2020-2026 (USD BILLION)
TABLE 43. FRANCE GLUTEN-FREE PRODUCTS MARKET VALUE, BY FORM, 2020-2026 (USD BILLION)
TABLE 44. ITALY GLUTEN-FREE PRODUCTS MARKET VALUE, BY TYPE, 2020-2026 (USD BILLION)
TABLE 45. ITALY GLUTEN-FREE PRODUCTS MARKET VALUE, BY DISTRIBUTION CHANNEL, 2020-2026 (USD BILLION)
TABLE 46. ITALY GLUTEN-FREE PRODUCTS MARKET VALUE, BY FORM, 2020-2026 (USD BILLION)
TABLE 47. SPAIN GLUTEN-FREE PRODUCTS MARKET VALUE, BY TYPE, 2020-2026 (USD BILLION)
TABLE 48. SPAIN GLUTEN-FREE PRODUCTS MARKET VALUE, BY DISTRIBUTION CHANNEL, 2020-2026 (USD BILLION)
TABLE 49. SPAIN GLUTEN-FREE PRODUCTS MARKET VALUE, BY FORM, 2020-2026 (USD BILLION)
TABLE 50. ROE GLUTEN-FREE PRODUCTS MARKET VALUE, BY TYPE, 2020-2026 (USD BILLION)
TABLE 51. ROE GLUTEN-FREE PRODUCTS MARKET VALUE, BY DISTRIBUTION CHANNEL, 2020-2026 (USD BILLION)
TABLE 52. ROE GLUTEN-FREE PRODUCTS MARKET VALUE, BY FORM, 2020-2026 (USD BILLION)
TABLE 53. ASIA PACIFIC GLUTEN-FREE PRODUCTS MARKET VALUE, BY COUNTRY, 2020-2026 (USD BILLION)
TABLE 54. ASIA PACIFIC GLUTEN-FREE PRODUCTS MARKET VALUE, BY TYPE, 2020-2026 (USD BILLION)
TABLE 55. ASIA PACIFIC GLUTEN-FREE PRODUCTS MARKET VALUE, BY DISTRIBUTION CHANNEL, 2020-2026 (USD BILLION)
TABLE 56. ASIA PACIFIC GLUTEN-FREE PRODUCTS MARKET VALUE, BY FORM, 2020-2026 (USD BILLION)
TABLE 57. CHINA GLUTEN-FREE PRODUCTS MARKET VALUE, BY TYPE, 2020-2026 (USD BILLION)
TABLE 58. CHINA GLUTEN-FREE PRODUCTS MARKET VALUE, BY DISTRIBUTION CHANNEL, 2020-2026 (USD BILLION)
TABLE 59. CHINA GLUTEN-FREE PRODUCTS MARKET VALUE, BY FORM, 2020-2026 (USD BILLION)
TABLE 60. INDIA GLUTEN-FREE PRODUCTS MARKET VALUE, BY TYPE, 2020-2026 (USD BILLION)
TABLE 61. INDIA GLUTEN-FREE PRODUCTS MARKET VALUE, BY DISTRIBUTION CHANNEL, 2020-2026 (USD BILLION)
TABLE 62. INDIA GLUTEN-FREE PRODUCTS MARKET VALUE, BY FORM, 2020-2026 (USD BILLION)
TABLE 63. JAPAN GLUTEN-FREE PRODUCTS MARKET VALUE, BY TYPE, 2020-2026 (USD BILLION)
TABLE 64. JAPAN GLUTEN-FREE PRODUCTS MARKET VALUE, BY DISTRIBUTION CHANNEL, 2020-2026 (USD BILLION)
TABLE 65. JAPAN GLUTEN-FREE PRODUCTS MARKET VALUE, BY FORM, 2020-2026 (USD BILLION)
TABLE 66. REST OF APAC GLUTEN-FREE PRODUCTS MARKET VALUE, BY TYPE, 2020-2026 (USD BILLION)
TABLE 67. REST OF APAC GLUTEN-FREE PRODUCTS MARKET VALUE, BY DISTRIBUTION CHANNEL, 2020-2026 (USD BILLION)
TABLE 68. REST OF APAC GLUTEN-FREE PRODUCTS MARKET VALUE, BY FORM, 2020-2026 (USD BILLION)
TABLE 69. REST OF WORLD GLUTEN-FREE PRODUCTS MARKET VALUE, BY TYPE, 2020-2026 (USD BILLION)
TABLE 70. REST OF WORLD GLUTEN-FREE PRODUCTS MARKET VALUE, BY DISTRIBUTION CHANNEL, 2020-2026 (USD BILLION)
TABLE 71. REST OF WORLD GLUTEN-FREE PRODUCTS MARKET VALUE, BY FORM, 2020-2026 (USD BILLION)
TABLE 72. THE KRAFT HEINZ COMPANY: FINANCIALS
TABLE 73. THE KRAFT HEINZ COMPANY: PRODUCTS & SERVICES
TABLE 74. THE KRAFT HEINZ COMPANY: RECENT DEVELOPMENTS
TABLE 75. THE HAIN CELESTIAL GROUP INC: FINANCIALS
TABLE 76. THE HAIN CELESTIAL GROUP INC: PRODUCTS & SERVICES
TABLE 77. THE HAIN CELESTIAL GROUP INC: RECENT DEVELOPMENTS
TABLE 78. BARILLA G.E.R FRATELLI S.P.A: FINANCIALS
TABLE 79. BARILLA G.E.R FRATELLI S.P.A: PRODUCTS & SERVICES
TABLE 80. BARILLA G.E.R FRATELLI S.P.A: RECENT DEVELOPMENTS
TABLE 81. FREEDOM FOODS GROUP LIMITED: FINANCIALS
TABLE 82. FREEDOM FOODS GROUP LIMITED: PRODUCTS & SERVICES
TABLE 83. FREEDOM FOODS GROUP LIMITED: RECENT DEVELOPMENTS
TABLE 84. KONINKLIJKE WESSANEN N.V: FINANCIALS
TABLE 85. KONINKLIJKE WESSANEN N.V: PRODUCTS & SERVICES
TABLE 86. KONINKLIJKE WESSANEN N.V: RECENT DEVELOPMENTS
TABLE 87. GENERAL MILLS: FINANCIALS
TABLE 88. GENERAL MILLS: PRODUCTS & SERVICES
TABLE 89. GENERAL MILLS: RECENT DEVELOPMENTS
TABLE 90. KELLOGG’S COMPANY: FINANCIALS
TABLE 91. KELLOGG’S COMPANY: PRODUCTS & SERVICES
TABLE 92. KELLOGG’S COMPANY: RECENT DEVELOPMENTS
TABLE 93. CONAGRA BRANDS INC: FINANCIALS
TABLE 94. CONAGRA BRANDS INC: PRODUCTS & SERVICES
TABLE 95. CONAGRA BRANDS INC: RECENT DEVELOPMENTS
TABLE 96. HERO AG: FINANCIALS
TABLE 97. HERO AG: PRODUCTS & SERVICES
TABLE 98. HERO AG: RECENT DEVELOPMENTS
TABLE 99. QUINOA CORPORATION: FINANCIALS
TABLE 100. QUINOA CORPORATION: PRODUCTS & SERVICES
TABLE 101. QUINOA CORPORATION: RECENT DEVELOPMENTS
TABLE 102. RAISIO PLC: PRODUCTS & SERVICES
TABLE 103. DR SCHÄR AG/SPA: PRODUCTS & SERVICES
TABLE 104. ENJOY LIFE FOODS: PRODUCTS & SERVICES
TABLE 105. FARMO S.P.A.: PRODUCTS & SERVICES
Research Framework
Infoholic Research works on a holistic 360° approach in order to deliver high quality, validated and reliable information in our market reports. The Market estimation and forecasting involves following steps:
- Data Collation (Primary & Secondary)
- In-house Estimation (Based on proprietary data bases and Models)
- Market Triangulation
- Forecasting

Market related information is congregated from both primary and secondary sources.
Primary sources
Involved participants from all global stakeholders such as Solution providers, service providers, Industry associations, thought leaders etc. across levels such as CXOs, VPs and managers. Plus, our in-house industry experts having decades of industry experience contribute their consulting and advisory services.
Secondary sources
Include public sources such as regulatory frameworks, government IT spending, government demographic indicators, industry association statistics, and company publications along with paid sources such as Factiva, OneSource, Bloomberg among others.
![]()


