
Silicone Grease Market, By End-User (Automotive, Construction, Mining, and Industrial) – Drivers, Opportunities, Trends and Forecast Up to 2022
- July, 2017
- Domain: Chemicals, Materials & Food - Specialty Chemicals
- Get Free 10% Customization in this Report
Silicone oil had started emerging as a niche market with high growth potential due to its wide operating temperature range and relatively higher resistance. When silicone oil is combined with a thickener, it forms silicone grease. Increasing industrialization and focus on usage of better and more efficient grease in automotive vehicles has created opportunities for Silicone Grease Market. Although, many new chemicals have been introduced in the market providing the property of lubrication but not all of them have enjoyed high demand and uptake.
Research Methodology
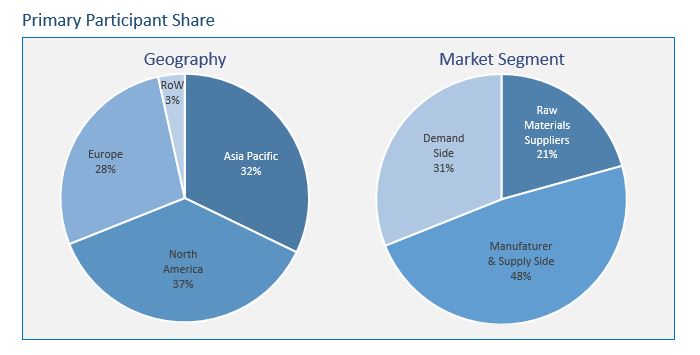
The silicone grease market has been analyzed by utilizing the optimum combination of secondary sources and in-house methodology along with an irreplaceable blend of primary insights. The real-time assessment of the market is an integral part of our market sizing and forecasting methodology, wherein our industry experts and panel of primary participants helped in compiling the best quality with realistic parametric estimations. Further, the participation share of different categories of primary participants is given below:
Key Market Insights
Automotive sector is the major contributor for the Silicone Grease Market followed by industrial sector. Silicone grease, even though a premium priced product, is preferred over other greases present in the market due to certain superior properties such as thermal resistance and better performance. The silicone grease market has seen a rise in demand over the years owing to increasing demand from developing countries and increased foreign direct investments by manufacturing companies in these regions. High production cost of silicone oil has been a limiting factor for the Silicone Grease Market ever since its introduction, but the superior performance has paved path for market growth.
Asia Pacific is one of the key consumers for silicone grease and is expected to grow at a higher rate during the forecast period with most of the demand generated from the developing countries such as China and India. China contributed majority of the revenue in the year 2016. The expected economic stability in Europe will boost its automotive sector thereby increasing market opportunities for silicone grease.
The study of the Global Silicone Grease Market provides market size information and market trends along with factors and parameters impacting it in both short and long term. The study ensures a 360° view, bringing out the complete key insights of the industry. These insights help the business decision makers to make better business plans and informed decisions for the future business. In addition, the study helps the venture capitalist in understanding the companies better and take informed decisions.
There has been an intense competition among the manufacturers due to presence of many big multinational companies with wide product profiles in silicone grease. All the companies are focusing on R&D to develop new products with improved efficiency to attain more customers, thus, increase their market share. Some of the prominent companies operating in silicone grease market are Momentive Performance Materials Inc., Dow Corning Corporation, Elkem AS and Wacker Chemie AG, among many others.
ReportScope:
- End-Users
- Automotive
- Construction
- Industrial
- Mining
- Others
- Regions
- Asia Pacific
- Europe
- North America
- Rest of the World
- Industry outlook: market trends and drivers, restraints, and opportunities
1 Report Outline
1.1 Introduction
1.2 Report Scope
1.3 Market Definition
1.4 Research Methodology
1.4.1 Data Collation and In-house Estimation
1.4.2 Market Triangulation
1.4.3 Forecasting
1.5 Study Declarations
1.6 Report Assumptions
1.7 Stakeholders
2 Executive Summary
2.1 Automotive sector to maintain dominance in the silicone grease market
2.2 Asia Pacific increasing lead in the silicone grease market
3 Market Positioning
3.1 Total Addressable Market (TAM): Silicone
3.1.1 Market Overview
3.1.2 Major Trends
3.2 Segmented Addressable Market (SAM)
3.3 Related Markets
4 Market Outlook
4.1 Overview
4.2 Value Chain Analysis
4.3 PESTLE Analysis
4.4 Porter 5 (Five) Forces
4.5 Patent Analysis
5 Market Characteristics
5.1 Market Segmentation
5.2 Market Dynamics
5.2.1 Drivers
5.2.1.1 Increasing manufacturing industries
5.2.1.2 Growing purchasing power and greater economic growth in developing countries
5.2.2 Restraints
5.2.2.1 Low penetration in underdeveloped countries
5.2.2.2 High manufacturing cost of silicone oil
5.2.3 Opportunities
5.2.3.1 Large untapped market in developing and underdeveloped countries
5.2.3.2 Increasing penetration of silicone grease in the mining and industrial sectors
5.2.4 DRO – Impact Analysis
6 End-users: Market Size and Analysis
6.1 Overview
6.2 Automotive
6.3 Construction
6.4 Industrial
6.5 Mining
6.6 Vendor Profiles
6.6.1 Momentive Performance Materials Inc.
6.6.2 Wacker Chemie AG
6.6.3 Elkem AS
6.6.4 Dow Corning Corporation
6.6.5 Shin-Etsu Chemical Co., Ltd.
(Overview, business unit, geographic revenues, recent developements, business focus, SWOT analysis and business strategy have been coverd for all vendors)
6.7 Customer Profile
6.7.1 3M Company
6.7.2 Huntsman Corporation
6.7.3 Royal Dutch Shell plc
6.7.4 Exxon Mobil Corporation
6.7.5 China Petroleum & Chemical Corporation
(Overview, business unit, geographic revenues, recent developements, business focus, SWOT analysis and business strategy have been coverd for all customers)
7 Regions: Market Size and Analysis
7.1 Overview
7.2 Asia Pacific
7.2.1 Asia Pacific Market by Geography
7.2.2 Asia Pacific Market by End-user
7.3 Europe
7.3.1 Europe Market by Geography
7.3.2 Europe Market by End-user
7.4 North America
7.4.1 North America Market by Geography
7.4.2 North America Market by End-user
7.5 Rest of the World
7.5.1 Rest of the World Market by Geography
7.5.2 Rest of the World Market by End-user
8 Companies to Watch for
8.1 Shin-Etsu Chemical Co., Ltd.
8.2 Dow Corning Corporation
9 Competitive Landscape
9.1 Competitor Comparison Analysis
9.2 Market Landscape
9.2.1 Exhibition & Product Launch
9.2.2 Expansion
9.2.3 Legal
9.2.4 Mergers, Acquisitions & Joint Ventures
9.2.5 Price Hike
9.2.6 Restructuring & Repositioning
10 Expert’s Views
Annexure
Abbreviations
TABLE 1 GLOBAL SILICONE GREASE MARKET VALUE, BY END-USER, 2015−2022 ($MILLION) 27
TABLE 2 GLOBAL SILICONE GREASE MARKET VOLUME, BY APPLICATION, 2015−2022 (KILOTON) 28
TABLE 3 GLOBAL SILICONE GREASE MARKET VALUE IN AUTOMOTIVE, BY GEOGRAPHY, 2015−2022 ($MILLION) 29
TABLE 4 GLOBAL SILICONE GREASE MARKET VOLUME IN AUTOMOTIVE, BY GEOGRAPHY, 2015−2022 (KILOTON) 29
TABLE 5 GLOBAL SILICONE GREASE MARKET VALUE IN CONSTRUCTION, BY GEOGRAPHY, 2015−2022 ($MILLION) 30
TABLE 6 GLOBAL SILICONE GREASE MARKET VOLUME IN CONSTRUCTION, BY GEOGRAPHY, 2015−2022 (KILOTON) 30
TABLE 7 GLOBAL SILICONE GREASE MARKET VALUE IN INDUSTRIAL SECTOR, BY GEOGRAPHY, 2015−2022 ($MILLION) 31
TABLE 8 GLOBAL SILICONE GREASE MARKET VOLUME IN INDUSTRIAL SECTOR, BY GEOGRAPHY, 2015−2022 (KILOTON) 32
TABLE 9 GLOBAL SILICONE GREASE MARKET VALUE IN MINING, BY GEOGRAPHY, 2015−2022 ($MILLION) 33
TABLE 10 GLOBAL SILICONE GREASE MARKET VOLUME IN MINING, BY GEOGRAPHY, 2015−2022 (KILOTON) 33
TABLE 11 MOMENTIVE PERFORMANCE MATERIALS INC.: RECENT DEVELOPMENTS 36
TABLE 12 WACKER CHEMIE AG: RECENT DEVELOPMENTS 42
TABLE 13 ELKEM AS: BUSINESS AREAS 47
TABLE 14 ELKEM AS: RECENT DEVELOPMENTS 47
TABLE 15 DOW CORNING CORPORATION: RECENT DEVELOPMENTS 50
TABLE 16 SHIN-ETSU CHEMICAL CO., LTD.: PRODUCT PROFILE 55
TABLE 17 SHIN-ETSU CHEMICAL CO., LTD.: RECENT DEVELOPMENTS 55
TABLE 18 3M COMPANY: RECENT DEVELOPMENTS 60
TABLE 19 HUNTSMAN CORPORATION: OVERVIEW 63
TABLE 20 HUNTSMAN CORPORATION: BUSINESS UNITS 63
TABLE 21 HUNTSMAN CORPORATION: RECENT DEVELOPMENTS 64
TABLE 22 ROYAL DUTCH SHELL PLC: RECENT DEVELOPMENTS 70
TABLE 23 EXXON MOBIL CORPORATION: BUSINESS UNIT 74
TABLE 24 EXXON MOBIL CORPORATION: GEOGRAPHIC REVENUE 75
TABLE 25 CHINA PETROLEUM & CHEMICAL CORPORATION: RECENT DEVELOPMENTS 80
TABLE 26 GLOBAL SILICONE GREASE MARKET VALUE, BY GEOGRAPHY, 2015−2022 ($MILLION) 83
TABLE 27 GLOBAL SILICONE GREASE MARKET VOLUME, BY GEOGRAPHY, 2015−2022 (KILOTON) 84
TABLE 28 ASIA PACIFIC SILICONE GREASE MARKET VALUE, BY GEOGRAPHY, 2015−2022 ($MILLION) 85
TABLE 29 ASIA PACIFIC SILICONE GREASE MARKET VOLUME, BY GEOGRAPHY, 2015−2022 (KILOTON) 85
TABLE 30 ASIA PACIFIC SILICONE GREASE MARKET VALUE, BY END-USER, 2015−2022 ($MILLION) 86
TABLE 31 ASIA PACIFIC SILICONE GREASE MARKET VOLUME, BY END-USER, 2015−2022 (KILOTON) 87
TABLE 32 EUROPE SILICONE GREASE MARKET VALUE, BY GEOGRAPHY, 2015−2022 ($MILLION) 88
TABLE 33 EUROPE SILICONE GREASE MARKET VOLUME, BY GEOGRAPHY, 2015−2022 (KILOTON) 88
TABLE 34 EUROPE SILICONE GREASE MARKET VALUE, BY END-USER, 2015−2022 ($MILLION) 89
TABLE 35 EUROPE SILICONE GREASE MARKET VOLUME, BY END-USER, 2015−2022 (KILOTON) 90
TABLE 36 NORTH AMERICA SILICONE GREASE MARKET VALUE, BY GEOGRAPHY, 2015−2022 ($MILLION) 91
TABLE 37 NORTH AMERICA SILICONE GREASE MARKET VOLUME, BY GEOGRAPHY, 2015−2022 (KILOTON) 91
TABLE 38 NORTH AMERICA SILICONE GREASE MARKET VALUE, BY END-USER, 2015−2022 ($MILLION) 92
TABLE 39 NORTH AMERICA SILICONE GREASE MARKET VOLUME, BY END-USER, 2015−2022 (KILOTON) 93
TABLE 40 REST OF THE WORLD SILICONE GREASE MARKET VALUE, BY GEOGRAPHY, 2015−2022 ($MILLION) 94
TABLE 41 REST OF THE WORLD SILICONE GREASE MARKET VOLUME, BY GEOGRAPHY, 2015−2022 (KILOTON) 94
TABLE 42 REST OF THE WORLD SILICONE GREASE MARKET VALUE, BY END-USER, 2015−2022 ($MILLION) 95
TABLE 43 REST OF THE WORLD SILICONE GREASE MARKET VOLUME, BY END-USER, 2015−2022 (KILOTON) 96
TABLE 44 EXHIBITION & PRODUCT LAUNCH, 2015–2017 99
TABLE 45 EXPANSION, 2012–2017 100
TABLE 46 LEGAL, 2015 102
TABLE 47 MERGER, ACQUISITION & JOINT VENTURE, 2013–2017 102
TABLE 48 PRICE HIKE, 2017 102
TABLE 49 RESTRUCTURING & REPOSITIONING, 2014 103
Research Framework
Infoholic Research works on a holistic 360° approach in order to deliver high quality, validated and reliable information in our market reports. The Market estimation and forecasting involves following steps:
- Data Collation (Primary & Secondary)
- In-house Estimation (Based on proprietary data bases and Models)
- Market Triangulation
- Forecasting

Market related information is congregated from both primary and secondary sources.
Primary sources
Involved participants from all global stakeholders such as Solution providers, service providers, Industry associations, thought leaders etc. across levels such as CXOs, VPs and managers. Plus, our in-house industry experts having decades of industry experience contribute their consulting and advisory services.
Secondary sources
Include public sources such as regulatory frameworks, government IT spending, government demographic indicators, industry association statistics, and company publications along with paid sources such as Factiva, OneSource, Bloomberg among others.
![]()


