
Elastomeric Foam Insulation Market By Application (Acoustic Insulation, Hybrid Insulation and Thermal Insulation), By End-User (Automotive, Construction, Electrical and Electronics, Healthcare and Industrial) – Drivers, Opportunities, Trends and Forecast Up to 2022
- June, 2017
- Domain: Chemicals, Materials & Food - Specialty Chemicals
- Get Free 10% Customization in this Report
Elastomeric foam insulation products are those which have insulation properties. These are light weight and thus reduce the overall weight of the structure. Furthermore, increasing industrialization, increasing miniaturization, and improving technologies are giving rise to an increased demand for the insulation materials, thus creating opportunities for elastomeric foam insulation which quickly made their stance in the market as soon as they were introduced. The properties of insulation and light weight within affordable price ranges have attracted the customers. New high-performance materials have been developed in the past decades and have proved to be useful in major application areas of the industrial and automotive sectors. But due to economical pricing and superior properties, elastomeric foam insulation materials have created their own niche.
Research Methodology
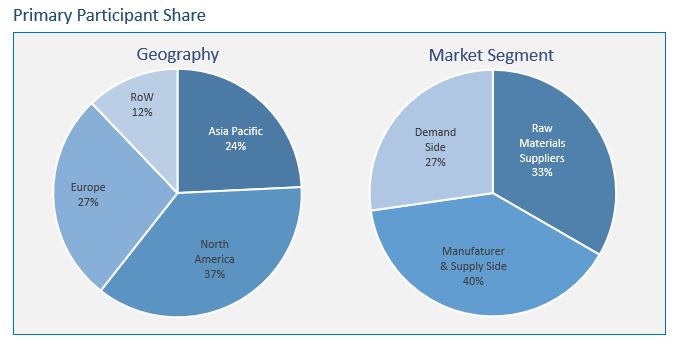
The elastomeric foam insulation market has been analyzed by utilizing the optimum combination of secondary sources and in-house methodology along with an irreplaceable blend of primary insights. The real-time assessment of the market is an integral part of our market sizing and forecasting methodology, wherein our industry experts and panel of primary participants helped in compiling the best quality with realistic parametric estimations. Further, the participation share of different categories of primary participants is given below:
Key Market Insights
The automotive sector and the construction industry are the major contributors to the Global Elastomeric Foam Insulation Market owing to the high demand from developing countries and the increased foreign investment by the companies in these geographies. Regulations to limit the noise is further growing the demand of these products in the industrial and healthcare sectors. Healthcare is also one of the key growing end-users of the elastomeric foam insulation products.
Asia Pacific is a key consumer of the elastomeric foam insulation products and is expected to grow with a high growth rate during the forecast period with significant demand coming from developing countries such as China and India. China contributed a major portion of the revenue in the year 2016. The economic stability in Europe and North America is expected to boost its healthcare and automotive industry, thereby increasing market opportunities for the elastomeric foam insulation market. Supportive government regulations for the implementation of building codes and the increase in disposable income are driving the market.
The study of the Global Elastomeric Foam Insulation Market includes the market size information and market trends along with the factors and parameters impacting it in both short- and long-term. The study entails a 360° view, bringing out the complete key insights of the industry. These insights help the business decision-makers to make better business plans and informed decisions for the future. In addition, the study helps the venture capitalists in understanding the companies better and take informed decisions.
The production market is very competitive in the Global Elastomeric Foam Insulation Market with the presence of many big multinational companies competing among each other. All the companies are making huge investments on R&D to innovate and to attain more customers, thus, increasing their market share. Some of the prominent companies operating in the Global Elastomeric Foam Insulation Market include BASF SE, PolyOne Corporation, Dow Chemical Company, SABIC, Armacell, and K-Flex.
Report Scope:
- Application
- Acoustic Insulation
- Hybrid
- Thermal Insulation
- End-users
- Automotive
- Construction
- Electrical & Electronics
- Healthcare
- Industrial
- Others
- Regions
- Asia Pacific
- Europe
- North America
- Rest of the World
- Industry outlook: Market trends, drivers, restraints, and opportunities
1 Report Outline
1.1 Introduction
1.2 Report Scope
1.3 Market Definition
1.4 Research Methodology
1.4.1 Data Collation & In-House Estimation
1.4.2 Market Triangulation
1.4.3 Forecasting
1.5 Study Declarations
1.6 Report Assumptions
1.7 Stakeholders
2 Executive Summary
2.1 Developed Countries Expected to See Shrinking Share in Elastomeric Foam Insulation Market
2.2 Thermal Insulation Leads the Elastomeric Foam Insulation Market
3 Market Positioning
3.1 Total Addressable Market (TAM): Insulation Material
3.1.1 Market Overview
3.1.2 Major Trends
3.2 Segmented Addressable Market (SAM)
3.3 Related Markets
4 Market Outlook
4.1 Overview
4.2 Value Chain Analysis
4.3 PESTLE Analysis
4.4 Porter 5 (Five) Forces
4.5 Patent Analysis
5 Market Characteristics
5.1 Market Segmentation
5.2 Market Dynamics
5.2.1 Drivers
5.2.1.1 Increasing construction and manufacturing industry
5.2.1.2 Growing purchasing power and greater economic growth in Asia Pacific
5.2.2 Restraints
5.2.2.1 Low penetration in underdeveloped countries
5.2.2.2 Availability of cheaper alternatives affect the market growth in emerging economies
5.2.3 Opportunities
5.2.3.1 Large untapped market in developing & underdeveloped countries
5.2.3.2 Development of eco-friendly products
5.3 DRO – Impact Analysis
6 Application: Market Size and Analysis
6.1 Overview
6.2 Acoustic Insulation
6.3 Hybrid Insulation
6.4 Thermal Insulation
6.5 Vendors Profile
6.5.1 BASF SE
6.5.2 Dow Chemical Company
6.5.3 Saudi Basic Industries Corporation
6.5.4 PolyOne Corporation
6.5.5 Armacell International S.A.
6.5.6 L’ISOLANTE K-FLEX
(Overview, Business Unit, Geographic Revenue, Product Profile, Recent Developments, Business Focus, SWOT analysis and Business Strategy are covered for all the vendors)
7 End-users: Market Size and Analysis
7.1 Overview
7.2 Automotive
7.3 Construction
7.4 Electrical & Electronics
7.5 Healthcare
7.6 Industrial
7.7 Customers Profile
7.7.1 3M Company
7.7.2 Fiat Chrysler Automobiles N.V.
7.7.3 General Electric Company
7.7.4 Siemens AG
7.7.5 Vinci S.A.
(Overview, Business Unit, Geographic Revenue, Product Profile, Recent Developments, Business Focus, SWOT analysis and Business Strategy are covered for all the customers)
8 Regions: Market Size and Analysis
8.1 Overview
8.2 Asia Pacific
8.2.1 Asia Pacific Market, By Geography
8.2.2 Asia Pacific Market, By End-user
8.2.3 Asia Pacific Market, By Application
8.3 Europe
8.3.1 Europe Market, By Geography
8.3.2 Europe Market, By End-user
8.3.3 Europe Market, By Application
8.4 North America
8.4.1 North America Market, By Geography
8.4.2 North America Market, By End-user
8.4.3 North America Market, By Application
8.5 Rest of the World
8.5.1 Rest of the World Market, By Geography
8.5.2 Rest of the World Market, By End-user
8.5.3 Rest of the World Market, By Application
9 Companies to Watch for
9.1 Covestro AG
9.1.1 Introduction
9.1.2 Business Units
9.1.3 Energy Efficient Building Solutions
9.2 Merger of DuPont and Dow Chemical Company
10 Competitive Landscape
10.1 Competitor Comparison Analysis
10.2 Market Landscape
10.2.1 Agreements & Collaborations
10.2.2 Divestment & Divestiture
10.2.3 Exhibition & Product Launch
10.2.4 Expansion
10.2.5 Mergers, Acquisitions & Joint Ventures
10.2.6 Restructuring & Repositioning
11 Expert’s Views
Annexure
Abbreviations
TABLE 1 GLOBAL ELASTOMERIC FOAM INSULATION MARKET VALUE, BY APPLICATION, 2015–2022 ($MILLION)
TABLE 2 GLOBAL ELASTOMERIC FOAM INSULATION MARKET VOLUME, BY APPLICATION, 2015–2022 (KILOTON)
TABLE 3 GLOBAL ELASTOMERIC ACOUSTIC FOAM INSULATION MARKET VALUE, BY GEOGRAPHY, 2015–2022 ($MILLION)
TABLE 4 GLOBAL ELASTOMERIC ACOUSTIC FOAM INSULATION MARKET VOLUME, BY GEOGRAPHY, 2015–2022 (KILOTON)
TABLE 5 GLOBAL ELASTOMERIC HYBRID FOAM INSULATION MARKET VALUE, BY GEOGRAPHY, 2015–2022 ($MILLION)
TABLE 6 GLOBAL ELASTOMERIC HYBRID FOAM INSULATION MARKET VOLUME, BY GEOGRAPHY, 2015–2022 (KILOTON)
TABLE 7 GLOBAL ELASTOMERIC THERMAL FOAM INSULATION MARKET VALUE, BY GEOGRAPHY, 2015–2022 ($MILLION)
TABLE 8 GLOBAL ELASTOMERIC THERMAL FOAM INSULATION MARKET VOLUME, BY GEOGRAPHY, 2015–2022 (KILOTON)
TABLE 9 BASF SE: PRODUCT PROFILE
TABLE 10 BASF SE: RECENT DEVELOPMENTS
TABLE 11 DOW CHEMICAL COMPANY: PRODUCT PROFILE
TABLE 12 DOW CHEMICAL COMPANY: RECENT DEVELOPMENTS
TABLE 13 POLYONE CORPORATION: PRODUCT PROFILE
TABLE 14 POLYONE CORPORATION: RECENT DEVELOPMENTS
TABLE 15 ARMACELL INTERNATIONAL S.A.: RECENT DEVELOPMENTS
TABLE 16 L’ISOLANTE K-FLEX: PRODUCT PROFILE
TABLE 17 L’ISOLANTE K-FLEX: RECENT DEVELOPMENTS
TABLE 18 GLOBAL ELASTOMERIC FOAM INSULATION MARKET VALUE, BY END-USER, 2015–2022 ($MILLION)
TABLE 19 GLOBAL ELASTOMERIC FOAM INSULATION MARKET VOLUME, BY APPLICATION, 2015–2022 (KILOTON)
TABLE 20 GLOBAL ELASTOMERIC FOAM INSULATION MARKET VALUE IN AUTOMOTIVE, BY GEOGRAPHY, 2015–2022 ($MILLION)
TABLE 21 GLOBAL ELASTOMERIC FOAM INSULATION MARKET VOLUME IN AUTOMOTIVE, BY GEOGRAPHY, 2015–2022 (KILOTON)
TABLE 22 GLOBAL ELASTOMERIC FOAM INSULATION MARKET VALUE IN CONSTRUCTION, BY GEOGRAPHY, 2015–2022 ($MILLION)
TABLE 23 GLOBAL ELASTOMERIC FOAM INSULATION MARKET VOLUME IN CONSTRUCTION, BY GEOGRAPHY, 2015–2022 (KILOTON)
TABLE 24 GLOBAL ELASTOMERIC FOAM INSULATION MARKET VALUE IN ELECTRICAL & ELECTRONICS, BY GEOGRAPHY, 2015–2022 ($MILLION)
TABLE 25 GLOBAL ELASTOMERIC FOAM INSULATION MARKET VOLUME IN ELECTRICAL & ELECTRONICS, BY GEOGRAPHY, 2015–2022 (KILOTON)
TABLE 26 GLOBAL ELASTOMERIC FOAM INSULATION MARKET VALUE IN HEALTHCARE, BY GEOGRAPHY, 2015–2022 ($MILLION)
TABLE 27 GLOBAL ELASTOMERIC FOAM INSULATION MARKET VOLUME IN HEALTHCARE, BY GEOGRAPHY, 2015–2022 (KILOTON)
TABLE 28 GLOBAL ELASTOMERIC FOAM INSULATION MARKET VALUE IN INDUSTRIAL SECTOR, BY GEOGRAPHY, 2015–2022 ($MILLION)
TABLE 29 GLOBAL ELASTOMERIC FOAM INSULATION MARKET VOLUME IN INDUSTRIAL SECTOR, BY GEOGRAPHY, 2015–2022 (KILOTON)
TABLE 30 3M COMPANY: RECENT DEVELOPMENTS
TABLE 31 FIAT CHRYSLER AUTOMOBILES N.V.: PRODUCT PROFILE
TABLE 32 FIAT CHRYSLER AUTOMOBILES N.V.: RECENT DEVELOPMENTS
TABLE 33 GENERAL ELECTRIC COMPANY: PRODUCT PROFILE
TABLE 34 GENERAL ELECTRIC COMPANY: RECENT DEVELOPMENTS
TABLE 35 SIEMENS AG: BUSINESS UNITS (2012 AND 2013)
TABLE 36 SIEMENS AG: BUSINESS UNITS (2014–2016)
TABLE 37 SIEMENS AG: GEOGRAPHIC REVENUE
TABLE 38 SIEMENS AG: RECENT DEVELOPMENTS
TABLE 39 GLOBAL ELASTOMERIC FOAM INSULATION MARKET VALUE, BY GEOGRAPHY, 2015–2022 ($MILLION)
TABLE 40 GLOBAL ELASTOMERIC FOAM INSULATION MARKET VOLUME, BY GEOGRAPHY, 2015–2022 (KILOTON)
TABLE 41 ASIA PACIFIC ELASTOMERIC FOAM INSULATION MARKET VALUE, BY GEOGRAPHY, 2015–2022 ($MILLION)
TABLE 42 ASIA PACIFIC ELASTOMERIC FOAM INSULATION MARKET VOLUME, BY GEOGRAPHY, 2015–2022 (KILOTON)
TABLE 43 ASIA PACIFIC ELASTOMERIC FOAM INSULATION MARKET VALUE, BY END-USER, 2015–2022 ($MILLION)
TABLE 44 ASIA PACIFIC ELASTOMERIC FOAM INSULATION MARKET VOLUME, BY END-USER, 2015–2022 (KILOTON)
TABLE 45 ASIA PACIFIC ELASTOMERIC FOAM INSULATION MARKET VALUE, BY APPLICATION, 2015–2022 ($MILLION)
TABLE 46 ASIA PACIFIC ELASTOMERIC FOAM INSULATION MARKET VOLUME, BY APPLICATION, 2015–2022 (KILOTON)
TABLE 47 EUROPE ELASTOMERIC FOAM INSULATION MARKET VALUE, BY GEOGRAPHY, 2015–2022 ($MILLION)
TABLE 48 EUROPE ELASTOMERIC FOAM INSULATION MARKET VOLUME, BY GEOGRAPHY, 2015–2022 (KILOTON)
TABLE 49 EUROPE ELASTOMERIC FOAM INSULATION MARKET VALUE, BY END-USER, 2015–2022 ($MILLION)
TABLE 50 EUROPE ELASTOMERIC FOAM INSULATION MARKET VOLUME, BY END-USER, 2015–2022 (KILOTON)
TABLE 51 EUROPE ELASTOMERIC FOAM INSULATION MARKET VALUE, BY APPLICATION, 2015–2022 ($MILLION)
TABLE 52 EUROPE ELASTOMERIC FOAM INSULATION MARKET VOLUME, BY APPLICATION, 2015–2022 (KILOTON)
TABLE 53 NORTH AMERICA ELASTOMERIC FOAM INSULATION MARKET VALUE, BY GEOGRAPHY, 2015–2022 ($MILLION)
TABLE 54 NORTH AMERICA ELASTOMERIC FOAM INSULATION MARKET VOLUME, BY GEOGRAPHY, 2015–2022 (KILOTON)
TABLE 55 NORTH AMERICA ELASTOMERIC FOAM INSULATION MARKET VALUE, BY END-USER, 2015–2022 ($MILLION)
TABLE 56 NORTH AMERICA ELASTOMERIC FOAM INSULATION MARKET VOLUME, BY END-USER, 2015–2022 (KILOTON)
TABLE 57 NORTH AMERICA ELASTOMERIC FOAM INSULATION MARKET VALUE, BY PRODUCT, 2015–2022 ($MILLION)
TABLE 58 NORTH AMERICA ELASTOMERIC FOAM INSULATION MARKET VOLUME, BY PRODUCT, 2015–2022 (KILOTON)
TABLE 59 REST OF THE WORLD ELASTOMERIC FOAM INSULATION MARKET VALUE, BY GEOGRAPHY, 2015–2022 ($MILLION)
TABLE 60 REST OF THE WORLD ELASTOMERIC FOAM INSULATION MARKET VOLUME, BY GEOGRAPHY, 2015–2022 (KILOTON)
TABLE 61 REST OF THE WORLD ELASTOMERIC FOAM INSULATION MARKET VALUE, BY END-USER, 2015–2022 ($MILLION)
TABLE 62 REST OF THE WORLD ELASTOMERIC FOAM INSULATION MARKET VOLUME, BY END-USER, 2015–2022 (KILOTON)
TABLE 63 REST OF THE WORLD ELASTOMERIC FOAM INSULATION MARKET VALUE, BY APPLICATION, 2015–2022 ($MILLION)
TABLE 64 REST OF THE WORLD ELASTOMERIC FOAM INSULATION MARKET VOLUME, BY APPLICATION, 2015–2022 (KILOTON)
TABLE 65 AGREEMENTS & COLLABORATIONS, 2015–2017
TABLE 66 DIVESTMENT & DIVESTITURE, 2014-2017
TABLE 67 EXHIBITION & PRODUCT LAUNCH, 2013–2017
TABLE 68 EXPANSION, 2012–2017
TABLE 69 MERGER, ACQUISITION & JOINT VENTURE, 2012–2017
TABLE 70 RESTRUCTURING & REPOSITIONING, 2014–2015
Research Framework
Infoholic Research works on a holistic 360° approach in order to deliver high quality, validated and reliable information in our market reports. The Market estimation and forecasting involves following steps:
- Data Collation (Primary & Secondary)
- In-house Estimation (Based on proprietary data bases and Models)
- Market Triangulation
- Forecasting

Market related information is congregated from both primary and secondary sources.
Primary sources
Involved participants from all global stakeholders such as Solution providers, service providers, Industry associations, thought leaders etc. across levels such as CXOs, VPs and managers. Plus, our in-house industry experts having decades of industry experience contribute their consulting and advisory services.
Secondary sources
Include public sources such as regulatory frameworks, government IT spending, government demographic indicators, industry association statistics, and company publications along with paid sources such as Factiva, OneSource, Bloomberg among others.
![]()


