
Chlor Alkali Market By Chemicals (Caustic Soda, Chlorine, Soda Ash), By End-User (Paper & Pulp, Soap & Detergent, Chemicals, Water Treatment, Alumina, Glass, Vinyl) and By Geography – Global Driver, Restraints, Opportunities, Trends, and Forecast to 2022
- November, 2017
- Domain: Chemicals, Materials & Food - Inorganic Chemicals
- Get Free 10% Customization in this Report
Chlor Alkali chemicals are the ones produced by electrolysis of sodium chloride (Brine solution). The market is broadly categorized into three segments namely Caustic Soda (NaOH), Chlorine & Soda Ash (Sodium Bicarbonate) which are collectively known as chlor alkali chemicals. These chemicals are usually basic in nature and fall under the category of bulk chemicals. The main application areas of chlor Alkali chemicals are in soap & detergent industry, paper and pulp, textiles, water treatment, plastic industry, industrial solvents, alumina, pharmaceuticals etc.
Research Methodology
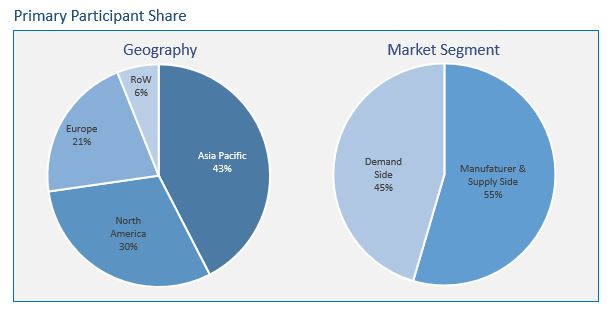
The chlor alkali market has been analyzed by utilizing the optimum combination of secondary sources and in-house methodology along with an irreplaceable blend of primary insights. The real-time assessment of the market is an integral part of our market sizing and forecasting methodology, wherein our industry experts and panel of primary participants helped in compiling the best quality with realistic parametric estimations. Further, the participation share of different categories of primary participants is given below:
Key Market Insights
Globally the demand for alkali chemicals is rising due to increase in the volume consumption for caustic soda for alumina industry. Since the refining process of alumina significantly requires caustic soda, hence the market of caustic soda is expected to witness a growth in the upcoming 6 years. Similarly, the demand for other alkali chemicals like chlorine and soda ash are being driven by their significant consumption in water treatment and detergent industry respectively.
The regional demand for chlor alkali is consistently growing, especially in the Asia Pacific area. This growth is supported by lucrative, fast-growing technological industries and the growing manufacturing market in these regions. Currently, Asia Pacific is the global leader in the chlor alkali market from the demand side. China and Japan have built an advantage of having most of the manufacturing and consumption market, thus providing the maximum contribution in the global chlor alkali market. And from the supplier side North America followed by Europe are the market leaders in the chlor alkali market.
The study of the global chlor alkali market by Infoholic Research provides the market size information and market trends along with the factors and parameters impacting it in both short and long term. The study ensures a 360° view, bringing out the complete key insights of the industry. These insights help the business decision makers to make better business plans and informed decisions for the future business. In addition, the study helps the venture capitalist in understanding the companies better and take informed decisions. Some of the key players in the chlor alkali market are Olin Corporation, Solvay S.A, Tata Chemicals, Akzo Nobel, Dow Chemicals, etc.
According to Infoholic Research, the global chlor alkali market is expected to grow at a CAGR of 6.8% during the forecast period to reach $124.6 billion by 2022. Glass Industry is expected to maintain global dominance in the chlor alkali consumption by value, driven by China and India. Asia Pacific is expected to contribute highest growth in global chlor alkali market. Some of the key players in chlor alkali are SABIC, DOW Chemicals, BASF etc.
Report Scope:
Applications
Caustic Soda
- Alumina
- Inorganic Chemicals
- Organic Chemicals
- Pulp & Paper
- Water Treatment
- Others (Textiles, Food Processing, etc.,)
Chlorine
- Organic Chemicals
- Vinyls
- Soaps & Detergents
- Pulp & Paper
- Water Treatment
- Others
Soda Ash
- Glass
- Soaps & Detergents
- Water Treatment
- Paper & Pulp
- Textile
- Others (Textiles, Food Processing, etc.,)
Regions
- Asia Pacific
- North America
- Europe
- Rest of the World
- Industry outlook: Market trends, drivers, restraints, and opportunities
1 Report Outline
1.1 Introduction
1.2 Market Definition
1.3 Research Methodology
1.3.1 Data Collation & In-house Estimation
1.3.2 Market Triangulation
1.3.3 Forecasting
1.4 Study Declaration
1.5 Report Assumptions
1.6 Stakeholders
2 Executive Summary
2.1 China Moving Towards Market Consolidation
2.2 Developing economies acquiring major market share in the chlor alkali market
3 Market Positioning
3.1 Total Addressable Market (TAM): Chlor Alkali
3.1.1 Market Overview
3.2 Segmented Addressable Market
3.2.1 Related Markets
4 Market Outlook
4.1 Overview
4.2 Value Chain Analysis
4.3 Chlor Alkali – Cost Analysis
4.4 PESTLE
4.5 Porter (Five) Forces
4.6 Patent Analysis
4.7 Market Characteristics
4.8 Market Segmentation
4.9 Market Dynamics
4.9.1 Drivers
4.9.1.1 Increasing investment in end-user industries
4.9.1.2 Increasing regional consumption
4.9.1.3 In
4.9.2 Restraints
4.9.2.1 Complex regulatory environment
4.9.2.2 Population and income growth in emerging countries
4.9.3 Opportunities
4.9.3.1 Economic opportunities, owing to the insulation and energy efficiency
4.9.3.2 Large untapped market in developing and underdeveloped countries
4.9.4 DRO – Impact Analysis
5 Chemicals: Market Size & Analysis
5.1 Overview
5.2 Caustic Soda
5.3 Chlorine
5.4 Soda Ash
5.5 Vendor Profiles
5.5.1 Shin-Etsu Chemical Co., Ltd.
5.5.2 Aditya Birla Chemicals
5.5.3 Saudi Basic Industries Corporation (SABIC)
5.5.4 DOW Chemicals
5.5.5 BASF SE
(Overview, business unit, geographic revenues, product profile, reecent developments, business focus, SWOT Analysis, and business strategies have been covered for all vendors)
6 Application: Market Size & Analysis
6.1 Overview
6.2 Paper & Pulp Industry
6.3 Soaps & Detergents
6.4 Chemicals (Organic & Inorganic)
6.5 Water Treatment
6.6 Alumina INDUSTRY
6.7 Glass Industry
6.8 Vinyl Industry
6.9 Customer Profile
6.9.1 Henkel AG & Co.,
6.9.2 General Electric
6.9.3 EcoLab
6.9.4 3M
6.9.5 Siemens AG
(Overview, business unit, geographic revenues, product profile, SWOT Analysis, and business strategies have been covered for all customers)
7 Regions: Market Size and Analysis
7.1 Overview
7.2 Asia Pacific
7.2.1 Asia Pacific Market, By Countries
7.2.2 Asia Pacific Market, By Chemical
7.2.3 Asia Pacific Market, By End-users
7.3 Europe
7.3.1 Europe Market, By Country
7.3.2 Europe Market, By Chemicals
7.3.3 Europe Market, By End-users
7.4 North America
7.4.1 North America Market, By Countries
7.4.2 North America Market, By Chemicals
7.4.3 North America Market, By End-users
7.5 Rest of the World
7.5.1 Rest OF the World Market, By Chemicals
7.5.2 Rest of the World Market, By End-users
8 Companies to Watch for
8.1 Solvay, Expansion of Epichlorohydrin plant in Thailand
8.1.1 Overview
8.2 Sabic Investment in The Middle East Africa and Asia Polymer & PVC Market
8.2.1 Overview
9 Competitive Landscape
9.1 Competitor Comparison Analysis
9.2 Market Landscape
9.2.1 Mergers, Acquisitions & Joint Ventures
9.2.2 Expansion
9.2.3 Exhibition & Product Launch
9.2.4 Divestment & Divestiture
10 Expert’s Views
Annexure
Acronyms
TABLE 1 GLOBAL CHLOR ALKALI MARKET VALUE BY CHEMICALLS, 2015−2022 ($MILLION)
TABLE 2 GLOBAL CHLOR ALKALI MARKET VOLUME BY MATERIAL, 2015−2022 (KILOTONS)
TABLE 3 GLOBAL CAUSTIC SODA MARKET VALUE, BY GEOGRAPHY, 2015−2022 ($MILLION)
TABLE 4 GLOBAL CAUSTIC SODA MARKET VOLUME , BY GEOGRAPHY 2015−2022 (KILOTONS)
TABLE 5 GLOBAL CHLORINE MARKET VALUE, , BY GEOGRAPHY, 2015−2022 ($MILLION)
TABLE 6 GLOBAL CHLORINE MARKET BY VOLUME, 2015−2022 (KILOTONS)
TABLE 7 GLOBAL SODA ASH MARKET VALUE, BY GEOGRAPHY, 2015−2022 ($MILLION)
TABLE 8 GLOBAL SODA ASH MARKET VOLUME , 2015−2022 (KILOTONS)
TABLE 9 SHIN-ETSU CHEMICAL CO., LTD.: PRODUCT PROFILE
TABLE 10 SHIN-ETSU CHEMICAL CO., LTD.: RECENT DEVELOPMENTS
TABLE 11 ADITYA BIRLA CHEMICALS: PRODUCT PROFILE
TABLE 12 ADITYA BIRLA CHEMICALS: RECENT DEVELOPMENTS
TABLE 13 SABIC: RECENT DEVELOPMENTS
TABLE 14 DOW CHEMICALS: PRODUCT PROFILE
TABLE 15 DOW CHEMICALS: RECENT DEVELOPMENTS
TABLE 16 BASF SE: PRODUCT PROFILE
TABLE 17 BASF SE: RECENT DEVELOPMENTS
TABLE 18 GLOBAL CHLOR ALKALI MARKET VALUE BY END-USERS, 2015−2022 ($MILLION)
TABLE 19 GLOBAL CHLOR ALKALI MARKET VOLUME, BY END-USER, 2015−2022 (KILOTONS)
TABLE 20 GLOBAL CHLOR ALKALI MARKET VALUE IN PAPER AND PULP, BY GEOGRAPHY, 2015−2022 ($MILLION)
TABLE 21 GLOBAL CHLOR ALKALI MARKET VOLUME IN PAPER AND PULP, BY GEOGRAPHY, 2015−2022 (KILOTONS)
TABLE 22 GLOBAL CHLOR ALKALI CHEMICALS MARKET VALUE IN SOAPS & DETERGENTS BY GEOGRAPHY, 2015−2022 ($MILLION)
TABLE 23 GLOBAL CHLOR ALKALI CHEMICALS MARKET VOLUME IN SOAPS & DETERGENTS BY GEOGRAPHY, 2015−2022 (KILOTONS)
TABLE 24 GLOBAL CHLOR ALKALI CHEMICALS MARKET VALUE IN CHEMICALS (ORGANIC & INORGANIC) BY GEOGRAPHY, 2015−2022 ($MILLION)
TABLE 25 GLOBAL CHLOR ALKALI CHEMICALS MARKET VALUE IN CHEMICALS (ORGANIC & INORGANIC) BY GEOGRAPHY, 2015−2022 (KILOTONS)
TABLE 26 GLOBAL CHLOR ALKALI CHEMICALS MARKET VALUE IN WATER TREATMENT BY GEOGRAPHY, 2015−2022 ($MILLION)
TABLE 27 GLOBAL CHLOR ALKALI CHEMICALS MARKET VOLUME IN WATER TREATMENT BY GEOGRAPHY, 2015−2022 (KILOTONS)
TABLE 28 GLOBAL CHLOR ALKALI CHEMICALS MARKET VALUE IN ALUMINA BY GEOGRAPHY, 2015−2022 ($MILLION)
TABLE 29 GLOBAL CHLOR ALKALI MARKET VOLUME IN ALUMINA BY GEOGRAPHY, 2015−2022 (KILOTONS)
TABLE 30 GLOBAL CHLOR ALKALI CHEMICALS MARKET VALUE IN GLASS INDUSTRY BY GEOGRAPHY, 2015−2022 ($MILLION)
TABLE 31 GLOBAL CHLOR ALKALI CHEMICALS MARKET VOLUME IN GLASS INDUSTRY BY GEOGRAPHY, 2015−2022 (KILOTONS)
TABLE 32 GLOBAL CHLOR ALKALI CHEMICALS MARKET VALUE IN VINYL BY GEOGRAPHY, 2015−2022 ($MILLION)
TABLE 33 GLOBAL CHLOR ALKALI CHEMICALS MARKET VOLUME IN VINYL BY GEOGRAPHY, 2015−2022 (KILOTONS)
TABLE 34 HENKEL AG & COMPANY: PRODUCT PROFILE
TABLE 35 HENKEL AG & COMPANY: RECENT DEVELOPMENTS
TABLE 36 GENERAL ELECTRIC: BUSINESS ACTIVITIES
TABLE 37 GENERAL ELECTRIC (GE): RECENT DEVELOPMENTS
TABLE 38 SIEMENS AG: BUSINESS UNITS (2012 AND 2013)
TABLE 39 SIEMENS AG: BUSINESS UNITS (2014–2016)
TABLE 40 SIEMENS AG: GEOGRAPHIC REVENUE
TABLE 41 SIEMENS AG: RECENT DEVELOPMENTS
TABLE 42 GLOBAL CHLOR ALKALI CHEMICALS MARKET VALUE BY GEOGRAPHY, 2015−2022 ($MILLION)
TABLE 43 GLOBAL CHLOR ALKALI CHEMICALS MARKET VOLUME BY GEOGRAPHY, 2015−2022 (KILOTONS)
TABLE 44 ASIA PACIFIC CHLOR ALKALI CHEMICALS MARKET VALUE BY COUNTRY, 2015−2022 ($MILLION)
TABLE 45 ASIA PACIFIC CHLOR ALKALI CHEMICALS MARKET VOLUME BY COUNTRY, 2015−2022 (KILOTONS)
TABLE 46 ASIA PACIFIC CHLOR ALKALI CHEMICALS MARKET VALUE BY CHEMICAL, 2015−2022 ($MILLION)
TABLE 47 ASIA PACIFIC CHLOR ALKALI CHEMICALS MARKET VOLUME BY CHEMICALS, 2015−2022 (KILOTONS)
TABLE 48 ASIA PACIFIC CHLOR ALKALI CHEMICALS MARKET VALUE BY END-USER, 2015−2022 ($MILLION)
TABLE 49 ASIA PACIFIC CHLOR ALKALI CHEMICALS MARKET VOLUME BY END-USERS, 2015−2022 (KILOTONS)
TABLE 50 EUROPE CHLOR ALKALI CHEMICALS MARKET VALUE BY COUNTRY, 2015−2022 ($MILLION)
TABLE 51 EUROPE CHKOR ALKALI CHEMICALS VOLUME BY COUNTRY, 2015−2022 (KILOTONS)
TABLE 52 EUROPE CHLOR ALKALI CHEMICALS MARKET VALUE BY CHEMICALS, 2015−2022 ($MILLION)
TABLE 53 EUROPE CHLOR ALKALI CHEMICALS MARKET VOLUME USING CHEMICALS, 2015−2022 (KILOTONS)
TABLE 54 EUROPE CHLOR ALKALI CHEMICALS MARKET VALUE BY END-USERS, 2015−2022 ($MILLION)
TABLE 55 EUROPE CHLOR ALKALI CHEMICALS MARKET VOLUME BY END-USERS, 2015−2022 (KILOTONS)
TABLE 56 NORTH AMERICA CHLOR ALKALI CHEMICALS MARKET VALUE BY COUNTRY, 2015−2022 ($MILLION)
TABLE 57 NORTH AMERICA CHLOR ALKALI CHEMICALS MARKET VOLUME BY COUNTRY, 2015−2022 (KILOTONS)
TABLE 58 NORTH AMERICA CHLOR ALKALI CHEMICALS MARKET VALUE BY CHEMICALS, 2015−2022 ($MILLION)
TABLE 59 NORTH AMERICA CHLOR ALKALI CHEMICALS MARKET VOLUME USING CHEMICALS, 2015−2022 (KILOTONS)
TABLE 60 NORTH AMERICA CHLOR ALKALI CHEMICALS MARKET VALUE BY END-USERS, 2015−2022 ($MILLION)
TABLE 61 NORTH AMERICA CHLOR ALKALI CHEMICALS MARKET VOLUME BY END-USER, 2015−2022 (KILOTONS)
TABLE 62 REST OF THE WORLD CHLOR ALKALI CHEMICALS MARKET VALUE BY GEOGRAPHY, 2015−2022 ($MILLION)
TABLE 63 REST OF THE WORLD CHLOR ALKALI CHEMICALS MARKET VOLUME BY GEOGRAPHY, 2015−2022 (KILOTONS)
TABLE 64 REST OF THE WORLD CHLOR ALKALI CHEMICALS MARKET VALUE BY CHEMICALS, 2015−2022 ($MILLION)
TABLE 65 ROW CHLOR ALKALI CHEMICALS MARKET VOLUME USING CHEMICALS, 2015−2022 (KILOTONS)
TABLE 66 REST OF THE WORLD CHLOR ALKALI CHEMICALS MARKET VALUE BY END-USERS, 2015−2022 ($MILLION)
TABLE 67 REST OF THE WORLD CHLOR ALKALI CHEMICALS MARKET VOLUME END-USERS, 2015−2022 (KILOTONS)
TABLE 68 MERGERS, ACQUISITIONS, & JOINT VENTURES, 2013–2017
TABLE 69 EXPANSION, 2013–2016
TABLE 70 EXHIBITION & PRODUCT LAUNCH
TABLE 71 DIVESTMENT & DIVESTITURE, 2016
Research Framework
Infoholic Research works on a holistic 360° approach in order to deliver high quality, validated and reliable information in our market reports. The Market estimation and forecasting involves following steps:
- Data Collation (Primary & Secondary)
- In-house Estimation (Based on proprietary data bases and Models)
- Market Triangulation
- Forecasting

Market related information is congregated from both primary and secondary sources.
Primary sources
Involved participants from all global stakeholders such as Solution providers, service providers, Industry associations, thought leaders etc. across levels such as CXOs, VPs and managers. Plus, our in-house industry experts having decades of industry experience contribute their consulting and advisory services.
Secondary sources
Include public sources such as regulatory frameworks, government IT spending, government demographic indicators, industry association statistics, and company publications along with paid sources such as Factiva, OneSource, Bloomberg among others.
![]()
