
Food Colorants Market By Type (Synthetic and Natural) By Applications (Dairy Food, Non-Dairy Food, Non-Alcoholic Beverages, Alcoholic-Beverages) and By Geography – Global Driver, Restraints, Opportunities, Trends, and Forecast to 2023
- February, 2019
- Domain: Chemicals, Materials & Food - Agro, Pharma, Food & Personal Care
- Get Free 10% Customization in this Report
[95 Report Pages] The growing demand for clean labels is fostering the Global Food Colorants Market growth. The companies are indulged in R&D activities to innovate and develop new products, which can open new paths of applications.
Research Methodology
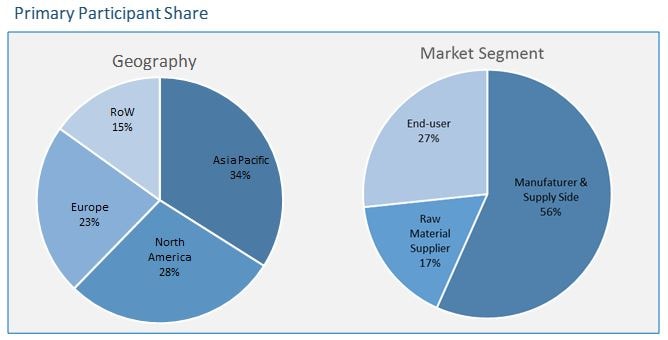
The food colorants market has been analyzed by utilizing the optimum combination of secondary sources and in-house methodology along with an irreplaceable blend of primary insights. The real-time assessment of the market is an integral part of our market sizing and forecasting methodology. Our industry experts and panel of primary participants have helped in compiling relevant aspects with realistic parametric estimations for a comprehensive study. The participation share of different categories of primary participants is given below:
Food Colorants Market Key Market Insights
The growing economies and increasing per capita income along with technological innovations to bring down the prices are making natural colorants more affordable & efficient. The increasing health awareness all over the regions, especially in developed economies, in combination with growing demand for beverages will foster the global food colorants market growth. The increased efforts in R&D are helping the major players to explore new areas of innovations for food colorant and its applications, providing additional growth opportunities to the market.
Increasing demand for beverages such as energy drinks, sports drinks, and mocktails among others is pacing the food colorants market toward growth. Asia Pacific is dominant in the food colorants market during the forecast period, followed by North America, Europe, and RoW. Food colorants are utilized to add color to food and beverages. Changing and busy lifestyle is making people to dine out more often and try new food & beverages. The added color makes food and beverages more luring to the customers. The growing trend of aesthetics will positively impact the market and contribute to its growth. The companies involved in the manufacturing of food colorants are actively participating in R&D activities to increase their product portfolio along with innovations. They are also focusing on improving the value chain and supply chain to survive and maintain their position in the competitive market.
Few of the prominent companies operating in the food colorants market include BASF, Cargill, Koninklijke DSM N.V., Neelikon, and Merck. Few of the major customers include Tyson Group, Kerry Foods, Ingredion, PepsiCo, and AB InBev.
Food Colorants Market by Types
- Synthetic
- Natural
Food Colorants Market by Applications
- Dairy Food
- Non-dairy Food
- Non-alcoholic Beverages
- Alcoholic Beverages
Food Colorants Market by Geography
- Asia Pacific
- North America
- Europe
- Rest of the World
1 Executive Summary
1.1 Asia Pacific has the Highest Dominance in the Food Colorants Market
1.2 Non-Alcoholic Beverages Dominates the Market
2 Market Positioning
2.1 Industry Snapshot
2.1.1 Industry Overview
2.1.2 Key Trends
2.2 Related Markets
3 Market Outlook
3.1 Introduction
3.2 Value Chain Analysis
3.3 Market Segmentation
4 Market Characteristics
4.1 PESTLE Analysis
4.2 Porter’s Five Force Analysis
4.3 Market Dynamics
4.3.1 Drivers
4.3.1.1 Increasing end-user activities in emerging economies
4.3.1.2 Increased demand from Asia Pacific
4.3.2 Restraints
4.3.2.1 Changing geopolitical structure of various countries can affect the market
4.3.2.2 Fluctuations in raw material prices
4.3.3 Opportunities
4.3.3.1 Growing investment in end-use sectors in Asia Pacific
4.3.3.2 Large untapped market in developing & underdeveloped countries
4.3.4 DRO – Impact Analysis
4.4 Patent Analysis
5 Food Colorants Market, By Type
5.1 Overview
5.2 Synthetic
5.3 Natural
6 Food Colorants Market, By Applications
6.1 Overview
6.2 Dairy Food
6.3 Non-Dairy Food
6.4 Non-Alcoholic Beverages
6.5 Alcoholic Beverages
7 Food Colorants Market, By Geography
7.1 Overview
7.2 Asia Pacific
7.3 North America
7.4 Europe
7.5 Rest of the World
(Market segmentation by geography, by type, and by applications have been covered for all regions)
8 Competitive Landscape
8.1 Competitive Regional Exposure Analysis
8.2 Market Developments
8.2.1 Mergers & Acquisitions (M&A)
8.2.2 Expansions & Exhibitions
8.2.3 Product Launches
9 Vendors Profile
9.1 BASF
9.2 Koninklijke DSM N.V.
9.3 Cargill
9.4 Neelikon
9.5 Merck KGaA
(Overview, product profile, business units, geographic revenue, recent developments, business focus, business strategies have been covered for all the vendors)
10 Customers Profile
10.1 Tyson Group
10.2 Kerry Group
10.3 Ingredion
10.4 PepsiCo
10.5 ABInbev
(Overview, product profile, SWOT analysis, and business strategies have been covered for all the customers)
11 Companies to Watch for
11.1 Clariant
12 Annexure
12.1 Report Scope
12.2 Market Definition
12.3 Research Methodology
12.3.1 Data Collation & In-house Estimation
12.3.2 Market Triangulation
12.3.3 Forecasting
12.4 Study Declarations
12.5 Report Assumptions
12.6 Stakeholders
12.7 Abbreviations
TABLE 1 GLOBAL FOOD COLORANTS MARKET VALUE, BY TYPE, 2016–2023 ($MILLION)
TABLE 2 GLOBAL FOOD COLORANTS MARKET VOLUME, BY TYPE, 2016–2023 (KILOTONS)
TABLE 3 GLOBAL SYNTHETIC COLORANTS MARKET VALUE, BY GEOGRAPHY, 2016–2023 ($MILLION)
TABLE 4 GLOBAL SYNTHETIC COLORANTS MARKET VOLUME, BY GEOGRAPHY, 2016–2023 (KILOTONS)
TABLE 5 GLOBAL NATURAL COLORANTS MARKET VALUE, BY GEOGRAPHY, 2016–2023 ($MILLION)
TABLE 6 GLOBAL NATURAL COLORANTS MARKET VOLUME, BY GEOGRAPHY, 2016–2023 (KILOTONS)
TABLE 7 GLOBAL FOOD COLORANTS MARKET VALUE, BY APPLICATIONS, 2016–2023 ($MILLION)
TABLE 8 GLOBAL FOOD COLORANTS MARKET VOLUME, BY APPLICATIONS, 2016–2023 (KILOTONS)
TABLE 9 GLOBAL FOOD COLROANTS IN DAIRY FOOD MARKET VALUE, BY GEOGRAPHY, 2016–2023 ($MILLION)
TABLE 10 GLOBAL FOOD COLORANTS IN DAIRY FOOD MARKET VOLUME, BY GEOGRAPHY, 2016–2023 (KILOTONS)
TABLE 11 GLOBAL FOOD COLORANTS MARKET IN NON-DAIRY FOOD MARKET VALUE, BY GEOGRAPHY, 2016–2023 ($MILLION)
TABLE 12 GLOBAL FOOD COLORANTS MARKET IN NON-DAIRY FOOD MARKET VOLUME, BY GEOGRAPHY, 2016–2023 (KILOTONS)
TABLE 13 GLOBAL FOOD COLORANTS IN NON-ALCOHOLIC MARKET VALUE, BY GEOGRAPHY, 2016–2023 ($MILLION)
TABLE 14 GLOBAL FOOD COLORANTS IN NON-ALCOHOLIC BEVERAGES MARKET VOLUME, BY GEOGRAPHY, 2016–2023 (KILOTONS)
TABLE 15 GLOBAL FOOD COLORANTS IN ALCOHOLIC BEVERAGES MARKET VALUE, BY GEOGRAPHY, 2016–2023 ($MILLION)
TABLE 16 GLOBAL FOOD COLORANTS IN ALCOHOLIC BEVERAGES MARKET VOLUME, BY GEOGRAPHY, 2016–2023 (KILOTONS)
TABLE 17 GLOBAL FOOD COLROANTS MARKET VALUE, BY GEOGRAPHY, 2016–2023 ($MILLION)
TABLE 18 GLOBAL FOOD COLORANTS MARKET VOLUME, BY GEOGRAPHY, 2016–2023 (KILOTONS)
TABLE 19 ASIA PACIFIC FOOD COLROANTS MARKET VALUE, BY GEOGRAPHY, 2016–2023 ($MILLION)
TABLE 20 ASIA PACIFIC FOOD COLORANTS MARKET VOLUME, BY GEOGRAPHY, 2016–2023 (KILOTONS)
TABLE 21 ASIA PACIFIC FOOD COLORANTS MARKET VALUE, BY TYPE, 2016–2023 ($MILLION)
TABLE 22 ASIA PACIFIC FOOD COLORANTS MARKET VOLUME, BY TYPE, 2016–2023 (KILOTONS)
TABLE 23 ASIA PACIFIC FOOD COLORANTS MARKET VALUE, BY APPLICATIONS, 2016–2023 ($MILLION)
TABLE 24 ASIA PACIFIC FOOD COLROANTS MARKET VOLUME, BY APPLICATION, 2016–2023 (KILOTONS)
TABLE 25 NORTH AMERICA FOOD COLORANTS MARKET VALUE, BY GEOGRAPHY, 2016–2023 ($MILLION)
TABLE 26 NORTH AMERICA FOOD COLORANTS MARKET VOLUME, BY GEOGRAPHY, 2016–2023 (KILOTONS)
TABLE 27 NORTH AMERICA FOOD COLORANTS MARKET VALUE, BY TYPE, 2016–2023 ($MILLION)
TABLE 28 NORTH AMERICA FOOD COLORANTS MARKET VOLUME, BY TYPE, 2016–2023 (KILOTONS)
TABLE 29 NORTH AMERICA FOOD COLROANTS MARKET VALUE, BY APPLICATIONS, 2016–2023 ($MILLION)
TABLE 30 NORTH AMERICA FOOD COLORANTS MARKET VOLUME, BY APPLICATIONS, 2016–2023 (KILOTONS)
TABLE 31 EUROPE FOOD COLORANTS MARKET VALUE, BY GEOGRAPHY, 2016–2023 ($MILLION)
TABLE 32 EUROPE FOOD COLORANTS MARKET VOLUME, BY GEOGRAPHY, 2016–2023 (KILOTONS)
TABLE 33 EUROPE FOOD COLORANTS MARKET VALUE, BY TYPE, 2016–2023 ($MILLION)
TABLE 34 EUROPE FOOD COLORNATS MARKET VOLUME, BY TYPE, 2016–2023 (KILOTONS)
TABLE 35 EUROPE FOOD COLORANTS MARKET VALUE, BY END-USER, 2016–2023 ($MILLION)
TABLE 36 EUROPE FOOD COLORANTS MARKET VOLUME, BY APPLICATIONS, 2016–2023 (KILOTONS)
TABLE 37 REST OF THE WORLD FOOD COLORANTS MARKET VALUE, BY GEOGRAPHY, 2016–2023 ($MILLION)
TABLE 38 REST OF THE WORLD FOOD COLORANTS MARKET VOLUME, BY GEOGRAPHY, 2016–2023 (KILOTONS)
TABLE 39 REST OF THE WORLD FOOD COLORANTS MARKET VALUE, BY TYPE, 2016–2023 ($MILLION)
TABLE 40 REST OF THE WORLD FOOD COLORANTS MARKET VOLUME, BY TYPE, 2016–2023 (KILOTONS)
TABLE 41 REST OF THE WORLD FOOD COLORANTS MARKET VALUE, BY END-USER, 2016–2023 ($MILLION)
TABLE 42 REST OF THE WORLD FOOD COLORANTS MARKET VOLUME, BY APPLICATIONS, 2016–2023 (KILOTONS)
TABLE 43 MERGERS & ACQUISITIONS, 2013–2017
TABLE 44 EXPANSIONS, 2013–2017
TABLE 45 PRODUCT LAUNCHES, 2013–2017
TABLE 46 BASF: PRODUCT PROFILE
TABLE 47 BASF: RECENT DEVELOPEMENTS
TABLE 48 KONINKLIJKE DSM N.V.: PRODUCT PROFILE
TABLE 49 KONINKLIJKE DSM N.V.: RECENT DEVELOPEMNETS
TABLE 50 CLARGILL: PRODUCT PROFILE
TABLE 51 CARGILL: RECENT DEVELOPEMENTS
TABLE 52 DOWDUPONT: PRODUCT PROFILE
TABLE 53 DOWDUPONT: RECENT DEVELOPMENTS
TABLE 54 MERCK: PRODUCT PROFILE
TABLE 55 MERCK: RECENT DEVELOPMENTS
TABLE 56 TYSON GROUP: PRODUCT PROFILE
TABLE 57 KERRY GROUP: PRODUCT PROFILE
TABLE 58 INGREDION: PRODUCT PROFILE
TABLE 59 PEPSICO: PRODUCT CATEGORY
TABLE 60 ABINBEV: PRODUCT PROFILE
Research Framework
Infoholic Research works on a holistic 360° approach in order to deliver high quality, validated and reliable information in our market reports. The Market estimation and forecasting involves following steps:
- Data Collation (Primary & Secondary)
- In-house Estimation (Based on proprietary data bases and Models)
- Market Triangulation
- Forecasting

Market related information is congregated from both primary and secondary sources.
Primary sources
Involved participants from all global stakeholders such as Solution providers, service providers, Industry associations, thought leaders etc. across levels such as CXOs, VPs and managers. Plus, our in-house industry experts having decades of industry experience contribute their consulting and advisory services.
Secondary sources
Include public sources such as regulatory frameworks, government IT spending, government demographic indicators, industry association statistics, and company publications along with paid sources such as Factiva, OneSource, Bloomberg among others.
![]()


