
Flow Cytometry Market based on Technology (Cell-based Flow Cytometry and Bead-based Flow Cytometry), Product and Service (Reagents and Consumables, Instruments, Services, Software, and Accessories), Application, End-User, and Geography – Global Forecast up to 2026
- April, 2021
- Domain: Healthcare - Biotechnology
- Get Free 10% Customization in this Report
Flow cytometry, a biophysical and laser-based analytical technology, procedures and analyzes various physical features of cells or particles deferred in a fluid when passed over a laser beam. It has numerous advantages when compared to traditional analytical methods like ELISA, which contains its capability to bring precise and accurate results and lesser time consumption at about the same prices. The flow cytometry technology is broadly used in academic and clinical research and diagnosis of diseases like cancer, HIV, and hematological malignancies. The growing count of patients grief from HIV and cancer and the growing use of flow cytometry in hospitals and diagnostic centers have formed an impending need for flow cytometry in the effective diagnosis and monitoring of diseases. The terms flow cytometry, as well as fluorescence-activated cell sorting, are often interchangeable. The Flow Cytometry Market is expected to grow at the rate of 8.7% CAGR by 2026.
Research Methodology:
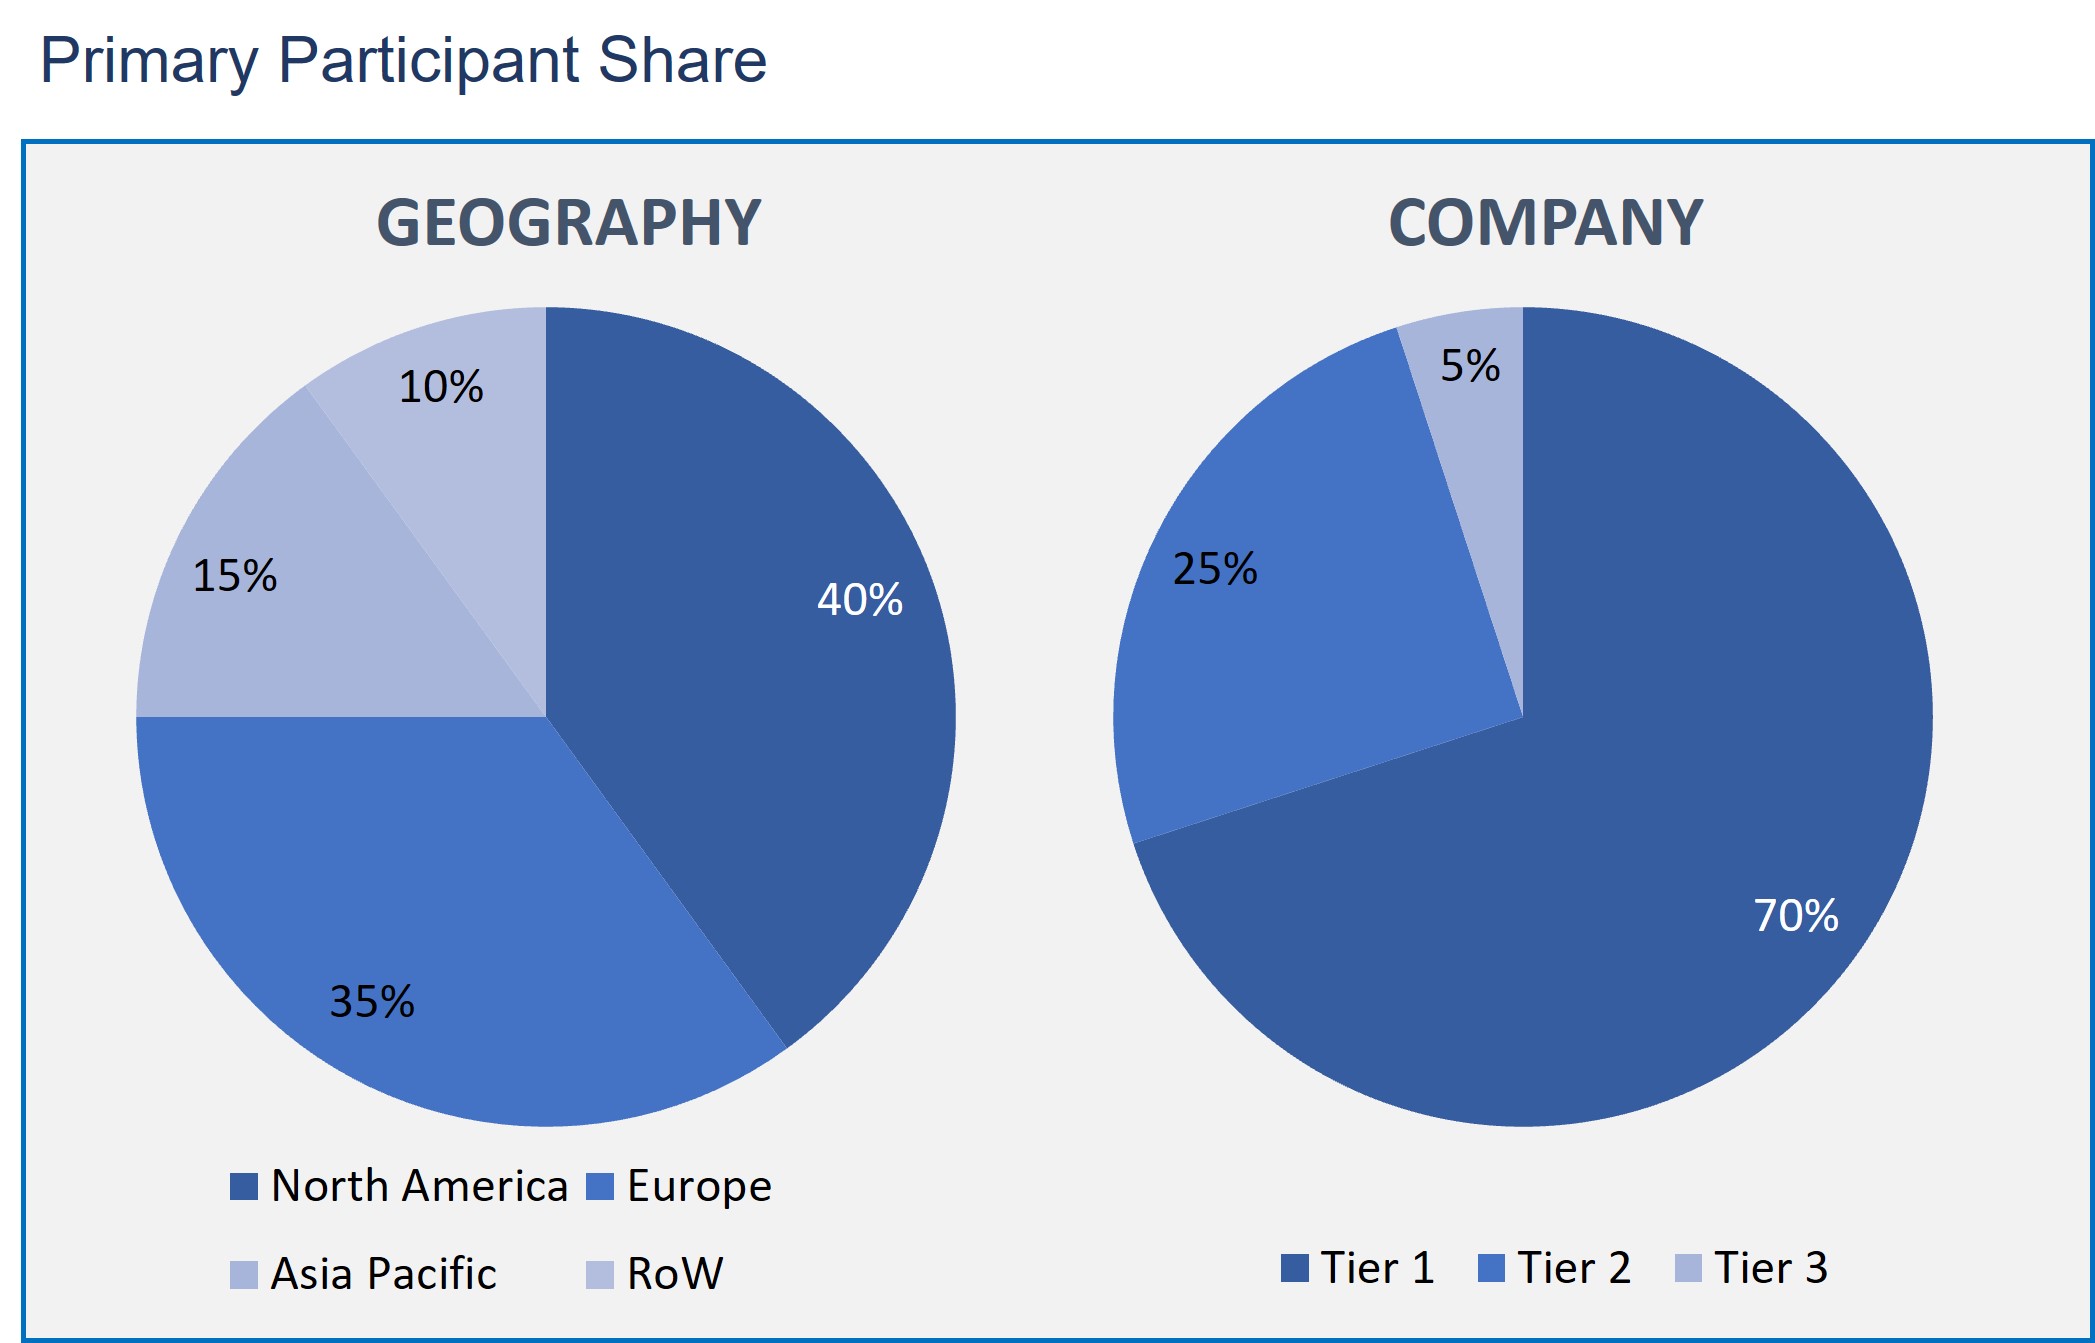
The Flow cytometry Market has been analyzed by utilizing the optimum combination of secondary sources and in-house methodology and a unique balance of primary insights. The real-time valuation of the market is an integral part of our forecasting and market sizing methodology. Industry experts and our primary participants have helped to compile related aspects with accurate parametric estimations for a complete study. The primary participants share is given below:
Flow Cytometry Market based on Technology
- Cell-based Flow Cytometry
- Bead-based Flow Cytometry
Flow Cytometry Market based on Product and Service
- Reagents & Consumables
- Instruments
- Services
- Software
- Accessories
Flow Cytometry Market based on Application
- Research Applications
- Clinical Applications
- Industrial Applications
Flow Cytometry Market based on End-User
- Academic & Research Institutes
- Hospitals & Clinical Testing Laboratories
- Pharmaceutical & Biotechnology Companies
- Commercial organizations
Flow Cytometry Market based on Geography
- North America
- Europe
- Asia Pacific
- Rest of the World
By technology, the market is bifurcated into cell-based and bead-based flow cytometry. The bead-based flow cytometry segment is anticipated to raise at the highest CAGR during the forecast period, due to the procedural advantages offered by this technology over other cell-based technology, with its capacity to detect multiple analytes, stability, high reproducibility, and speed.
The market is considered into instruments, services, software, reagents & consumables, and accessories based on product and service. The reagents & consumables segment is anticipated to dominate the market. Factors like the development and commercialization of high-quality application-specific reagents and assays and the continuous requirement of flow cytometry reagents by end-users are expected to drive the reagents and consumables market in the coming years.
By Geography, this market is divided into North America, Europe, the Asia Pacific, Latin America, and the Middle East and Africa. In 2019, the global market was anticipated to be subject to North America, followed by Europe. However, the Asia Pacific is anticipated to witness the fastest development during the estimated period due to the participation of China, India, Japan, Australia, and South Korea in flow cytometry-based research; expansion of research infrastructure; and growing public-private initiative aimed towards improving advance research practices in this region.
This report covers the profiles of companies that are leading the Flow Cytometry market: Becton, Dickinson and Company, Beckman Coulter, Inc, Thermo Fisher Scientific, Inc, Merck KGaA, Sysmex Partec GmbH, Luminex Corporation, Miltenyi Biotec GmbH, Bio-Rad Laboratories, Inc, Sony Biotechnology, Inc, Agilent Technologies, Inc, bioMérieux S.A, Enzo Life Sciences, Inc, Stratedigm, Inc., Cytonome/ST LLC, Cytek Biosciences, and Apogee Flow Systems Ltd.
- This report offers an overall analysis of the Flow Cytometry market growth drivers, restraints, opportunities, and other related challenges.
- This report depicts the market developments such as new product launches, mergers and acquisitions, diversification, and joint ventures of the market players.
- This report also describes all potential segments and sub-segments present in the market to help the companies in strategic business planning.
- This report also gives the regional analysis of the Flow Cytometry market in terms of market penetration across the world.
- Executive Summary
- Industry Outlook
- Industry Overview
- Industry Trends
- Market Snapshot
- Market Definition
- Market Outlook
- Porter Five Forces
- Related Markets
- Market characteristics
- Market Overview
- Market Segmentation
- Market Dynamics
- Drivers
- Restraints
- Opportunities
- DRO - Impact Analysis
- Technology: Market Size & Analysis
- Overview
- Cell-based Flow Cytometry
- Bead-based Flow Cytometry
- PRODUCT & SERVICE: Market Size & Analysis
- Overview
- Reagents & Consumables
- Instruments
- Services
- Software
- Accessories
- Application: Market Size & Analysis
- Overview
- Research Applications
- Clinical Applications
- Industrial Applications
- END-USER: Market Size & Analysis
- Overview
- Academic & Research Institutes
- Hospitals & Clinical Testing Laboratories
- Pharmaceutical & Biotechnology Companies
- Commercial organizations
- Geography: Market Size & Analysis
- Overview
- North America
- Europe
- Asia Pacific
- Rest of the World
- Competitive Landscape
- Competitor Comparison Analysis
- Market Developments
- Mergers and Acquisitions, Legal, Awards, Partnerships
- Product Launches and execution
- Vendor Profiles
- Beckman Coulter, Inc.
- Overview
- Financial Overview
- Product END-USERs
- Developments
- Business Strategy
- Bio-Rad Laboratories, Inc.
- Overview
- Financial Overview
- Product END-USERs
- Developments
- Business Strategy
- Becton, Dickinson and Company
- Overview
- Financial Overview
- Product END-USERs
- Developments
- Business Strategy
- Thermo Fisher Scientific, Inc.
- Overview
- Financial Overview
- Product END-USERs
- Developments
- Business Strategy
- Agilent Technologies, Inc.
- Overview
- Financial Overview
- Product END-USERs
- Developments
- Business Strategy
- Sysmex Partec GmbH
- Overview
- Financial Overview
- Product END-USERs
- Developments
- Business Strategy
- Luminex Corporation
- Overview
- Financial Overview
- Product END-USERs
- Developments
- Business Strategy
- Miltenyi Biotec GmbH
- Overview
- Financial Overview
- Product END-USERs
- Developments
- Business Strategy
- Merck KGaA
- Overview
- Financial Overview
- Product END-USERs
- Developments
- Business Strategy
- Sony Biotechnology and Inc.
- Overview
- Financial Overview
- Product END-USERs
- Developments
- Business Strategy
- Beckman Coulter, Inc.
- Companies to Watch
- BioMérieux S.A.
- Overview
- Products & Services
- Business Strategy
- BioMérieux S.A.
- Analyst Opinion
- Annexure
- Report Scope
- Market Definitions
- Research Methodology
- Data Collation and In-house Estimation
- Market Triangulation
- Forecasting
- Report Assumptions
- Declarations
- Stakeholders
- Abbreviations
TABLE 1. GLOBAL FLOW CYTOMETRY MARKET VALUE, BY TECHNOLOGY, 2020-2026 (USD BILLION)
TABLE 2. GLOBAL FLOW CYTOMETRY MARKET VALUE FOR CELL-BASED FLOW CYTOMETRY, BY GEOGRAPHY, 2020-2026 (USD BILLION)
TABLE 3. GLOBAL FLOW CYTOMETRY MARKET VALUE FOR BEAD-BASED FLOW CYTOMETRY, BY TYPE, 2020-2026 (USD BILLION)
TABLE 4. GLOBAL FLOW CYTOMETRY MARKET VALUE, BY PRODUCT & SERVICE, 2020-2026 (USD BILLION)
TABLE 5. GLOBAL FLOW CYTOMETRY MARKET VALUE FOR REAGENTS & CONSUMABLES, BY GEOGRAPHY, 2020-2026 (USD BILLION)
TABLE 6. GLOBAL FLOW CYTOMETRY MARKET VALUE FOR INSTRUMENTS, BY GEOGRAPHY, 2020-2026 (USD BILLION)
TABLE 7. GLOBAL FLOW CYTOMETRY MARKET VALUE FOR SERVICES, BY GEOGRAPHY, 2020-2026 (USD BILLION)
TABLE 8. GLOBAL FLOW CYTOMETRY MARKET VALUE FOR SOFTWARE, BY GEOGRAPHY, 2020-2026 (USD BILLION)
TABLE 9. GLOBAL FLOW CYTOMETRY MARKET VALUE FOR ACCESSORIES, BY GEOGRAPHY, 2020-2026 (USD BILLION)
TABLE 10. GLOBAL FLOW CYTOMETRY MARKET VALUE, BY APPLICATION, 2020-2026 (USD BILLION)
TABLE 11. GLOBAL FLOW CYTOMETRY MARKET VALUE FOR RESEARCH APPLICATIONS, 2020-2026 (USD BILLION)
TABLE 12. GLOBAL FLOW CYTOMETRY MARKET VALUE FOR CLINICAL APPLICATIONS, BY GEOGRAPHY, 2020-2026 (USD BILLION)
TABLE 13. GLOBAL FLOW CYTOMETRY MARKET VALUE FOR INDUSTRIAL APPLICATIONS, BY GEOGRAPHY, 2020-2026 (USD BILLION)
TABLE 14. GLOBAL FLOW CYTOMETRY MARKET VALUE, END-USER, 2020-2026 (USD BILLION)
TABLE 15. GLOBAL FLOW CYTOMETRY MARKET VALUE FOR ACADEMIC & RESEARCH INSTITUTES, BY GEOGRAPHY, 2020-2026 (USD BILLION)
TABLE 16. GLOBAL FLOW CYTOMETRY MARKET VALUE FOR HOSPITALS & CLINICAL TESTING LABORATORIES, BY GEOGRAPHY, 2020-2026 (USD BILLION)
TABLE 17. GLOBAL FLOW CYTOMETRY MARKET VALUE FOR PHARMACEUTICAL & BIOTECHNOLOGY COMPANIES, BY GEOGRAPHY, 2020-2026 (USD BILLION)
TABLE 18. GLOBAL FLOW CYTOMETRY MARKET VALUE FOR COMMERCIAL ORGANIZATIONS, BY GEOGRAPHY, 2020-2026 (USD BILLION)
TABLE 19. NORTH AMERICA FLOW CYTOMETRY MARKET VALUE, BY COUNTRY, 2020-2026 (USD BILLION)
TABLE 20. NORTH AMERICA FLOW CYTOMETRY MARKET VALUE, BY TECHNOLOGY, 2020-2026 (USD BILLION)
TABLE 21. NORTH AMERICA FLOW CYTOMETRY MARKET VALUE, BY PRODUCT & SERVICE, 2020-2026 (USD BILLION)
TABLE 22. NORTH AMERICA FLOW CYTOMETRY MARKET VALUE, BY APPLICATION, 2020-2026 (USD BILLION)
TABLE 23. NORTH AMERICA FLOW CYTOMETRY MARKET VALUE, BY END-USER, 2020-2026 (USD BILLION)
TABLE 24. U.S FLOW CYTOMETRY MARKET VALUE, BY TECHNOLOGY, 2020-2026 (USD BILLION)
TABLE 25. U.S FLOW CYTOMETRY MARKET VALUE, BY PRODUCT & SERVICE, 2020-2026 (USD BILLION)
TABLE 26. U.S FLOW CYTOMETRY MARKET VALUE, BY APPLICATION, 2020-2026 (USD BILLION)
TABLE 27. U.S FLOW CYTOMETRY MARKET VALUE, BY END-USER, 2020-2026 (USD BILLION)
TABLE 28. CANADA FLOW CYTOMETRY MARKET VALUE, BY TECHNOLOGY, 2020-2026 (USD BILLION)
TABLE 29. CANADA FLOW CYTOMETRY MARKET VALUE, BY PRODUCT & SERVICE, 2020-2026 (USD BILLION)
TABLE 30. CANADA FLOW CYTOMETRY MARKET VALUE, BY APPLICATION, 2020-2026 (USD BILLION)
TABLE 31. CANADA FLOW CYTOMETRY MARKET VALUE, BY END-USER, 2020-2026 (USD BILLION)
TABLE 32. EUROPE FLOW CYTOMETRY MARKET VALUE, BY COUNTRY, 2020-2026 (USD BILLION)
TABLE 33. EUROPE FLOW CYTOMETRY MARKET VALUE, BY TECHNOLOGY, 2020-2026 (USD BILLION)
TABLE 34. EUROPE FLOW CYTOMETRY MARKET VALUE, BY PRODUCT & SERVICE, 2020-2026 (USD BILLION)
TABLE 35. EUROPE FLOW CYTOMETRY MARKET VALUE, BY APPLICATION, 2020-2026 (USD BILLION)
TABLE 36. EUROPE FLOW CYTOMETRY MARKET VALUE, BY END-USER, 2020-2026 (USD BILLION)
TABLE 37. GERMANY FLOW CYTOMETRY MARKET VALUE, BY TECHNOLOGY, 2020-2026 (USD BILLION)
TABLE 38. GERMANY FLOW CYTOMETRY MARKET VALUE, BY PRODUCT & SERVICE, 2020-2026 (USD BILLION)
TABLE 39. GERMANY FLOW CYTOMETRY MARKET VALUE, BY APPLICATION, 2020-2026 (USD BILLION)
TABLE 40. GERMANY FLOW CYTOMETRY MARKET VALUE, BY END-USER, 2020-2026 (USD BILLION)
TABLE 41. U.K FLOW CYTOMETRY MARKET VALUE, BY TECHNOLOGY, 2020-2026 (USD BILLION)
TABLE 42. U.K FLOW CYTOMETRY MARKET VALUE, BY PRODUCT & SERVICE, 2020-2026 (USD BILLION)
TABLE 43. U.K FLOW CYTOMETRY MARKET VALUE, BY APPLICATION, 2020-2026 (USD BILLION)
TABLE 44. U.K FLOW CYTOMETRY MARKET VALUE, BY END-USER, 2020-2026 (USD BILLION)
TABLE 45. FRANCE FLOW CYTOMETRY MARKET VALUE, BY TECHNOLOGY, 2020-2026 (USD BILLION)
TABLE 46. FRANCE FLOW CYTOMETRY MARKET VALUE, BY PRODUCT & SERVICE, 2020-2026 (USD BILLION)
TABLE 47. FRANCE FLOW CYTOMETRY MARKET VALUE, BY APPLICATION, 2020-2026 (USD BILLION)
TABLE 48. FRANCE FLOW CYTOMETRY MARKET VALUE, BY END-USER, 2020-2026 (USD BILLION)
TABLE 49. ITALY FLOW CYTOMETRY MARKET VALUE, BY TECHNOLOGY, 2020-2026 (USD BILLION)
TABLE 50. ITALY FLOW CYTOMETRY MARKET VALUE, BY PRODUCT & SERVICE, 2020-2026 (USD BILLION)
TABLE 51. ITALY FLOW CYTOMETRY MARKET VALUE, BY APPLICATION, 2020-2026 (USD BILLION)
TABLE 52. ITALY FLOW CYTOMETRY MARKET VALUE, BY END-USER, 2020-2026 (USD BILLION)
TABLE 53. SPAIN FLOW CYTOMETRY MARKET VALUE, BY TECHNOLOGY, 2020-2026 (USD BILLION)
TABLE 54. SPAIN FLOW CYTOMETRY MARKET VALUE, BY PRODUCT & SERVICE, 2020-2026 (USD BILLION)
TABLE 55. SPAIN FLOW CYTOMETRY MARKET VALUE, BY APPLICATION, 2020-2026 (USD BILLION)
TABLE 56. SPAIN FLOW CYTOMETRY MARKET VALUE, BY END-USER, 2020-2026 (USD BILLION)
TABLE 57. ROE FLOW CYTOMETRY MARKET VALUE, BY TECHNOLOGY, 2020-2026 (USD BILLION)
TABLE 58. ROE FLOW CYTOMETRY MARKET VALUE, BY PRODUCT & SERVICE, 2020-2026 (USD BILLION)
TABLE 59. ROE FLOW CYTOMETRY MARKET VALUE, BY APPLICATION, 2020-2026 (USD BILLION)
TABLE 60. ROE FLOW CYTOMETRY MARKET VALUE, BY END-USER, 2020-2026 (USD BILLION)
TABLE 61. ASIA PACIFIC FLOW CYTOMETRY MARKET VALUE, BY COUNTRY, 2020-2026 (USD BILLION)
TABLE 62. ASIA PACIFIC FLOW CYTOMETRY MARKET VALUE, BY TECHNOLOGY, 2020-2026 (USD BILLION)
TABLE 63. ASIA PACIFIC FLOW CYTOMETRY MARKET VALUE, BY PRODUCT & SERVICE, 2020-2026 (USD BILLION)
TABLE 64. ASIA PACIFIC FLOW CYTOMETRY MARKET VALUE, BY APPLICATION, 2020-2026 (USD BILLION)
TABLE 65. ASIA PACIFIC FLOW CYTOMETRY MARKET VALUE, BY END-USER, 2020-2026 (USD BILLION)
TABLE 66. CHINA FLOW CYTOMETRY MARKET VALUE, BY TECHNOLOGY, 2020-2026 (USD BILLION)
TABLE 67. CHINA FLOW CYTOMETRY MARKET VALUE, BY PRODUCT & SERVICE, 2020-2026 (USD BILLION)
TABLE 68. CHINA FLOW CYTOMETRY MARKET VALUE, BY APPLICATION, 2020-2026 (USD BILLION)
TABLE 69. CHINA FLOW CYTOMETRY MARKET VALUE, BY END-USER, 2020-2026 (USD BILLION)
TABLE 70. INDIA FLOW CYTOMETRY MARKET VALUE, BY TECHNOLOGY, 2020-2026 (USD BILLION)
TABLE 71. INDIA FLOW CYTOMETRY MARKET VALUE, BY PRODUCT & SERVICE, 2020-2026 (USD BILLION)
TABLE 72. INDIA FLOW CYTOMETRY MARKET VALUE, BY APPLICATION, 2020-2026 (USD BILLION)
TABLE 73. INDIA FLOW CYTOMETRY MARKET VALUE, BY END-USER, 2020-2026 (USD BILLION)
TABLE 74. JAPAN FLOW CYTOMETRY MARKET VALUE, BY TECHNOLOGY, 2020-2026 (USD BILLION)
TABLE 75. JAPAN FLOW CYTOMETRY MARKET VALUE, BY PRODUCT & SERVICE, 2020-2026 (USD BILLION)
TABLE 76. JAPAN FLOW CYTOMETRY MARKET VALUE, BY APPLICATION, 2020-2026 (USD BILLION)
TABLE 77. JAPAN FLOW CYTOMETRY MARKET VALUE, BY END-USER, 2020-2026 (USD BILLION)
TABLE 78. REST OF APAC FLOW CYTOMETRY MARKET VALUE, BY TECHNOLOGY, 2020-2026 (USD BILLION)
TABLE 79. REST OF APAC FLOW CYTOMETRY MARKET VALUE, BY PRODUCT & SERVICE, 2020-2026 (USD BILLION)
TABLE 80. REST OF APAC FLOW CYTOMETRY MARKET VALUE, BY APPLICATION, 2020-2026 (USD BILLION)
TABLE 81. REST OF APAC FLOW CYTOMETRY MARKET VALUE, BY END-USER, 2020-2026 (USD BILLION)
TABLE 82. REST OF WORLD FLOW CYTOMETRY MARKET VALUE, BY TECHNOLOGY, 2020-2026 (USD BILLION)
TABLE 83. REST OF WORLD FLOW CYTOMETRY MARKET VALUE, BY PRODUCT & SERVICE, 2020-2026 (USD BILLION)
TABLE 84. REST OF WORLD FLOW CYTOMETRY MARKET VALUE, BY APPLICATION, 2020-2026 (USD BILLION)
TABLE 85. REST OF WORLD FLOW CYTOMETRY MARKET VALUE, BY END-USER, 2020-2026 (USD BILLION)
TABLE 86. BECKMAN COULTER, INC: FINANCIALS
TABLE 87. BECKMAN COULTER, INC: PRODUCTS & SERVICES
TABLE 88. BECKMAN COULTER, INC: RECENT DEVELOPMENTS
TABLE 89. BIO-RAD LABORATORIES, INC: FINANCIALS
TABLE 90. BIO-RAD LABORATORIES, INC: PRODUCTS & SERVICES
TABLE 91. BIO-RAD LABORATORIES, INC: RECENT DEVELOPMENTS
TABLE 92. BECTON, DICKINSON AND COMPANY: FINANCIALS
TABLE 93. BECTON, DICKINSON AND COMPANY: PRODUCTS & SERVICES
TABLE 94. BECTON, DICKINSON AND COMPANY: RECENT DEVELOPMENTS
TABLE 95. THERMO FISHER SCIENTIFIC, INC: FINANCIALS
TABLE 96. THERMO FISHER SCIENTIFIC, INC: PRODUCTS & SERVICES
TABLE 97. THERMO FISHER SCIENTIFIC, INC: RECENT DEVELOPMENTS
TABLE 98. AGILENT TECHNOLOGIES, INC: FINANCIALS
TABLE 99. AGILENT TECHNOLOGIES, INC: PRODUCTS & SERVICES
TABLE 100. AGILENT TECHNOLOGIES, INC: RECENT DEVELOPMENTS
TABLE 101. SYSMEX PARTEC GMBH: FINANCIALS
TABLE 102. SYSMEX PARTEC GMBH: PRODUCTS & SERVICES
TABLE 103. SYSMEX PARTEC GMBH: RECENT DEVELOPMENTS
TABLE 104. LUMINEX CORPORATION: FINANCIALS
TABLE 105. LUMINEX CORPORATION: PRODUCTS & SERVICES
TABLE 106. LUMINEX CORPORATION: RECENT DEVELOPMENTS
TABLE 107. MILTENYI BIOTEC GMBH: FINANCIALS
TABLE 108. MILTENYI BIOTEC GMBH: PRODUCTS & SERVICES
TABLE 109. MILTENYI BIOTEC GMBH: RECENT DEVELOPMENTS
TABLE 110. MERCK KGAA: FINANCIALS
TABLE 111. MERCK KGAA: PRODUCTS & SERVICES
TABLE 112. MERCK KGAA: RECENT DEVELOPMENTS
TABLE 113. SONY BIOTECHNOLOGY AND INC: FINANCIALS
TABLE 114. SONY BIOTECHNOLOGY AND INC: PRODUCTS & SERVICES
TABLE 115. SONY BIOTECHNOLOGY AND INC: RECENT DEVELOPMENTS
TABLE 116. BIOMÉRIEUX S.A: PRODUCTS & SERVICES
Research Framework
Infoholic Research works on a holistic 360° approach in order to deliver high quality, validated and reliable information in our market reports. The Market estimation and forecasting involves following steps:
- Data Collation (Primary & Secondary)
- In-house Estimation (Based on proprietary data bases and Models)
- Market Triangulation
- Forecasting

Market related information is congregated from both primary and secondary sources.
Primary sources
Involved participants from all global stakeholders such as Solution providers, service providers, Industry associations, thought leaders etc. across levels such as CXOs, VPs and managers. Plus, our in-house industry experts having decades of industry experience contribute their consulting and advisory services.
Secondary sources
Include public sources such as regulatory frameworks, government IT spending, government demographic indicators, industry association statistics, and company publications along with paid sources such as Factiva, OneSource, Bloomberg among others.
![]()


