
Fleet Management Market segmented by Solutions (Operations Management, Performance Management, Vehicle Maintenance & Diagnostics, Fleet Analytics & Reporting and Others), Services (Professional Services & Managed Services), Fleet Type (Commercial Fleets & Passenger Cars), and Geography – Global Drivers, Restraints, Opportunities, Trends, and Forecast up to 2026
- September, 2020
- Domain: ICT - Social, Mobile, Analytics & Cloud (SMAC)
- Get Free 10% Customization in this Report
Fleet management is the systematic management of the vehicle profile, which are used for business purpose. Fleet management involves various functions such as vehicle maintenance, vehicle financing, fuel management, licensing, and other functions. This management helps transport based firms to control the risks related to vehicle investment and minimizing the costs of transportation and staff. The fleet management market growth is stimulated by factors such as increasing the operational efficiency of the business and rising deployment of cloud computing and large data analytics solution for efficient fleet management functions. Additionally, emerging initiatives concerned about environmental safety by controlling pollution is creating opportunities for fleet management. The market for fleet management is predicted to grow at a CAGR of 15.3% during the forecasting period.
Research Methodology
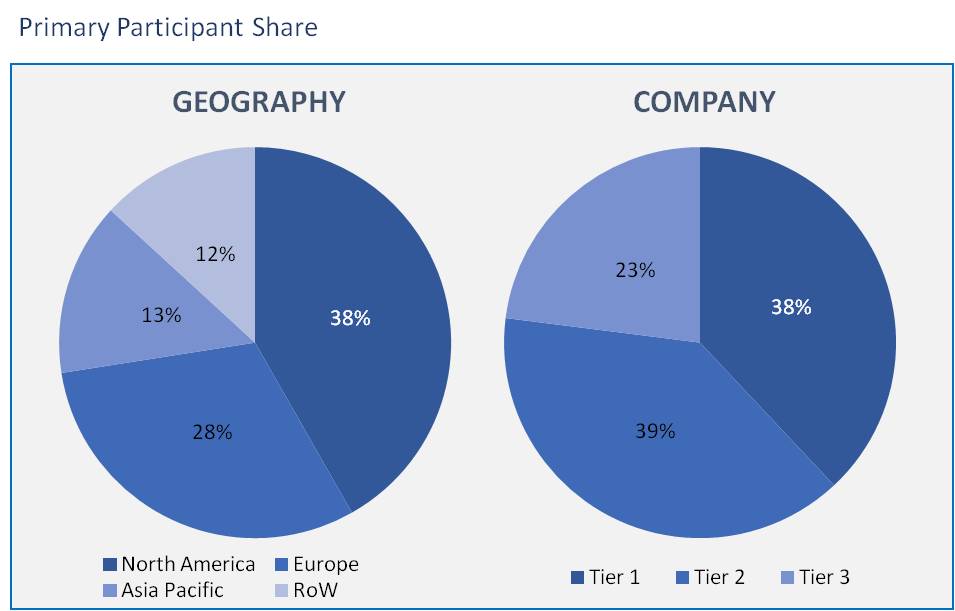
The fleet management market has been analyzed by utilizing the optimum combination of secondary sources and in-house methodology, along with an irreplaceable blend of primary insights. The real-time assessment of the market is an integral part of our market sizing and forecasting methodology. Our industry experts and panel of primary participants have helped in compiling relevant aspects with realistic parametric estimations for a comprehensive study. The participation share of different categories of primary participants is given below:
Fleet Management Market is segmented on the bases of solutions, services, components, fleet type, and geography.
Solutions: Market Size & Analysis
- Operations Management
- Performance Management
- Vehicle Maintenance and Diagnostics
- Fleet Analytics and Reporting
- Others
Services: Market Size & Analysis
- Professional Services
- Managed Services
Fleet Type: Market Size & Analysis
- Commercial Fleets
- Passenger Cars
Geography: Market Size & Analysis
- North America
- Europe
- Asia Pacific
- Rest of the World
The market of fleet management based on the solution has been segmented into operations management, performance management, vehicle maintenance and diagnostics, fleet analytics and reporting, and others. The performance management solution has a rapidly increasing demand in the fleet management as it is widely opted by industries to manage the performance of the fleet to make sure the proper supply chain. A performance management solution provides the maintenance information of the fleet to reduce the engine downtime.
In the market by service, the professional service provider is anticipated to have a large market position. Professional service providers examine the fleet operations of logistics companies, that means understanding business restrictions, gives the key insights that assist the company in optimum usage of available resources and making the most of their technological investments.
In terms of division by fleet type, the market has been bifurcated among commercial fleets and passenger cars. The commercial fleet type is attributed to have the major share due to the high dependence on commercial fleets in manufacturing industries for on-time supply of the goods, to maintain the proper management of exchange, and also to track the fleet with fleet management solutions.
According to the regional market analysis, the fleet management market is segregated into North America, Europe, Asia Pacific, and the Rest of the world. North America is considered to have the highest growing market due to the growing deployment of software, which resulted in growth in the supply of raw materials. Europe is happening to reap the maximum market revenue next to North America due to the rapidly adopting corporate cars for the employees in the firms.
Globally, increasing dependence on advanced technology in terms of artificial intelligence in this domain is enhancing market growth. The other aspects accountable for the global market growth are the rising awareness of the safety of the fleet, mandatory implementation of the electronic logging devices in the commercial fleets to record the restricted driving hours which are scheduled by the government, and growing deployment of wireless technology due to the low costs. Moreover, the abruptly increasing data volumes in the world and rising cyber threats are likely to hamper the market growth
ARI Fleet Management, Azuga, Chevin Fleet Solutions, Donlen Corporation, GPS Insight, Masternaut, Nextraq, Keeptruckin, Avrios, ThingTech, Automile Inc, Fleetonomy, Fleetroot, Autofleet, and ClearPathGPS. These are a few companies which are playing a major role in market growth.
The large industries have widely adopted the fleet management process and are largely investing in frequently developing technologies. The mandatory initiative to protect the environment is an opportunity to raise the growth of the market. The fleet management market gives insights into market dynamics.
- The study presents a comprehensive fleet management market analysis in addition to present trends and future evaluations to explain the impending investment pockets.
- The fleet management market report offers insights into key drivers, constraints, and opportunities also their impact analysis.
- This study also provides a geographical analysis of the market in terms of market share and future prospective.
- This report also provides the strategic depiction of key companies, which helps players to understand the market competency.
1. Executive Summary
2. Industry Outlook
2.1. Industry Overview
2.2. Industry Trends
3. Market Snapshot
3.1. Total Addressable Market
3.2. Segment Addressable Market
3.2.1. PEST Analysis
3.2.2. Porter Five Forces
3.3. Related Markets
3.4. Ecosystem
4. Market Outlook
4.1. Overview
4.1.1. Market Evolution
4.2. Market Trends and Impact
4.3. Pricing Analysis
4.4. Market Segmentation
4.5. Market Dynamics
4.5.1. Drivers
4.5.2. Restraints
4.5.3. Opportunities
4.6. DRO - Impact Analysis
5. Solutions: Market Size & Analysis
5.1. Overview
5.2. Operations Management
5.3. Performance Management
5.4. Vehicle Maintenance and Diagnostics
5.5. Fleet Analytics and Reporting
5.6. Others
6. Services: Market Size & Analysis
6.1. Overview
6.2. Professional Services
6.3. Managed Services
7. Fleet Type: Market Size & Analysis
7.1. Overview
7.2. Commercial Fleets
7.3. Passenger Cars
8. Geography: Market Size & Analysis
8.1. Overview
8.2. North America
8.3. Europe
8.4. Asia Pacific
8.5. Rest of the World
9. Competitive Landscape
9.1. Competitor Comparison Analysis
9.2. Market Developments
9.2.1. Mergers and Acquisitions, Legal, Awards, Partnerships
9.2.2. Product Launches and execution
10. Vendor Profiles
10.1. ARI FLEET MANAGEMENT
10.1.1. Overview
10.1.2. Business Units
10.1.3. Geographic Revenue
10.1.4. Product Offerings
10.1.5. Developments
10.1.6. Business Strategy
10.2. AZUGA
10.2.1. Overview
10.2.2. Business Units
10.2.3. Geographic Revenue
10.2.4. Product Offerings
10.2.5. Developments
10.2.6. Business Strategy
10.3. CHEVIN FLEET SOLUTIONS
10.3.1. Overview
10.3.2. Business Units
10.3.3. Geographic Revenue
10.3.4. Product Offerings
10.3.5. Developments
10.3.6. Business Strategy
10.4. DONLEN CORPORATION
10.4.1. Overview
10.4.2. Business Units
10.4.3. Geographic Revenue
10.4.4. Product Offerings
10.4.5. Developments
10.4.6. Business Strategy
10.5. GPS INSIGHT
10.5.1. Overview
10.5.2. Business Units
10.5.3. Geographic Revenue
10.5.4. Product Offerings
10.5.5. Developments
10.5.6. Business Strategy
10.6. MASTERNAUT
10.6.1. Overview
10.6.2. Business Units
10.6.3. Geographic Revenue
10.6.4. Product Offerings
10.6.5. Developments
10.6.6. Business Strategy
10.7. NEXTRAQ
10.7.1. Overview
10.7.2. Business Units
10.7.3. Geographic Revenue
10.7.4. Product Offerings
10.7.5. Developments
10.7.6. Business Strategy
10.8. KEEPTRUCKIN
10.8.1. Overview
10.8.2. Business Units
10.8.3. Geographic Revenue
10.8.4. Product Offerings
10.8.5. Developments
10.8.6. Business Strategy
10.9. AVRIOS
10.9.1. Overview
10.9.2. Business Units
10.9.3. Geographic Revenue
10.9.4. Product Offerings
10.9.5. Developments
10.9.6. Business Strategy
10.10. ThingTech
10.10.1. Overview
10.10.2. Business Units
10.10.3. Geographic Revenue
10.10.4. Product Offerings
10.10.5. Developments
10.10.6. Business Strategy
11. Companies to Watch
11.1. Automile Inc
11.1.1. Overview
11.1.2. Market
11.1.3. Business Strategy
11.2. Fleetonomy
11.2.1. Overview
11.2.2. Market
11.2.3. Business Strategy
11.3. Fleetroot
11.3.1. Overview
11.3.2. Market
11.3.3. Business Strategy
11.4. Autofleet
11.4.1. Overview
11.4.2. Market
11.4.3. Business Strategy
11.5. ClearPathGPS
11.5.1. Overview
11.5.2. Market
11.5.3. Business Strategy
12. Analyst Opinion
13. Annexure
13.1. Report Scope
13.2. Market Definitions
13.3. Research Methodology
13.3.1. Data Collation and In-house Estimation
13.3.2. Market Triangulation
13.3.3. Forecasting
13.4. Report Assumptions
13.5. Declarations
13.6. Stakeholders
13.7. Abbreviation
TABLE 1. GLOBAL FLEET MANAGEMENT MARKET VALUE, BY SOLUTIONS, 2020-2026 (USD MILLION)
TABLE 2. GLOBAL FLEET MANAGEMENT MARKET VALUE FOR OPERATIONS MANAGEMENT, BY GEOGRAPHY, 2020-2026 (USD MILLION)
TABLE 3. GLOBAL FLEET MANAGEMENT MARKET VALUE FOR PERFORMANCE MANAGEMENT, BY GEOGRAPHY, 2020-2026 (USD MILLION)
TABLE 4. GLOBAL FLEET MANAGEMENT MARKET VALUE FOR VEHICLE MAINTENANCE AND DIAGNOSTICS, BY GEOGRAPHY, 2020-2026 (USD MILLION)
TABLE 5. GLOBAL FLEET MANAGEMENT MARKET VALUE FOR FLEET ANALYTICS AND REPORTING, BY GEOGRAPHY, 2020-2026 (USD MILLION)
TABLE 6. GLOBAL FLEET MANAGEMENT MARKET VALUE FOR OTHERS, BY GEOGRAPHY, 2020-2026 (USD MILLION)
TABLE 7. GLOBAL FLEET MANAGEMENT MARKET VALUE, BY FLEET TYPE, 2020-2026 (USD MILLION)
TABLE 8. GLOBAL FLEET MANAGEMENT MARKET VALUE FOR COMMERCIAL FLEETS, BY GEOGRAPHY, 2020-2026 (USD MILLION)
TABLE 9. GLOBAL FLEET MANAGEMENT MARKET VALUE FOR PASSENGER CARS, BY GEOGRAPHY, 2020-2026 (USD MILLION)
TABLE 10. GLOBAL FLEET MANAGEMENT MARKET VALUE, BY SERVICES, 2020-2026 (USD MILLION)
TABLE 11. GLOBAL FLEET MANAGEMENT MARKET VALUE FOR PROFESSIONAL SERVICES, BY GEOGRAPHY, 2020-2026 (USD MILLION)
TABLE 12. GLOBAL FLEET MANAGEMENT MARKET VALUE FOR MANAGED SERVICES, BY GEOGRAPHY, 2020-2026 (USD MILLION)
TABLE 13. NORTH AMERICA FLEET MANAGEMENT MARKET VALUE, BY COUNTRY, 2020-2026 (USD MILLION)
TABLE 14. NORTH AMERICA FLEET MANAGEMENT MARKET VALUE, BY SOLUTIONS, 2020-2026 (USD MILLION)
TABLE 15. NORTH AMERICA FLEET MANAGEMENT MARKET VALUE, BY COMPONENT, 2020-2026 (USD MILLION)
TABLE 16. NORTH AMERICA FLEET MANAGEMENT MARKET VALUE, BY SERVICES, 2020-2026 (USD MILLION)
TABLE 17. NORTH AMERICA FLEET MANAGEMENT MARKET VALUE, BY FLEET TYPE, 2020-2026 (USD MILLION)
TABLE 18. U.S FLEET MANAGEMENT MARKET VALUE, BY SOLUTIONS, 2020-2026 (USD MILLION)
TABLE 19. U.S FLEET MANAGEMENT MARKET VALUE, BY COMPONENT, 2020-2026 (USD MILLION)
TABLE 20. U.S FLEET MANAGEMENT MARKET VALUE, BY SERVICES, 2020-2026 (USD MILLION)
TABLE 21. U.S FLEET MANAGEMENT MARKET VALUE, BY FLEET TYPE, 2020-2026 (USD MILLION)
TABLE 22. CANADA FLEET MANAGEMENT MARKET VALUE, BY SOLUTIONS, 2020-2026 (USD MILLION)
TABLE 23. CANADA FLEET MANAGEMENT MARKET VALUE, BY COMPONENT, 2020-2026 (USD MILLION)
TABLE 24. CANADA FLEET MANAGEMENT MARKET VALUE, BY SERVICES, 2020-2026 (USD MILLION)
TABLE 25. CANADA FLEET MANAGEMENT MARKET VALUE, BY FLEET TYPE, 2020-2026 (USD MILLION)
TABLE 26. EUROPE FLEET MANAGEMENT MARKET VALUE, BY COUNTRY, 2020-2026 (USD MILLION)
TABLE 27. EUROPE FLEET MANAGEMENT MARKET VALUE, BY SOLUTIONS, 2020-2026 (USD MILLION)
TABLE 28. EUROPE FLEET MANAGEMENT MARKET VALUE, BY COMPONENT, 2020-2026 (USD MILLION)
TABLE 29. EUROPE FLEET MANAGEMENT MARKET VALUE, BY SERVICES, 2020-2026 (USD MILLION)
TABLE 30. EUROPE FLEET MANAGEMENT MARKET VALUE, BY FLEET TYPE, 2020-2026 (USD MILLION)
TABLE 31. GERMANY FLEET MANAGEMENT MARKET VALUE, BY SOLUTIONS, 2020-2026 (USD MILLION)
TABLE 32. GERMANY FLEET MANAGEMENT MARKET VALUE, BY COMPONENT, 2020-2026 (USD MILLION)
TABLE 33. GERMANY FLEET MANAGEMENT MARKET VALUE, BY SERVICES, 2020-2026 (USD MILLION)
TABLE 34. GERMANY FLEET MANAGEMENT MARKET VALUE, BY FLEET TYPE, 2020-2026 (USD MILLION)
TABLE 35. U.K FLEET MANAGEMENT MARKET VALUE, BY SOLUTIONS, 2020-2026 (USD MILLION)
TABLE 36. U.K FLEET MANAGEMENT MARKET VALUE, BY COMPONENT, 2020-2026 (USD MILLION)
TABLE 37. U.K FLEET MANAGEMENT MARKET VALUE, BY SERVICES, 2020-2026 (USD MILLION)
TABLE 38. U.K FLEET MANAGEMENT MARKET VALUE, BY FLEET TYPE, 2020-2026 (USD MILLION)
TABLE 39. FRANCE FLEET MANAGEMENT MARKET VALUE, BY SOLUTIONS, 2020-2026 (USD MILLION)
TABLE 40. FRANCE FLEET MANAGEMENT MARKET VALUE, BY COMPONENT, 2020-2026 (USD MILLION)
TABLE 41. FRANCE FLEET MANAGEMENT MARKET VALUE, BY SERVICES, 2020-2026 (USD MILLION)
TABLE 42. FRANCE FLEET MANAGEMENT MARKET VALUE, BY FLEET TYPE, 2020-2026 (USD MILLION)
TABLE 43. ROE FLEET MANAGEMENT MARKET VALUE, BY SOLUTIONS, 2020-2026 (USD MILLION)
TABLE 44. ROE FLEET MANAGEMENT MARKET VALUE, BY COMPONENT, 2020-2026 (USD MILLION)
TABLE 45. ROE FLEET MANAGEMENT MARKET VALUE, BY SERVICES, 2020-2026 (USD MILLION)
TABLE 46. ROE FLEET MANAGEMENT MARKET VALUE, BY FLEET TYPE, 2020-2026 (USD MILLION)
TABLE 47. ASIA PACIFIC FLEET MANAGEMENT MARKET VALUE, BY COUNTRY, 2020-2026 (USD MILLION)
TABLE 48. ASIA PACIFIC FLEET MANAGEMENT MARKET VALUE, BY SOLUTIONS, 2020-2026 (USD MILLION)
TABLE 49. ASIA PACIFIC FLEET MANAGEMENT MARKET VALUE, BY COMPONENT, 2020-2026 (USD MILLION)
TABLE 50. ASIA PACIFIC FLEET MANAGEMENT MARKET VALUE, BY SERVICES, 2020-2026 (USD MILLION)
TABLE 51. ASIA PACIFIC FLEET MANAGEMENT MARKET VALUE, BY FLEET TYPE, 2020-2026 (USD MILLION)
TABLE 52. CHINA FLEET MANAGEMENT MARKET VALUE, BY SOLUTIONS, 2020-2026 (USD MILLION)
TABLE 53. CHINA FLEET MANAGEMENT MARKET VALUE, BY COMPONENT, 2020-2026 (USD MILLION)
TABLE 54. CHINA FLEET MANAGEMENT MARKET VALUE, BY SERVICES, 2020-2026 (USD MILLION)
TABLE 55. CHINA FLEET MANAGEMENT MARKET VALUE, BY FLEET TYPE, 2020-2026 (USD MILLION)
TABLE 56. JAPAN FLEET MANAGEMENT MARKET VALUE, BY SOLUTIONS, 2020-2026 (USD MILLION)
TABLE 57. JAPAN FLEET MANAGEMENT MARKET VALUE, BY COMPONENT, 2020-2026 (USD MILLION)
TABLE 58. JAPAN FLEET MANAGEMENT MARKET VALUE, BY SERVICES, 2020-2026 (USD MILLION)
TABLE 59. JAPAN FLEET MANAGEMENT MARKET VALUE, BY FLEET TYPE, 2020-2026 (USD MILLION)
TABLE 60. INDIA FLEET MANAGEMENT MARKET VALUE, BY SOLUTIONS, 2020-2026 (USD MILLION)
TABLE 61. INDIA FLEET MANAGEMENT MARKET VALUE, BY COMPONENT, 2020-2026 (USD MILLION)
TABLE 62. INDIA FLEET MANAGEMENT MARKET VALUE, BY SERVICES, 2020-2026 (USD MILLION)
TABLE 63. INDIA FLEET MANAGEMENT MARKET VALUE, BY FLEET TYPE, 2020-2026 (USD MILLION)
TABLE 64. REST OF ASIA PACIFIC FLEET MANAGEMENT MARKET VALUE, BY SOLUTIONS, 2020-2026 (USD MILLION)
TABLE 65. REST OF ASIA PACIFIC FLEET MANAGEMENT MARKET VALUE, BY COMPONENT, 2020-2026 (USD MILLION)
TABLE 66. REST OF ASIA PACIFIC FLEET MANAGEMENT MARKET VALUE, BY SERVICES, 2020-2026 (USD MILLION)
TABLE 67. REST OF ASIA PACIFIC FLEET MANAGEMENT MARKET VALUE, BY FLEET TYPE, 2020-2026 (USD MILLION)
TABLE 68. REST OF WORLD FLEET MANAGEMENT MARKET VALUE, BY SOLUTIONS, 2020-2026 (USD MILLION)
TABLE 69. REST OF WORLD FLEET MANAGEMENT MARKET VALUE, BY COMPONENT, 2020-2026 (USD MILLION)
TABLE 70. REST OF WORLD FLEET MANAGEMENT MARKET VALUE, BY SERVICES, 2020-2026 (USD MILLION)
TABLE 71. REST OF WORLD FLEET MANAGEMENT MARKET VALUE, BY FLEET TYPE, 2020-2026 (USD MILLION)
TABLE 72. ARI FLEET MANAGEMENT.: OVERVIEW
TABLE 73. ARI FLEET MANAGEMENT.: STRATEGIC SNAPSHOT
TABLE 74. ARI FLEET MANAGEMENT.: BUSINESS OPPORTUNITIES AND OUTLOOK
TABLE 75. ARI FLEET MANAGEMENT.: PRODUCT/SERVICE PORTFOLIO
TABLE 76. AZUGA: OVERVIEW
TABLE 77. AZUGA: STRATEGIC SNAPSHOT
TABLE 78. AZUGA: BUSINESS OPPORTUNITIES AND OUTLOOK
TABLE 79. AZUGA: PRODUCT/SERVICE PORTFOLIO
TABLE 80. AVRIOS: OVERVIEW
TABLE 81. AVRIOS: STRATEGIC SNAPSHOT
TABLE 82. AVRIOS: BUSINESS OPPORTUNITIES AND OUTLOOK
TABLE 83. AVRIOS: PRODUCT/SERVICE PORTFOLIO
TABLE 84. AUTOFLEET: OVERVIEW
TABLE 85. AUTOFLEET: STRATEGIC SNAPSHOT
TABLE 86. AUTOFLEET: BUSINESS OPPORTUNITIES AND OUTLOOK
TABLE 87. AUTOFLEET: PRODUCT/SERVICE PORTFOLIO
TABLE 88. GPS INSIGHT: OVERVIEW
TABLE 89. GPS INSIGHT: STRATEGIC SNAPSHOT
TABLE 90. GPS INSIGHT: BUSINESS OPPORTUNITIES AND OUTLOOK
TABLE 91. GPS INSIGHT: PRODUCT/SERVICE PORTFOLIO
TABLE 92. MASTERNAUT: OVERVIEW
TABLE 93. MASTERNAUT: STRATEGIC SNAPSHOT
TABLE 94. MASTERNAUT: BUSINESS OPPORTUNITIES AND OUTLOOK
TABLE 95. MASTERNAUT: PRODUCT/SERVICE PORTFOLIO
TABLE 96. NEXTRAQ: OVERVIEW
TABLE 97. NEXTRAQ: STRATEGIC SNAPSHOT
TABLE 98. NEXTRAQ: BUSINESS OPPORTUNITIES AND OUTLOOK
TABLE 99. NEXTRAQ: PRODUCT/SERVICE PORTFOLIO
TABLE 100. KEEPTRUCKIN.: OVERVIEW
TABLE 101. KEEPTRUCKIN.: STRATEGIC SNAPSHOT
TABLE 102. KEEPTRUCKIN.: BUSINESS OPPORTUNITIES AND OUTLOOK
TABLE 103. KEEPTRUCKIN.: PRODUCT/SERVICE PORTFOLIO
TABLE 104. AVRIOS: OVERVIEW
TABLE 105. AVRIOS: STRATEGIC SNAPSHOT
TABLE 106. AVRIOS: BUSINESS OPPORTUNITIES AND OUTLOOK
TABLE 107. AVRIOS: PRODUCT/SERVICE PORTFOLIO
TABLE 108. THINGTECH.: OVERVIEW
TABLE 109. THINGTECH.: STRATEGIC SNAPSHOT
TABLE 110. THINGTECH.: BUSINESS OPPORTUNITIES AND OUTLOOK
TABLE 111. THINGTECH.: PRODUCT/SERVICE PORTFOLIO
Research Framework
Infoholic Research works on a holistic 360° approach in order to deliver high quality, validated and reliable information in our market reports. The Market estimation and forecasting involves following steps:
- Data Collation (Primary & Secondary)
- In-house Estimation (Based on proprietary data bases and Models)
- Market Triangulation
- Forecasting

Market related information is congregated from both primary and secondary sources.
Primary sources
Involved participants from all global stakeholders such as Solution providers, service providers, Industry associations, thought leaders etc. across levels such as CXOs, VPs and managers. Plus, our in-house industry experts having decades of industry experience contribute their consulting and advisory services.
Secondary sources
Include public sources such as regulatory frameworks, government IT spending, government demographic indicators, industry association statistics, and company publications along with paid sources such as Factiva, OneSource, Bloomberg among others.
![]()


