
Feed Additives Market By Type (Amino acids, antibiotics, vitamins, enzymes and others) By Application (ruminants, poultry, swine, aquatic animals, and others) and By Geography – Global Driver, Restraints, Opportunities, Trends, and Forecast to 2023
- August, 2018
- Domain: Chemicals, Materials & Food - Specialty Chemicals
- Get Free 10% Customization in this Report
Rising consumer awareness toward protein- and nutrient-based food and increasing concerns about the health & safety of livestock are fostering the market of feed additives. Feed additives play an essential role in the overall health of livestock, i.e., help in digestion, prevention from diseases, conversion rate, and improve weight gain.
Research Methodology
The feed additives market has been analyzed by utilizing the optimum combination of secondary sources and in-house methodology along with an irreplaceable blend of primary insights. The real-time assessment of the market is an integral part of our market sizing and forecasting methodology. Our industry experts and panel of primary participants have helped in compiling relevant aspects with realistic parametric estimations for a comprehensive study. The participation share of different categories of primary participants is given below:
Primary Participant Share
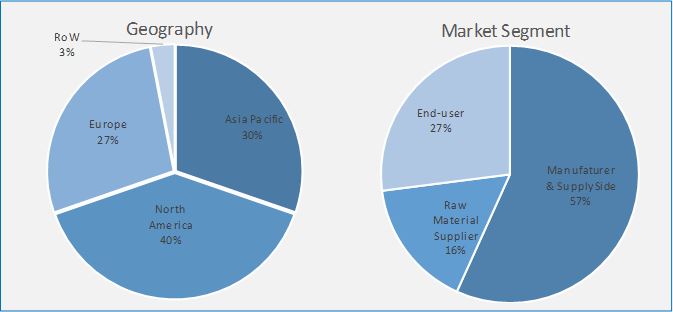
Key Market Insights
Changing consumer preferences for better nutritional feed products are increasing the demand for feed additives. Further, the focus has shifted toward feed additive inclusive products to tackle the concern of nutritional loss such as unabsorbed fat and protein. The demand from consumers of ruminants and poultry industries is driving the feed additives market. Asia Pacific is currently the leading market for overall feed additives, whereas Europe is gaining popularity in terms of other feed additive chemicals such as amino acids, antibiotics, and feed enzymes. The rising consumer per capita income along with a shift in consumer food behavior toward a protein-rich diet is strengthening the industry growth in Asia Pacific.
Globally, Asia Pacific is the largest feed additives market, primarily due to the presence of export-oriented manufacturing capacities and intense domestic demand from various end-user industries. The increase in animal farmers is further driving the market growth in the region. The anticipated economic stability in Europe is expected to boost its manufacturing sector, complementing the growth of the feed additives market. North America is likely to remain the key region with a significant contribution from the US. Few of the prominent companies operating in the feed additives market are BASF SE, Cargill Inc., DowDuPont Inc., Novozymes, and Novus International Inc.
Types:
- Amino Acids
- Antibiotics
- Vitamins
- Enzymes
- Others
End-users:
- Ruminants
- Poultry
- Swine
- Aquatic Animals
- Others
Geography:
- Asia Pacific
- North America
- Europe
- Rest of the World
Table of Contents
1 Report Outline
1.1 Introduction
1.2 Report Scope
1.3 Market Definition
1.4 Research Methodology
1.4.1 Data Collation & In-house Estimation
1.4.2 Market Triangulation
1.4.3 Forecasting
1.5 Study Declaration
1.6 Report Assumptions
1.7 Stakeholders
2 Executive Summary
2.1 The market will be speeding up from developing countries
2.2 Poultry market is expected to ascend further
3 Market Positioning
3.1 Total Addressable Market (TAM): Specialty Ingredients Market
3.1.1 Market Overview
3.1.2 Major Trends
3.2 Segmented Addressable Market
3.3 Related Markets
4 Market Outlook
4.1 Overview
4.2 Value Chain Analysis
4.3 PESTLE
4.4 Porter 5 (Five) Forces
4.5 Patent Analysis
5 Market Characteristics
5.1 Market Segmentation
5.2 Market Dynamics
5.2.1 Drivers
5.2.1.1 Increasing penetration of feed enzyme towards new markets
5.2.1.2 Growing demand of feed additives in sustainable farming
5.2.2 Restraints
5.2.2.1 High product prices and limited players
5.2.2.2 Changing geo-political structure
5.2.3 Opportunities
5.2.3.1 Growing innovation in feed additives
5.2.3.2 Large untapped market in developing and underdeveloped countries
5.2.4 DRO – Impact Analysis
6 By type: Market Size & Analysis
6.1 Overview
6.2 Amino Acids
6.3 Antibiotic
6.4 Vitamins
6.5 Enzymes
6.6 Vendor Profiles
6.6.1 Cargill Inc.
6.6.2 BASF SE
6.6.3 DowDuPont Inc
6.6.4 Novozymes
6.6.5 Novus International, Inc.
(Overview, business units, geographic revenues, product profile, recent developments, business focus, SWOT analysis, and business strategy have been covered for all the vendors)
7 End-user: Market Size & Analysis
7.1 Overview
7.2 Ruminants
7.3 Poultry
7.4 Swine
7.5 Aquatic Animals
7.6 Customers Profile
7.6.1 Tyson Food
7.6.2 Archer Daniel Midland Company
7.6.3 Land O’Lakes Inc
7.6.4 Nutrena
7.6.5 Provimi
(Overview, business units, geographic revenues, product profile, SWOT analysis, and business strategy have been covered for all the customers)
8 Regions: Market Size and Analysis
8.1 Overview
8.2 Asia Pacific
8.3 Europe
8.4 North America
8.5 Rest of the World
(Market segmentation for geography, material type, and end-user have been covered for all the regions)
9 Companies to Watch for
9.1 Archer Daniel Midland Company (ADM)
9.1.1.1 Overview
9.1.1.2 Archer Daniel Midland increases specialty feed ingredient portfolio targeting poultry & swine
9.2 Neovia Sarl
9.2.1.1 Overview
9.2.1.2 Neovia makes strategic entry in the Nigerian premix market
10 Competitive Landscape
10.1 Competitor Comparison Analysis
10.2 Market Landscape
10.2.1 Mergers, Acquisitions & Joint Ventures
10.2.2 Joint Venture
10.2.3 Divestiture & Divestment
10.2.4 Expansion
10.2.5 Product Launch
10.2.6 Product Recall
Annexure
Ø Acronyms
TABLE 1 GLOBAL FEED ADDITIVES MARKET VALUE BY TYPES, 2016−2023 ($MILLION) 35
TABLE 2 GLOBAL FEED ADDITIVES MARKET VOLUME BY TYPES, 2017−2023 (KILOTONS) 36
TABLE 3 GLOBAL AMINO ACIDS IN FEED ADDITIVES MARKET VALUE, BY GEOGRAPHY, 2016−2023 ($MILLION) 37
TABLE 4 GLOBAL AMINO ACID IN FEED ADDITIVES, MARKET VOLUME, BY GEOGRAPHY, 2016−2023 (KILOTONS) 37
TABLE 5 GLOBAL ANTIBIOTIC IN FEED ADDITIVES MARKET VALUE, BY GEOGRAPHY, 2016−2023 ($MILLION) 38
TABLE 6 GLOBAL ANTIBIOTIC IN FEED ADDITIVES, MARKET VOLUME, BY GEOGRAPHY, 2017−2023 (KILOTONS) 39
TABLE 7 GLOBAL VITAMINS IN FEED ADDITIVES MARKET VALUE, BY GEOGRAPHY, 2016−2023 ($MILLION) 40
TABLE 8 GLOBAL VITAMINS IN FEED ADDITIVES, MARKET VOLUME, BY GEOGRAPHY, 2017−2023 (KILOTONS) 41
TABLE 9 GLOBAL ENZYMES IN FEED ADDITIVES MARKET VALUE, BY GEOGRAPHY, 2016−2023 ($MILLION) 42
TABLE 10 GLOBAL ENZYMES IN FEED ADDITIVES, MARKET VOLUME, BY GEOGRAPHY, 2017−2023 (KILOTONS) 43
TABLE 11 CARGILL INC.: PRODUCT PROFILE 45
TABLE 12 CARGILL INC.: RECENT DEVELOPMENTS 46
TABLE 13 BASF SE: PRODUCT PROFILE 53
TABLE 14 BASF SE: RECENT DEVELOPMENTS 54
TABLE 15 DOWDUPONT: PRODUCT PROFILE 59
TABLE 16 DOWDUPONT CHEMICAL: RECENT DEVELOPMENTS 59
TABLE 17 NOVOZYMES: RECENT DEVELOPMENTS 64
TABLE 18 NOVUS INTERNATIONAL: PRODUCT PROFILE 68
TABLE 19 NOVUS INTERNATIONAL: RECENT DEVELOPMENTS 68
TABLE 20 GLOBAL FEED ADDITIVES MARKET VALUE, BY END-USER, 2016-2023($MILLION) 71
TABLE 21 GLOBAL FEED ADDITIVES MARKET VOLUME, BY END-USER, 2016-2023 (KILOTONS) 72
TABLE 22 GLOBAL FEED ADDITIVES MARKET VALUE IN RUMINANTS BY GEOGRAPHY, 2016-2023 ($MILLION) 73
TABLE 23 GLOBAL FEED ADDITIVES MARKET VOLUME IN RUMINANTS, BY GEOGRAPHY, 2016-2023 (KILOTONS) 74
TABLE 24 GLOBAL FEED ADDITIVES MARKET VALUE IN POULTRY, BY GEOGRAPHY, 2016-2023 ($MILLION) 75
TABLE 25 GLOBAL FEED ADDITIVES MARKET VOLUME, IN POULTRY, BY GEOGRAPHY, 2016-2023 (KILOTONS) 76
TABLE 26 GLOBAL FEED ADDITIVES MARKET REVENUE, IN SWINE, BY GEOGRAPHY, 2016-2023 ($MILLION) 77
TABLE 27 GLOBAL FEED ADDITIVES MARKET VOLUME, IN SWINE, BY GEOGRAPHY, 2016-2023 (KILOTONS) 78
TABLE 28 GLOBAL FEED ADDITIVES MARKET REVENUE, IN AQUATIC ANIMALS, BY GEOGRAPHY, 2016-2023 ($MILLION) 79
TABLE 29 GLOBAL FEED ADDITIVES MARKET VOLUME, IN AQUATIC ANIMALS, BY GEOGRAPHY, 2016-2023 (KILOTONS) 80
TABLE 30 TYSON FOOD: BUSINESS ACTIVITIES 83
TABLE 31 TYSON FOODS, INC.: RECENT DEVELOPMENTS 83
TABLE 32 ARCHER DANIEL MIDLAND: BUSINESS ACTIVITIES 87
TABLE 33 ARCHER DANIEL MIDLAND: RECENT DEVELOPMENTS 88
TABLE 34 LAND O'LAKES INC: BUSINESS ACTIVITIES 92
TABLE 35 LAND O'LAKES INC: RECENT DEVELOPMENTS 92
TABLE 36 NUTRENA: BUSINESS ACTIVITIES 96
TABLE 37 NUTRENA: RECENT DEVELOPMENTS 96
TABLE 38 PROVIMI: BUSINESS ACTIVITIES 100
TABLE 39 PROVIMI: RECENT DEVELOPMENTS 100
TABLE 40 GLOBAL FEED ADDITIVES MARKET VALUE, BY GEOGRAPHY, 2016−2023 ($MILLION) 103
TABLE 41 GLOBAL FEED ADDITIVES MARKET VOLUME, BY GEOGRAPHY, 2016−2023 (KILOTONS) 104
TABLE 42 ASIA PACIFIC FEED ADDITIVES VALUE BY COUNTRIES, 2016−2023 ($MILLION) 105
TABLE 43 ASIA PACIFIC FEED ADDITIVES MARKET VOLUME BY COUNTRIES, 2016−2023 (KILOTONS) 106
TABLE 44 ASIA PACIFIC FEED ADDITIVES MARKET VALUE, BY TYPES, 2016−2023 ($MILLION) 107
TABLE 45 ASIA PACIFIC FEED ADDITIVES MARKET VOLUME, BY TYPES, 2016−2023 (KILOTONS) 107
TABLE 46 ASIA PACIFIC FEED ADDITIVES MARKET VALUE, BY END-USERS, 2016−2023 ($MILLION) 109
TABLE 47 ASIA PACIFIC FEED ADDITIVES MARKET VOLUME, BY END-USERS, 2016−2023 (KILOTONS) 109
TABLE 48 EUROPE FEED ADDITIVES MARKET VALUE, BY COUNTRIES, 2016−2023 ($MILLION) 110
TABLE 49 EUROPE FEED ADDITIVES MARKET VOLUME BY COUNTRIES, 2016−2023 (KILOTONS) 111
TABLE 50 EUROPE FEED ADDITIVES MARKET VALUE, BY TYPES, 2016−2023 ($MILLION) 112
TABLE 51 EUROPE FEED ADDITIVES MARKET VOLUME, BY TYPES, 2016−2023 (KILOTONS) 112
TABLE 52 EUROPE FEED ADDITIVES MARKET VALUE BY END-USER, 2016−2023 ($MILLION) 113
TABLE 53 EUROPE FEED ADDITIVES MARKET VOLUME BY END-USER, 2016−2023 (KILOTONS) 114
TABLE 54 NORTH AMERICA FEED ADDITIVES MARKET VALUE BY COUNTRIES, 2016−2023 ($MILLION) 115
TABLE 55 NORTH AMERICA FEED ADDITIVES MARKET VOLUME BY COUNTRIES, 2016−2023 (KILOTONS) 116
TABLE 56 FEED ADDITIVES MARKET VALUE BY TYPES, 2016−2023 ($MILLION) 117
TABLE 57 NORTH AMERICA FEED ADDITIVES MARKET VOLUME BY TYPE, 2016−2023 (KILOTONS) 117
TABLE 58 NORTH AMERICA FEED ADDITIVES MARKET VALUE BY END-USER, 2016−2023 ($MILLION) 118
TABLE 59 NORTH AMERICA FEED ADDITIVES MARKET VOLUME BY END-USER, 2016−2023 (KILOTONS) 118
TABLE 60 REST OF THE WORLD FEED ADDITIVES MARKET VALUE BY GEOGRAPHY, 2016−2023 ($MILLION) 120
TABLE 61 REST OF THE WORLD FEED ADDITIVES MARKET VOLUME BY GEOGRAPHY, 2016−2023 (KILOTONS) 121
TABLE 62 REST OF THE WORLD FEED ADDITIVES MARKET VALUE, BY TYPES, 2016−2023 ($MILLION) 122
TABLE 63 REST OF THE WORLD FEED ADDITIVES MARKET VOLUME, BY TYPES, 2016−2023 (KILOTONS) 122
TABLE 64 REST OF THE WORLD FEED ADDITIVES MARKET VALUE BY END-USER, 2016−2023 ($MILLION) 123
TABLE 65 REST OF THE WORLD FEED ADDITIVES MARKET VOLUME BY END-USER, 2016−2023 (KILOTONS) 124
TABLE 66 MERGER, ACQUISITIONS, & JOINT VENTURES 127
TABLE 67 JOINT VENTURE 128
TABLE 68 DIVESTITURE & DIVESTMENT 129
TABLE 69 EXPANSION 129
TABLE 70 PRODUCT LAUNCH 130
TABLE 71 PRODUCT RECALL 130
Research Framework
Infoholic Research works on a holistic 360° approach in order to deliver high quality, validated and reliable information in our market reports. The Market estimation and forecasting involves following steps:
- Data Collation (Primary & Secondary)
- In-house Estimation (Based on proprietary data bases and Models)
- Market Triangulation
- Forecasting

Market related information is congregated from both primary and secondary sources.
Primary sources
Involved participants from all global stakeholders such as Solution providers, service providers, Industry associations, thought leaders etc. across levels such as CXOs, VPs and managers. Plus, our in-house industry experts having decades of industry experience contribute their consulting and advisory services.
Secondary sources
Include public sources such as regulatory frameworks, government IT spending, government demographic indicators, industry association statistics, and company publications along with paid sources such as Factiva, OneSource, Bloomberg among others.
![]()


