
Epinephrine Auto-Injector Market by age group (0-4 Years, 5-14 Years, 15-24 Years, 25-49 Years, 50-64 Years, and Above 65 Years), Dosage (0.5 mg, 0.3 mg, and 0.15mg), by End-user(individuals, clinics, and Hospitals), and Geography – Global Drivers, Restraints, Opportunities, Trends, and Forecast up to 2026
- September, 2020
- Domain: Healthcare - Medical Devices
- Get Free 10% Customization in this Report
Epinephrine auto-injector is a medical tool used to treat anaphylaxis by administering doses of epinephrine or adrenaline. These portable devices contain a fixed dose of epinephrine and a needle that is spring-loaded that helps in delivering the medicine to the patients that suffer from anaphylaxis or severe allergic reactions. These injections are commonly used to treat life-threatening allergies caused by insect bites, medications, or stings.
Research Methodology:
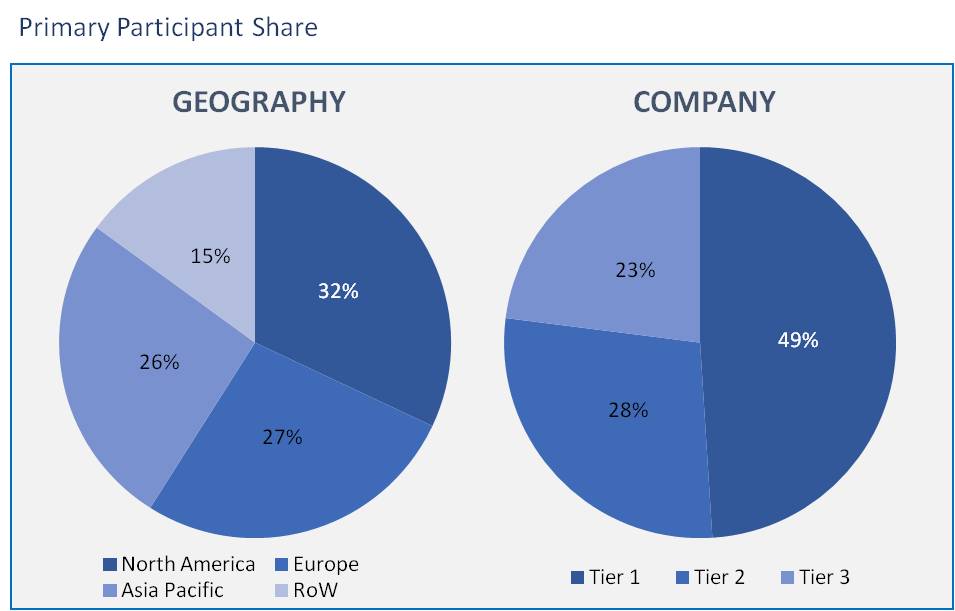
The epinephrine auto-injector market has been analyzed by utilizing the optimum combination of secondary sources and in-house methodology, along with an irreplaceable blend of primary insights. The real-time assessment of the market is an integral part of our market sizing and forecasting methodology. Our industry experts and panel of primary participants have helped in compiling relevant aspects with realistic parametric estimations for a comprehensive study. The participation share of different categories of primary participants is given below:
The major factors contributing to the growth of the epinephrine auto-injector market include growing the incidence of allergies, rising awareness regarding allergies, technological advancements in R&D activities such as chlorofluorocarbon-free epinephrine auto-injector inhalers using hydrofluoroalkane propellants, and high demand for auto-injectors rather than traditional devices such as standard syringes. Regulatory hurdles and high costs, however, limit the market’s growth.
A growing number of patient-assistance initiatives and creative product innovations by key vendors offer multiple opportunities for business growth over the forecast period.
The segmentation of the auto-injector market is made on the basis of end-user, Dosage, and age group. Following is the market segmentation:-
On the basis of the End-User: -
- Hospitals
- Clinics
- Home Based
- Others
On the basis of the Dosage: -
- 0.15 mg
- 0.3 mg
- Others
On the basis of the Age Group: -
- 0-4 Years
- 5-14 Years
- 15-24 Years
- 25-49 Years
- 50-64 Years
- Above 65 Years
On the basis of geography: -
- North America
- Asia pacific
- Europe
- Rest of World
North America dominates the market share of the epinephrine auto-injectors. This sector is flourishing in this region due to the adoption of costlier auto-injectors over the conventional injecting techniques and due to the improved healthcare infrastructure. Whereas Asia Pacific is projected to grow at the highest CAGR during the forecast period due to the increase in the number of various allergies amongst people and rising awareness regarding the auto-injectors among the end-users. Here rapid growth is seen in countries like China and India.
The major players that are operating in the Epinephrine auto-injector market are Adamis Pharmaceuticals Corporation, ALK-Abell A/S, Antares Pharma, Pfizer Inc., Teva Pharmaceutical Industries Ltd., Bausch & Lomb Incorporated, Impax Laboratories, Inc., Mylan N.V., Kaleo, Inc., and Lincoln Medical Centre Ltd.
Major Takeaways from the report:-
- The study offers a detailed macro-level view of the global epinephrine auto-injector market with existing developments and potential projections to elucidate imminent pockets of investment.
- The study offers information on current as well as the upcoming trends in the global auto-injector epinephrine market from 2020 to 2026, which helps in assessing the prevailing opportunities.
- This report also provides a detailed analysis of factors that restricts and drives the growth of the epinephrine auto-injector market.
- Identification of the key factors that are responsible for changing the market scenario, increase in opportunities, and the identification of the major players that are capable of influencing the market on a regional and global level have been provided in this report.
- The major market players operating in this market have been profiled in this report, and their key strategies are thoroughly analyzed to understand the competitive outlook of the epinephrine auto-injector market.
- Executive Summary
- Industry Outlook
- Industry Overview
- Industry Trends
- Market Snapshot
- Market Definition
- Market Outlook
- PEST Analysis
- Porter Five Forces
- Related Markets
- Market characteristics
- Market Evolution
- Market Trends and Impact
- Advantages/Disadvantages of Market
- Regulatory Impact
- Market Offerings
- Market Segmentation
- Market Dynamics
- Drivers
- Restraints
- Opportunities
- DRO - Impact Analysis
- End-User: Market Size & Analysis
- Overview
- Hospitals
- Clinics
- Home Based
- Others
- Dosage: Market Size & Analysis
- Overview
- 0.15 mg
- 0.3 mg
- Others
- Age Group: Market Size & Analysis
- Overview
- 0-4 Years
- 5-14 Years
- 15-24 Years
- 25-49 Years
- 50-64 Years
- Above 65 Years
- Geography: Market Size & Analysis
- Overview
- North America
- Europe
- Asia Pacific
- Rest of the World
- Competitive Landscape
- Competitor Comparison Analysis
- Market Developments
- Mergers and Acquisitions, Legal, Awards, Partnerships
- Product Launches and execution
- Vendor Profiles
- Adamis Pharmaceuticals Corporation
- Overview
- Product Offerings
- Geographic Revenue
- Business Units
- Developments
- Business Strategy
- ALK-Abell A/S
- Overview
- Product Offerings
- Geographic Revenue
- Business Units
- Developments
- Business Strategy
- IMPAX LABORATORIES, INC.
- Overview
- Product Offerings
- Geographic Revenue
- Business Units
- Developments
- Business Strategy
- LINCOLN MEDICAL CENTRE LTD.
- Overview
- Product Offerings
- Geographic Revenue
- Business Units
- Developments
- Business Strategy
- MYLAN N.V.
- Overview
- Product Offerings
- Geographic Revenue
- Business Units
- Developments
- Business Strategy
- ANTARES PHARMA
- Overview
- Product Offerings
- Geographic Revenue
- Business Units
- Developments
- Business Strategy
- ADAMIS PHARMACEUTICALS CORPORATION
- Overview
- Product Offerings
- Geographic Revenue
- Business Units
- Developments
- Business Strategy
- PFIZER INC.
- Overview
- Product Offerings
- Geographic Revenue
- Business Units
- Developments
- Business Strategy
- KALEO, INC.
- Overview
- Product Offerings
- Geographic Revenue
- Business Units
- Developments
- Business Strategy
- TEVA PHARMACEUTICAL INDUSTRIES LTD.
- Overview
- Product Offerings
- Geographic Revenue
- Business Units
- Developments
- Business Strategy
- Adamis Pharmaceuticals Corporation
- Companies to Watch
- Antares Pharma Inc.
- Overview
- Market
- Business Strategy
- Antares Pharma Inc.
- Analyst Opinion
- Annexure
- Report Scope
- Market Definitions
- Research Methodology
- Data Collation and In-house Estimation
- Market Triangulation
- Forecasting
- Report Assumptions
- Declarations
- Stakeholders
- Abbreviations
TABLE 1. GLOBAL EPINEPHRINE AUTO-INJECTORS MARKET VALUE, BY END-USER, 2020-2026 (USD MILLION)
TABLE 2. GLOBAL EPINEPHRINE AUTO-INJECTORS MARKET VALUE FOR HOSPITALS, BY GEOGRAPHY, 2020-2026 (USD MILLION)
TABLE 3. GLOBAL EPINEPHRINE AUTO-INJECTORS MARKET VALUE FOR CLINICS, BY GEOGRAPHY, 2020-2026 (USD MILLION)
TABLE 4. GLOBAL EPINEPHRINE AUTO-INJECTORS MARKET VALUE FOR HOME BASED, BY GEOGRAPHY, 2020-2026 (USD MILLION)
TABLE 5. GLOBAL EPINEPHRINE AUTO-INJECTORS MARKET VALUE FOR OTHERS, BY GEOGRAPHY 2020-2026 (USD MILLION)
TABLE 6. GLOBAL EPINEPHRINE AUTO-INJECTORS MARKET VALUE, BY DOSAGE, 2020-2026 (USD MILLION)
TABLE 7. GLOBAL EPINEPHRINE AUTO-INJECTORS MARKET VALUE FOR 0.15 MG, BY GEOGRAPHY 2020-2026 (USD MILLION)
TABLE 8. GLOBAL EPINEPHRINE AUTO-INJECTORS MARKET VALUE FOR 0.3 MG, BY GEOGRAPHY 2020-2026 (USD MILLION)
TABLE 9. GLOBAL EPINEPHRINE AUTO-INJECTORS MARKET VALUE FOR OTHERS, BY GEOGRAPHY 2020-2026 (USD MILLION)
TABLE 10. GLOBAL EPINEPHRINE AUTO-INJECTORS MARKET VALUE, BY AGE GROUP, 2020-2026 (USD MILLION)
TABLE 11. GLOBAL EPINEPHRINE AUTO-INJECTORS MARKET VALUE FOR 0-4 YEARS, BY GEOGRAPHY 2020-2026 (USD MILLION)
TABLE 12. GLOBAL EPINEPHRINE AUTO-INJECTORS MARKET VALUE FOR 5-14 YEARS, BY GEOGRAPHY 2020-2026 (USD MILLION)
TABLE 13. GLOBAL EPINEPHRINE AUTO-INJECTORS MARKET VALUE FOR 15-24 YEARS, BY GEOGRAPHY 2020-2026 (USD MILLION)
TABLE 14. GLOBAL EPINEPHRINE AUTO-INJECTORS MARKET VALUE FOR 25-49 YEARS, BY GEOGRAPHY 2020-2026 (USD MILLION)
TABLE 15. GLOBAL EPINEPHRINE AUTO-INJECTORS MARKET VALUE FOR 50-64 YEARS, BY GEOGRAPHY 2020-2026 (USD MILLION)
TABLE 16. GLOBAL EPINEPHRINE AUTO-INJECTORS MARKET VALUE FOR ABOVE 65 YEARS, BY GEOGRAPHY 2020-2026 (USD MILLION)
TABLE 17. NORTH AMERICA EPINEPHRINE AUTO-INJECTORS MARKET VALUE, BY COUNTRY, 2020-2026 (USD MILLION)
TABLE 18. NORTH AMERICA EPINEPHRINE AUTO-INJECTORS MARKET VALUE, BY END-USER, 2020-2026 (USD MILLION)
TABLE 19. NORTH AMERICA EPINEPHRINE AUTO-INJECTORS MARKET VALUE, BY DOSAGE, 2020-2026 (USD MILLION)
TABLE 20. NORTH AMERICA EPINEPHRINE AUTO-INJECTORS MARKET VALUE, BY AGE-GROUP, 2020-2026 (USD MILLION)
TABLE 21. U.S EPINEPHRINE AUTO-INJECTORS MARKET VALUE, BY END-USER, 2020-2026 (USD MILLION)
TABLE 22. U.S EPINEPHRINE AUTO-INJECTORS MARKET VALUE, BY DOSAGE, 2020-2026 (USD MILLION)
TABLE 23. U.S EPINEPHRINE AUTO-INJECTORS MARKET VALUE, BY AGE-GROUP, 2020-2026 (USD MILLION)
TABLE 24. CANADA EPINEPHRINE AUTO-INJECTORS MARKET VALUE, BY END-USER, 2020-2026 (USD MILLION)
TABLE 25. CANADA EPINEPHRINE AUTO-INJECTORS MARKET VALUE, BY DOSAGE, 2020-2026 (USD MILLION)
TABLE 26. CANADA EPINEPHRINE AUTO-INJECTORS MARKET VALUE, BY AGE-GROUP, 2020-2026 (USD MILLION)
TABLE 27. EUROPE EPINEPHRINE AUTO-INJECTORS MARKET VALUE, BY COUNTRY, 2020-2026 (USD MILLION)
TABLE 28. EUROPE EPINEPHRINE AUTO-INJECTORS MARKET VALUE, BY END-USER, 2020-2026 (USD MILLION)
TABLE 29. EUROPE EPINEPHRINE AUTO-INJECTORS MARKET VALUE, BY DOSAGE, 2020-2026 (USD MILLION)
TABLE 30. EUROPE EPINEPHRINE AUTO-INJECTORS MARKET VALUE, BY AGE GROUP, 2020-2026 (USD MILLION)
TABLE 31. GERMANY EPINEPHRINE AUTO-INJECTORS MARKET VALUE, BY END-USER, 2020-2026 (USD MILLION)
TABLE 32. GERMANY EPINEPHRINE AUTO-INJECTORS MARKET VALUE, BY DOSAGE, 2020-2026 (USD MILLION)
TABLE 33. GERMANY EPINEPHRINE AUTO-INJECTORS MARKET VALUE, BY AGE-GROUP, 2020-2026 (USD MILLION)
TABLE 34. U.K EPINEPHRINE AUTO-INJECTORS MARKET VALUE, BY END-USER, 2020-2026 (USD MILLION)
TABLE 35. U.K EPINEPHRINE AUTO-INJECTORS MARKET VALUE, BY DOSAGE, 2020-2026 (USD MILLION)
TABLE 36. U.K EPINEPHRINE AUTO-INJECTORS MARKET VALUE, BY AGE-GROUP, 2020-2026 (USD MILLION)
TABLE 37. FRANCE EPINEPHRINE AUTO-INJECTORS MARKET VALUE, BY END-USER, 2020-2026 (USD MILLION)
TABLE 38. FRANCE EPINEPHRINE AUTO-INJECTORS MARKET VALUE, BY DOSAGE, 2020-2026 (USD MILLION)
TABLE 39. FRANCE EPINEPHRINE AUTO-INJECTORS MARKET VALUE, BY AGE-GROUP, 2020-2026 (USD MILLION)
TABLE 40. ROE EPINEPHRINE AUTO-INJECTORS MARKET VALUE, BY END-USER, 2020-2026 (USD MILLION)
TABLE 41. ROE EPINEPHRINE AUTO-INJECTORS MARKET VALUE, BY DOSAGE, 2020-2026 (USD MILLION)
TABLE 42. ROE EPINEPHRINE AUTO-INJECTORS MARKET VALUE, BY AGE-GROUP, 2020-2026 (USD MILLION)
TABLE 43. ASIA PACIFIC EPINEPHRINE AUTO-INJECTORS MARKET VALUE, BY COUNTRY, 2020-2026 (USD MILLION)
TABLE 44. ASIA PACIFIC EPINEPHRINE AUTO-INJECTORS MARKET VALUE, BY END-USER, 2020-2026 (USD MILLION)
TABLE 45. ASIA PACIFIC EPINEPHRINE AUTO-INJECTORS MARKET VALUE, BY DOSAGE, 2020-2026 (USD MILLION)
TABLE 46. ASIA PACIFIC EPINEPHRINE AUTO-INJECTORS MARKET VALUE, BY AGE GROUP, 2020-2026 (USD MILLION)
TABLE 47. CHINA EPINEPHRINE AUTO-INJECTORS MARKET VALUE, BY END-USER, 2020-2026 (USD MILLION)
TABLE 48. CHINA EPINEPHRINE AUTO-INJECTORS MARKET VALUE, BY DOSAGE, 2020-2026 (USD MILLION)
TABLE 49. CHINA EPINEPHRINE AUTO-INJECTORS MARKET VALUE, BY AGE-GROUP, 2020-2026 (USD MILLION)
TABLE 50. INDIA EPINEPHRINE AUTO-INJECTORS MARKET VALUE, BY END-USER, 2020-2026 (USD MILLION)
TABLE 51. INDIA EPINEPHRINE AUTO-INJECTORS MARKET VALUE, BY DOSAGE, 2020-2026 (USD MILLION)
TABLE 52. INDIA EPINEPHRINE AUTO-INJECTORS MARKET VALUE, BY AGE-GROUP, 2020-2026 (USD MILLION)
TABLE 53. JAPAN EPINEPHRINE AUTO-INJECTORS MARKET VALUE, BY END-USER, 2020-2026 (USD MILLION)
TABLE 54. JAPAN EPINEPHRINE AUTO-INJECTORS MARKET VALUE, BY DOSAGE, 2020-2026 (USD MILLION)
TABLE 55. JAPAN EPINEPHRINE AUTO-INJECTORS MARKET VALUE, BY AGE-GROUP, 2020-2026 (USD MILLION)
TABLE 56. ROAPAC EPINEPHRINE AUTO-INJECTORS MARKET VALUE, BY END-USER, 2020-2026 (USD MILLION)
TABLE 57. ROAPAC EPINEPHRINE AUTO-INJECTORS MARKET VALUE, BY DOSAGE, 2020-2026 (USD MILLION)
TABLE 58. ROAPAC EPINEPHRINE AUTO-INJECTORS MARKET VALUE, BY AGE-GROUP, 2020-2026 (USD MILLION)
TABLE 59. REST OF WORLD EPINEPHRINE AUTO-INJECTORS MARKET VALUE, BY END-USER, 2020-2026 (USD MILLION)
TABLE 60. REST OF WORLD EPINEPHRINE AUTO-INJECTORS MARKET VALUE, BY DOSAGE, 2020-2026 (USD MILLION)
TABLE 61. REST OF WORLD EPINEPHRINE AUTO-INJECTORS MARKET VALUE, BY AGE GROUP, 2020-2026 (USD MILLION)
TABLE 62. TEVA PHARMACEUTICAL INDUSTRIES LTD.: OVERVIEW
TABLE 63. TEVA PHARMACEUTICAL INDUSTRIES LTD.: STRATEGIC SNAPSHOT
TABLE 64. TEVA PHARMACEUTICAL INDUSTRIES LTD.: BUSINESS FOCUS
TABLE 65. TEVA PHARMACEUTICAL INDUSTRIES LTD.: APPLICATION/SERVICE PORTFOLIO
TABLE 66. IMPAX LABORATORIES, INC.: OVERVIEW
TABLE 67. IMPAX LABORATORIES, INC.: STRATEGIC SNAPSHOT
TABLE 68. IMPAX LABORATORIES, INC.: BUSINESS FOCUS
TABLE 69. IMPAX LABORATORIES, INC.: APPLICATION/SERVICE PORTFOLIO
TABLE 70. BAUSCH & LOMB INCORPORATED: OVERVIEW
TABLE 71. BAUSCH & LOMB INCORPORATED: STRATEGIC SNAPSHOT
TABLE 72. BAUSCH & LOMB INCORPORATED: BUSINESS FOCUS
TABLE 73. BAUSCH & LOMB INCORPORATED: APPLICATION/SERVICE PORTFOLIO
TABLE 74. KALEO, INC.: OVERVIEW
TABLE 75. KALEO, INC.: STRATEGIC SNAPSHOT
TABLE 76. KALEO, INC.: BUSINESS FOCUS
TABLE 77. KALEO, INC.: APPLICATION/SERVICE PORTFOLIO
TABLE 78. MYLAN N.V.: OVERVIEW
TABLE 79. MYLAN N.V.: STRATEGIC SNAPSHOT
TABLE 80. MYLAN N.V.: BUSINESS FOCUS
TABLE 81. MYLAN N.V.: APPLICATION/SERVICE PORTFOLIO
TABLE 82. LINCOLN MEDICAL CENTRE LTD.: OVERVIEW
TABLE 83. LINCOLN MEDICAL CENTRE LTD.: STRATEGIC SNAPSHOT
TABLE 84. LINCOLN MEDICAL CENTRE LTD.: BUSINESS FOCUS
TABLE 85. LINCOLN MEDICAL CENTRE LTD.: APPLICATION/SERVICE PORTFOLIO
TABLE 86. ADAMIS PHARMACEUTICALS CORPORATION: OVERVIEW
TABLE 87. ADAMIS PHARMACEUTICALS CORPORATION: STRATEGIC SNAPSHOT
TABLE 88. ADAMIS PHARMACEUTICALS CORPORATION: BUSINESS FOCUS
TABLE 89. ADAMIS PHARMACEUTICALS CORPORATION: APPLICATION/SERVICE PORTFOLIO
Research Framework
Infoholic Research works on a holistic 360° approach in order to deliver high quality, validated and reliable information in our market reports. The Market estimation and forecasting involves following steps:
- Data Collation (Primary & Secondary)
- In-house Estimation (Based on proprietary data bases and Models)
- Market Triangulation
- Forecasting

Market related information is congregated from both primary and secondary sources.
Primary sources
Involved participants from all global stakeholders such as Solution providers, service providers, Industry associations, thought leaders etc. across levels such as CXOs, VPs and managers. Plus, our in-house industry experts having decades of industry experience contribute their consulting and advisory services.
Secondary sources
Include public sources such as regulatory frameworks, government IT spending, government demographic indicators, industry association statistics, and company publications along with paid sources such as Factiva, OneSource, Bloomberg among others.
![]()


