
Environmental Health and Safety Market By Product (Software and Services), Application (Medical & Pharmaceutical Waste Management, Industrial Waste Management, Wastewater Management, and Others), End-Use (Chemicals & Petrochemicals, Energy & Mining, Healthcare, Telecom & IT, Construction, Manufacturing, and Others) and Geography–Global Forecast to 2027
- July, 2021
- Domain: ICT - Software & Services
- Get Free 10% Customization in this Report
Environmental health and safety are software that comprises a database driven by enterprise software applications that cover data from various fields of occupational health and medical safety, environment & waste management, and industrial hygiene. Environmental health and safety software offers a platform for several businesses to safeguard the health and safety of their employees from possible risks in the workplace. It also assists organizations in complying with present health and safety rules and regulations. The rising stringent health, safety, and environmental laws, regulations, guidelines, and processes instigated in the last few years among leading chemical-producing countries is the primary factor propelling the growing implementation of EHS tools across the industrial sector. Companies diligently sticking to the environment and resource-friendly manufacturing practices are increasingly investing in the employment of effective EHS tools. Factors including the high costs included in auditing complex production sites and the most expensive services and solutions required to comply with EHS regulations are projected to hinder the market growth. The Environmental Health and Safety Market is estimated to grow at the rate of 6.10% CAGR by 2027.
Research Methodology:
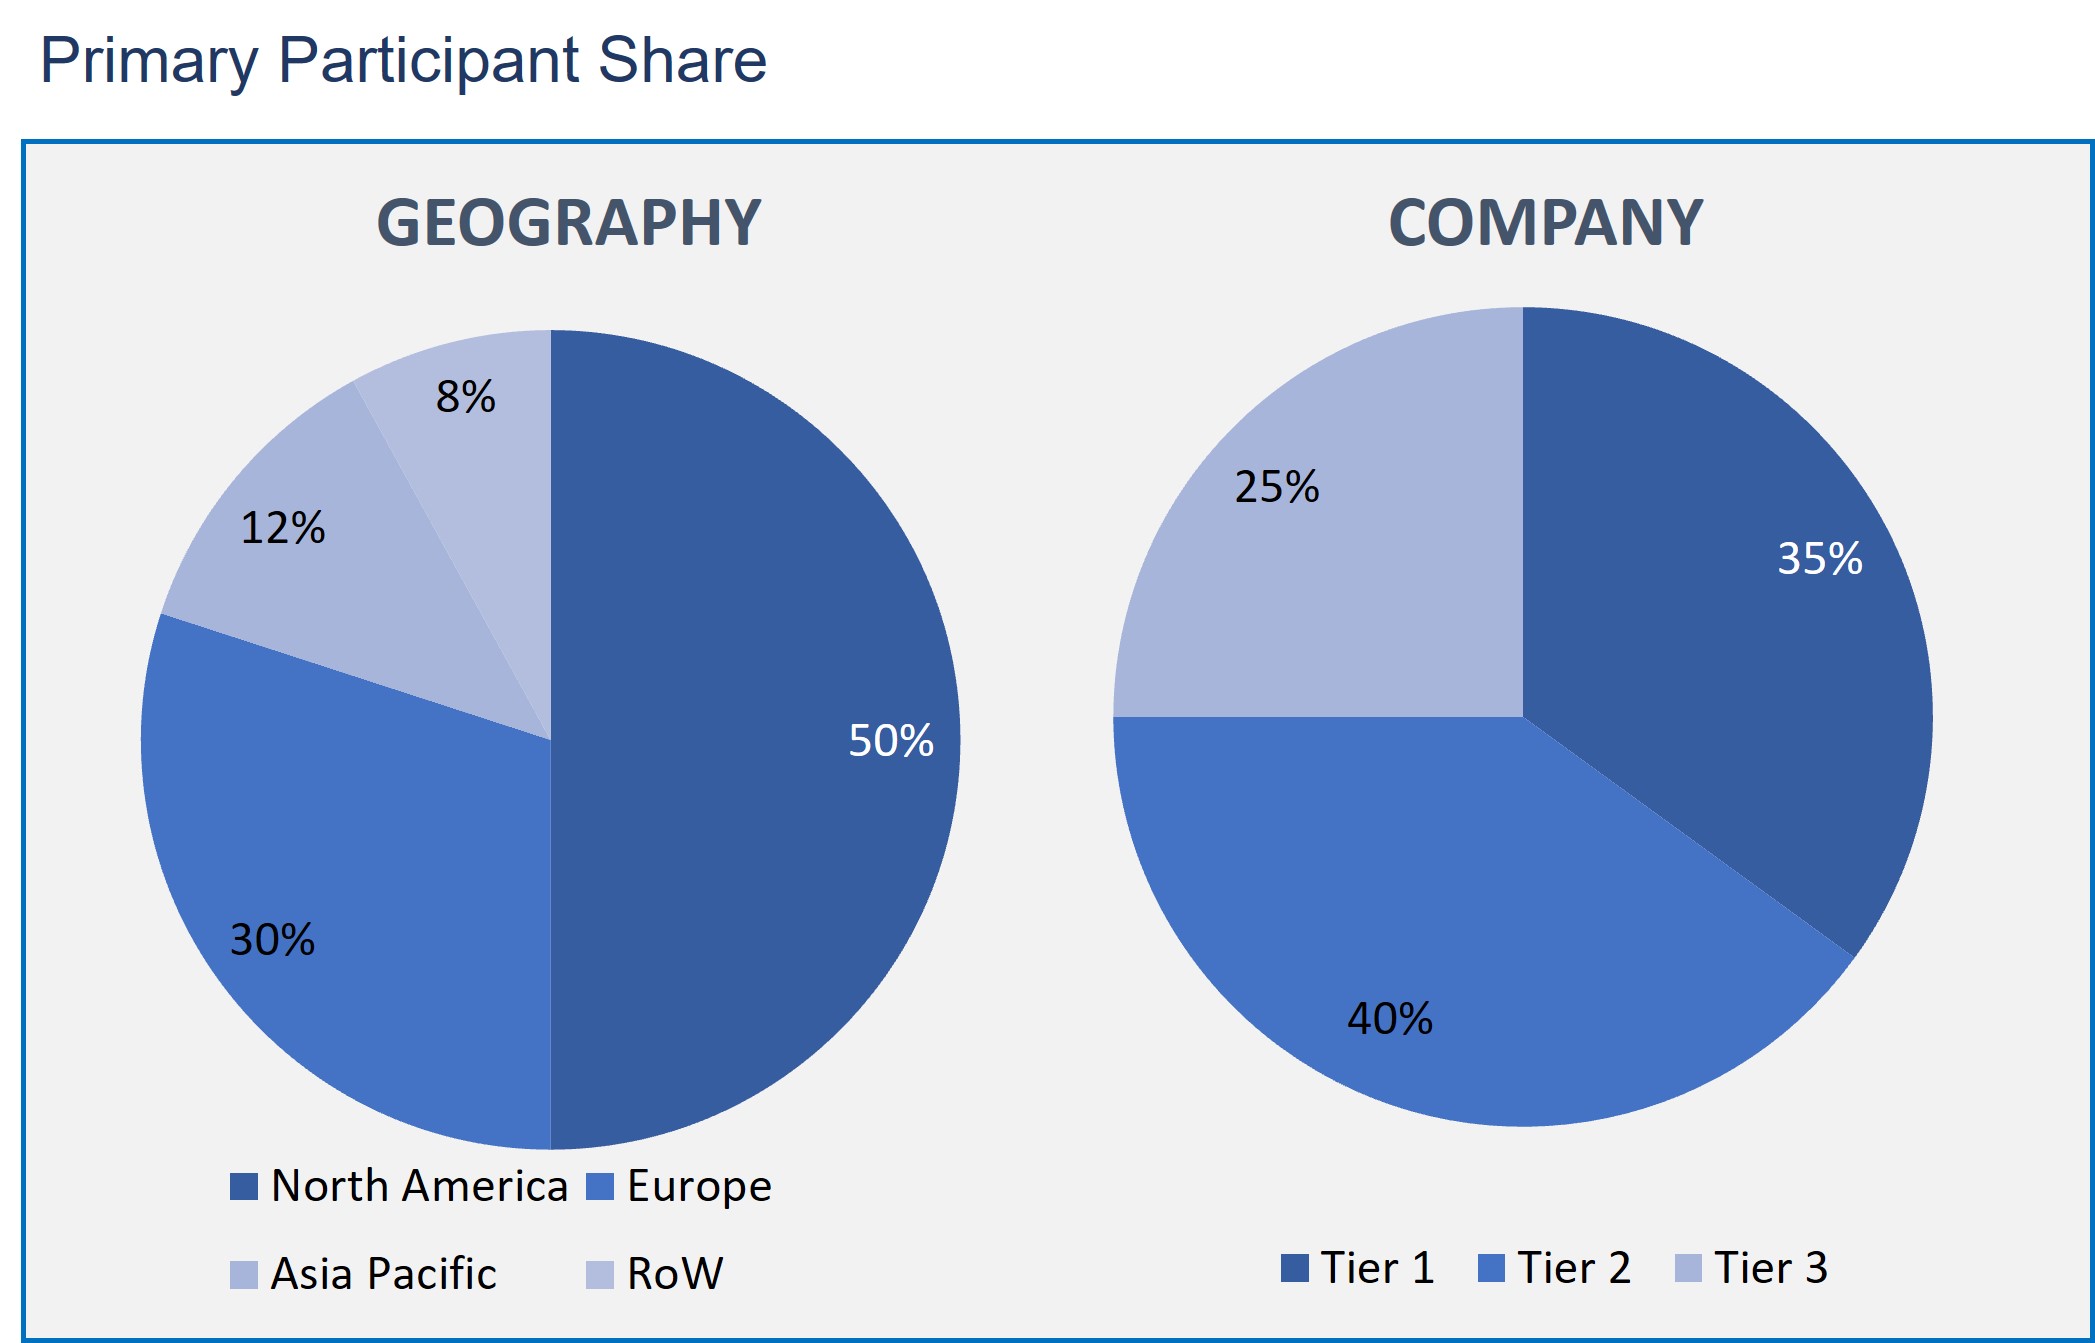
The Environmental Health and Safety Market has been analyzed by utilizing the optimum combination of secondary sources and in-house methodology and a unique balance of primary insights. The real-time valuation of the market is an integral part of our forecasting and market sizing methodology. Industry experts and our primary participants have helped to compile related aspects with accurate parametric estimations for a complete study. The primary participants share is given below:
Environmental Health and Safety Market by Product
- Software
- Services
Environmental Health and Safety Market by Application
- Medical & Pharmaceutical Waste Management
- Industrial Waste Management
- Wastewater Management
- Others
Environmental Health and Safety Market by End-Use
- Chemicals & Petrochemicals
- Energy & Mining
- Healthcare
- Telecom & IT
- Construction
- Manufacturing
- Others
Environmental Health and Safety Market by Geography
- North America
- Europe
- Asia Pacific
- Rest of the World
As in the market by products, the service segment has the maximum share of the market. Since the EHS services help mining companies by rendering technical and regulatory advice and site auditing while in the exploration and drilling process. Environmental health and safety service providers also support clients by identifying and reporting the essential improvements for a better output with less environmental impact.
The environmental health and safety market is further based on application, where the industrial waste segment accounted for a substantial share in the market. This is due to the presence of stringent international regulations about industrial waste transportation and disposal. Moreover, the rising prevalence of accidents and diseases owing to the improper disposal of toxic materials is estimated to drive the demand in the segment.
As per the end-user, the demand for environmental health and safety is expected to increase across verticals in the forecasted period. The growth is ascribed to its wide application in enhancing cybersecurity systems, data centers, utility systems, industrial waste, wastewater treatment plants, and solid waste landfills. Expansion of the manufacturing industry in the emerging countries of Asia Pacific is expected to drive the demand for environmental health and safety services and software.
According to the geographical market, North America is projected to hold a significant part of the global market share over the forecast period. North America is a developed region with established infrastructures that favor the players to generate a huge demand for environmental health and safety solutions.
Rising public consciousness about the world's environmental issues has resulted in the development of environment protection rules and regulations, which is anticipated to propel the global market growth during the forecast period. Additionally, an advanced integration of technological trends such as mobility, big data, the internet of things, and data analytics is estimated to fuel the demand for the EHS software. The increase in strict government regulations in few regions further fuelled the demand for environmental health and safety.
Enablon North America Corp., Intelex Technologies Inc., Gensuite LLC, Cority Software Inc., Quentic GmbH, Sphera Solutions, SAP ERP, Cority Software Inc., Medgate Inc, SAI Global Ltd, and Dakota Software Inc are the companies featured in the market report.
Henceforth, the environmental health and safety management system protocols are prominent as they prevent many illnesses, injuries, and environmental hazards in the industrial workplace. Moreover, the environmental health and safety software provides various benefits to the company and employees.
- The report includes prominent information relating to the manufacturers, key market segments, product range provided in the market, years taken, and study objectives.
- Furthermore, the report also throws light on all market segments, including the product, applications, and end-user.
- The report provides a detailed valuation of the past research, competitive outlook, drivers, constraints, trends, challenges, and other micro and macroeconomic indicators.
- Each leading company in the Environment, Health, and Safety (EHS) competitive landscape has been profiled in the report in terms of their product offerings and developments, mergers, acquisitions, and the players' SWOT analysis.
- Executive Summary
- Industry Outlook
- Industry Overview
- Industry Trends
- Market Snapshot
- Market Definition
- Market Outlook
- Porter Five Forces
- Related Markets
- Market characteristics
- Market Overview
- Market Segmentation
- Market Dynamics
- Drivers
- Restraints
- Opportunities
- DRO - Impact Analysis
- Product: Market Size & Analysis
- Overview
- Software
- Services
- Application: Market Size & Analysis
- Overview
- Medical & Pharmaceutical Waste Management
- Industrial Waste Management
- Wastewater Management
- Others
- End-Use: Market Size & Analysis
- Overview
- Chemicals & Petrochemicals
- Energy & Mining
- Healthcare
- Telecom & IT
- Construction
- Manufacturing
- Others
- Geography: Market Size & Analysis
- Overview
- North America
- Europe
- Asia Pacific
- Rest of the World
- Competitive Landscape
- Competitor Comparison Analysis
- Market Developments
- Mergers and Acquisitions, Legal, Awards, Partnerships
- Product Launches and execution
- Vendor Profiles
- Enablon North America Corp.
- Overview
- Financial Overview
- Product Offerings
- Developments
- Business Strategy
- Intelex Technologies Inc.
- Overview
- Financial Overview
- Product Offerings
- Developments
- Business Strategy
- Gensuite LLC
- Overview
- Financial Overview
- Product Offerings
- Developments
- Business Strategy
- Cority Software Inc.
- Overview
- Financial Overview
- Product Offerings
- Developments
- Business Strategy
- Quentic GmbH
- Overview
- Financial Overview
- Product Offerings
- Developments
- Business Strategy
- Sphera Solutions
- Overview
- Financial Overview
- Product Offerings
- Developments
- Business Strategy
- SAP ERP
- Overview
- Financial Overview
- Product Offerings
- Developments
- Business Strategy
- Medgate Inc
- Overview
- Financial Overview
- Product Offerings
- Developments
- Business Strategy
- SAI Global Ltd
- Overview
- Financial Overview
- Product Offerings
- Developments
- Business Strategy
- Dakota Software Inc
- Overview
- Financial Overview
- Product Offerings
- Developments
- Business Strategy
- Enablon North America Corp.
- Analyst Opinion
- Annexure
- Report Scope
- Market Definitions
- Research Methodology
- Data Collation and In-house Estimation
- Market Triangulation
- Forecasting
- Report Assumptions
- Declarations
- Stakeholders
- Abbreviations
TABLE 1. GLOBAL ENVIRONMENTAL HEALTH AND SAFETY MARKET VALUE, BY PRODUCT, 2021-2027 (USD BILLION)
TABLE 2. GLOBAL ENVIRONMENTAL HEALTH AND SAFETY MARKET VALUE FOR SOFTWARE, BY GEOGRAPHY, 2021-2027 (USD BILLION)
TABLE 3. GLOBAL ENVIRONMENTAL HEALTH AND SAFETY MARKET VALUE FOR SERVICES, BY GEOGRAPHY, 2021-2027 (USD BILLION)
TABLE 4. GLOBAL ENVIRONMENTAL HEALTH AND SAFETY MARKET VALUE, BY APPLICATION, BY GEOGRAPHY, 2021-2027 (USD BILLION)
TABLE 5. GLOBAL ENVIRONMENTAL HEALTH AND SAFETY MARKET VALUE FOR MEDICAL & PHARMACEUTICAL WASTE MANAGEMENT, BY GEOGRAPHY, 2021-2027 (USD BILLION)
TABLE 6. GLOBAL ENVIRONMENTAL HEALTH AND SAFETY MARKET VALUE FOR INDUSTRIAL WASTE MANAGEMENT, BY GEOGRAPHY, 2021-2027 (USD BILLION)
TABLE 7. GLOBAL ENVIRONMENTAL HEALTH AND SAFETY MARKET VALUE FOR WASTEWATER MANAGEMENT, BY GEOGRAPHY, 2021-2027 (USD BILLION)
TABLE 8. GLOBAL ENVIRONMENTAL HEALTH AND SAFETY MARKET VALUE FOR OTHERS, BY GEOGRAPHY, 2021-2027 (USD BILLION)
TABLE 9. GLOBAL ENVIRONMENTAL HEALTH AND SAFETY MARKET VALUE, BY END-USE, 2021-2027 (USD BILLION)
TABLE 10. GLOBAL ENVIRONMENTAL HEALTH AND SAFETY MARKET VALUE FOR CHEMICALS & PETROCHEMICALS, BY GEOGRAPHY, 2021-2027 (USD BILLION)
TABLE 11. GLOBAL ENVIRONMENTAL HEALTH AND SAFETY MARKET VALUE FOR ENERGY & MINING, BY GEOGRAPHY, 2021-2027 (USD BILLION)
TABLE 12. GLOBAL ENVIRONMENTAL HEALTH AND SAFETY MARKET VALUE FOR HEALTHCARE, BY GEOGRAPHY, 2021-2027 (USD BILLION)
TABLE 13. GLOBAL ENVIRONMENTAL HEALTH AND SAFETY MARKET VALUE FOR TELECOM & IT, BY GEOGRAPHY, 2021-2027 (USD BILLION)
TABLE 14. GLOBAL ENVIRONMENTAL HEALTH AND SAFETY MARKET VALUE FOR CONSTRUCTION, BY GEOGRAPHY, 2021-2027 (USD BILLION)
TABLE 15. GLOBAL ENVIRONMENTAL HEALTH AND SAFETY MARKET VALUE FOR MANUFACTURING, BY GEOGRAPHY, 2021-2027 (USD BILLION)
TABLE 16. GLOBAL ENVIRONMENTAL HEALTH AND SAFETY MARKET VALUE FOR OTHERS, BY GEOGRAPHY, 2021-2027 (USD BILLION)
TABLE 17. NORTH AMERICA ENVIRONMENTAL HEALTH AND SAFETY MARKET VALUE, BY COUNTRY, 2021-2027 (USD BILLION)
TABLE 18. NORTH AMERICA ENVIRONMENTAL HEALTH AND SAFETY MARKET VALUE, BY PRODUCT, 2021-2027 (USD BILLION)
TABLE 19. NORTH AMERICA ENVIRONMENTAL HEALTH AND SAFETY MARKET VALUE, BY APPLICATION, 2021-2027 (USD BILLION)
TABLE 20. NORTH AMERICA ENVIRONMENTAL HEALTH AND SAFETY MARKET VALUE, BY END-USE, 2021-2027 (USD BILLION)
TABLE 21. U.S ENVIRONMENTAL HEALTH AND SAFETY MARKET VALUE, BY PRODUCT, 2021-2027 (USD BILLION)
TABLE 22. U.S ENVIRONMENTAL HEALTH AND SAFETY MARKET VALUE, BY APPLICATION, 2021-2027 (USD BILLION)
TABLE 23. U.S ENVIRONMENTAL HEALTH AND SAFETY MARKET VALUE, BY END-USE, 2021-2027 (USD BILLION)
TABLE 24. CANADA ENVIRONMENTAL HEALTH AND SAFETY MARKET VALUE, BY PRODUCT, 2021-2027 (USD BILLION)
TABLE 25. CANADA ENVIRONMENTAL HEALTH AND SAFETY MARKET VALUE, BY APPLICATION, 2021-2027 (USD BILLION)
TABLE 26. CANADA ENVIRONMENTAL HEALTH AND SAFETY MARKET VALUE, BY END-USE, 2021-2027 (USD BILLION)
TABLE 27. EUROPE ENVIRONMENTAL HEALTH AND SAFETY MARKET VALUE, BY COUNTRY, 2021-2027 (USD BILLION)
TABLE 28. EUROPE ENVIRONMENTAL HEALTH AND SAFETY MARKET VALUE, BY PRODUCT, 2021-2027 (USD BILLION)
TABLE 29. EUROPE ENVIRONMENTAL HEALTH AND SAFETY MARKET VALUE, BY APPLICATION, 2021-2027 (USD BILLION)
TABLE 30. EUROPE ENVIRONMENTAL HEALTH AND SAFETY MARKET VALUE, END-USE, 2021-2027 (USD BILLION)
TABLE 31. GERMANY ENVIRONMENTAL HEALTH AND SAFETY MARKET VALUE, BY PRODUCT, 2021-2027 (USD BILLION)
TABLE 32. GERMANY ENVIRONMENTAL HEALTH AND SAFETY MARKET VALUE, BY APPLICATION, 2021-2027 (USD BILLION)
TABLE 33. GERMANY ENVIRONMENTAL HEALTH AND SAFETY MARKET VALUE, BY END-USE, 2021-2027 (USD BILLION)
TABLE 34. U.K ENVIRONMENTAL HEALTH AND SAFETY MARKET VALUE, BY PRODUCT, 2021-2027 (USD BILLION)
TABLE 35. U.K ENVIRONMENTAL HEALTH AND SAFETY MARKET VALUE, BY APPLICATION, 2021-2027 (USD BILLION)
TABLE 36. U.K ENVIRONMENTAL HEALTH AND SAFETY MARKET VALUE, BY END-USE, 2021-2027 (USD BILLION)
TABLE 37. FRANCE ENVIRONMENTAL HEALTH AND SAFETY MARKET VALUE, BY PRODUCT, 2021-2027 (USD BILLION)
TABLE 38. FRANCE ENVIRONMENTAL HEALTH AND SAFETY MARKET VALUE, BY APPLICATION, 2021-2027 (USD BILLION)
TABLE 39. FRANCE ENVIRONMENTAL HEALTH AND SAFETY MARKET VALUE, BY END-USE, 2021-2027 (USD BILLION)
TABLE 40. ITALY ENVIRONMENTAL HEALTH AND SAFETY MARKET VALUE, BY PRODUCT, 2021-2027 (USD BILLION)
TABLE 41. ITALY ENVIRONMENTAL HEALTH AND SAFETY MARKET VALUE, BY APPLICATION, 2021-2027 (USD BILLION)
TABLE 42. ITALY ENVIRONMENTAL HEALTH AND SAFETY MARKET VALUE, BY END-USE, 2021-2027 (USD BILLION)
TABLE 43. SPAIN ENVIRONMENTAL HEALTH AND SAFETY MARKET VALUE, BY PRODUCT, 2021-2027 (USD BILLION)
TABLE 44. SPAIN ENVIRONMENTAL HEALTH AND SAFETY MARKET VALUE, BY APPLICATION, 2021-2027 (USD BILLION)
TABLE 45. SPAIN ENVIRONMENTAL HEALTH AND SAFETY MARKET VALUE, BY END-USE, 2021-2027 (USD BILLION)
TABLE 46. ROE ENVIRONMENTAL HEALTH AND SAFETY MARKET VALUE, BY PRODUCT, 2021-2027 (USD BILLION)
TABLE 47. ROE ENVIRONMENTAL HEALTH AND SAFETY MARKET VALUE, BY APPLICATION, 2021-2027 (USD BILLION)
TABLE 48. ROE ENVIRONMENTAL HEALTH AND SAFETY MARKET VALUE, BY END-USE, 2021-2027 (USD BILLION)
TABLE 49. ASIA PACIFIC ENVIRONMENTAL HEALTH AND SAFETY MARKET VALUE, BY COUNTRY, 2021-2027 (USD BILLION)
TABLE 50. ASIA PACIFIC ENVIRONMENTAL HEALTH AND SAFETY MARKET VALUE, BY PRODUCT, 2021-2027 (USD BILLION)
TABLE 51. ASIA PACIFIC ENVIRONMENTAL HEALTH AND SAFETY MARKET VALUE, BY APPLICATION, 2021-2027 (USD BILLION)
TABLE 52. ASIA PACIFIC ENVIRONMENTAL HEALTH AND SAFETY MARKET VALUE, BY END-USE, 2021-2027 (USD BILLION)
TABLE 53. CHINA ENVIRONMENTAL HEALTH AND SAFETY MARKET VALUE, BY PRODUCT, 2021-2027 (USD BILLION)
TABLE 54. CHINA ENVIRONMENTAL HEALTH AND SAFETY MARKET VALUE, BY APPLICATION, 2021-2027 (USD BILLION)
TABLE 55. CHINA ENVIRONMENTAL HEALTH AND SAFETY MARKET VALUE, BY END-USE, 2021-2027 (USD BILLION)
TABLE 56. INDIA ENVIRONMENTAL HEALTH AND SAFETY MARKET VALUE, BY PRODUCT, 2021-2027 (USD BILLION)
TABLE 57. INDIA ENVIRONMENTAL HEALTH AND SAFETY MARKET VALUE, BY APPLICATION, 2021-2027 (USD BILLION)
TABLE 58. INDIA ENVIRONMENTAL HEALTH AND SAFETY MARKET VALUE, BY END-USE, 2021-2027 (USD BILLION)
TABLE 59. JAPAN ENVIRONMENTAL HEALTH AND SAFETY MARKET VALUE, BY PRODUCT, 2021-2027 (USD BILLION)
TABLE 60. JAPAN ENVIRONMENTAL HEALTH AND SAFETY MARKET VALUE, BY APPLICATION, 2021-2027 (USD BILLION)
TABLE 61. JAPAN ENVIRONMENTAL HEALTH AND SAFETY MARKET VALUE, BY END-USE, 2021-2027 (USD BILLION)
TABLE 62. REST OF APAC ENVIRONMENTAL HEALTH AND SAFETY MARKET VALUE, BY PRODUCT, 2021-2027 (USD BILLION)
TABLE 63. REST OF APAC ENVIRONMENTAL HEALTH AND SAFETY MARKET VALUE, BY APPLICATION, 2021-2027 (USD BILLION)
TABLE 64. REST OF APAC ENVIRONMENTAL HEALTH AND SAFETY MARKET VALUE, BY END-USE, 2021-2027 (USD BILLION)
TABLE 65. REST OF WORLD ENVIRONMENTAL HEALTH AND SAFETY MARKET VALUE, BY PRODUCT, 2021-2027 (USD BILLION)
TABLE 66. REST OF WORLD ENVIRONMENTAL HEALTH AND SAFETY MARKET VALUE, BY APPLICATION, 2021-2027 (USD BILLION)
TABLE 67. REST OF WORLD ENVIRONMENTAL HEALTH AND SAFETY MARKET VALUE, BY END-USE, 2021-2027 (USD BILLION)
TABLE 68. ENABLON NORTH AMERICA CORP: FINANCIALS
TABLE 69. ENABLON NORTH AMERICA CORP: PRODUCTS & SERVICES
TABLE 70. ENABLON NORTH AMERICA CORP: RECENT DEVELOPMENTS
TABLE 71. INTELEX TECHNOLOGIES INC: FINANCIALS
TABLE 72. INTELEX TECHNOLOGIES INC: PRODUCTS & SERVICES
TABLE 73. INTELEX TECHNOLOGIES INC: RECENT DEVELOPMENTS
TABLE 74. GENSUITE LLC: FINANCIALS
TABLE 75. GENSUITE LLC: PRODUCTS & SERVICES
TABLE 76. GENSUITE LLC: RECENT DEVELOPMENTS
TABLE 77. CORITY SOFTWARE INC: FINANCIALS
TABLE 78. CORITY SOFTWARE INC: PRODUCTS & SERVICES
TABLE 79. CORITY SOFTWARE INC: RECENT DEVELOPMENTS
TABLE 80. QUENTIC GMBH: FINANCIALS
TABLE 81. QUENTIC GMBH: PRODUCTS & SERVICES
TABLE 82. QUENTIC GMBH: RECENT DEVELOPMENTS
TABLE 83. SPHERA SOLUTIONS: FINANCIALS
TABLE 84. SPHERA SOLUTIONS: PRODUCTS & SERVICES
TABLE 85. SPHERA SOLUTIONS: RECENT DEVELOPMENTS
TABLE 86. SAP ERP: FINANCIALS
TABLE 87. SAP ERP: PRODUCTS & SERVICES
TABLE 88. SAP ERP: RECENT DEVELOPMENTS
TABLE 89. Medgate Inc: FINANCIALS
TABLE 90. Medgate Inc: PRODUCTS & SERVICES
TABLE 91. Medgate Inc: RECENT DEVELOPMENTS
TABLE 92. SAI GLOBAL LTD: FINANCIALS
TABLE 93. SAI GLOBAL LTD: PRODUCTS & SERVICES
TABLE 94. SAI GLOBAL LTD: RECENT DEVELOPMENTS
TABLE 95. DAKOTA SOFTWARE INC: FINANCIALS
TABLE 96. DAKOTA SOFTWARE INC: PRODUCTS & SERVICES
TABLE 97. DAKOTA SOFTWARE INC: RECENT DEVELOPMENTS
Research Framework
Infoholic Research works on a holistic 360° approach in order to deliver high quality, validated and reliable information in our market reports. The Market estimation and forecasting involves following steps:
- Data Collation (Primary & Secondary)
- In-house Estimation (Based on proprietary data bases and Models)
- Market Triangulation
- Forecasting

Market related information is congregated from both primary and secondary sources.
Primary sources
Involved participants from all global stakeholders such as Solution providers, service providers, Industry associations, thought leaders etc. across levels such as CXOs, VPs and managers. Plus, our in-house industry experts having decades of industry experience contribute their consulting and advisory services.
Secondary sources
Include public sources such as regulatory frameworks, government IT spending, government demographic indicators, industry association statistics, and company publications along with paid sources such as Factiva, OneSource, Bloomberg among others.
![]()


