
Enterprise Networking Market by Component (Product and Service), Deployment Mode (On-Premise and Cloud), Application (Banking, Financial Services and Insurance (BFSI), Media and Communication, Healthcare, Aerospace and Defense, Transportation and Logistics, Government and Utilities and Others) and Geography – Global Forecast up to 2026
- April, 2021
- Domain: ICT - digital technologies
- Get Free 10% Customization in this Report
The growing need for enterprises to become digital to continue competitiveness is anticipated to raise the impetus for agile networking and growth the value and importance of virtual and software-defined networking. Companies are concentrating on upgrading their networks to increase wireless capacity. Furthermore, they are spending money to modernize their system, which is anticipated to fuel enterprise network demand over the estimated period. The industry is expected to witness development due to ongoing technological revolutions in wireless LAN technology and high-speed Ethernet switches. This technology is crucial for the development of smaller and efficient chipsets and modules with added functions. Escalating needs for the execution of high-speed Ethernet switches are anticipated to provide new development avenues over the next eight years. Organizations are overhauling their networks to focus on refining efficiency and responsiveness of business, enabling mobile productivity, and leveraging big data. The Enterprise Networking Market is anticipated to grow at the rate of 6.36% CAGR by 2026.
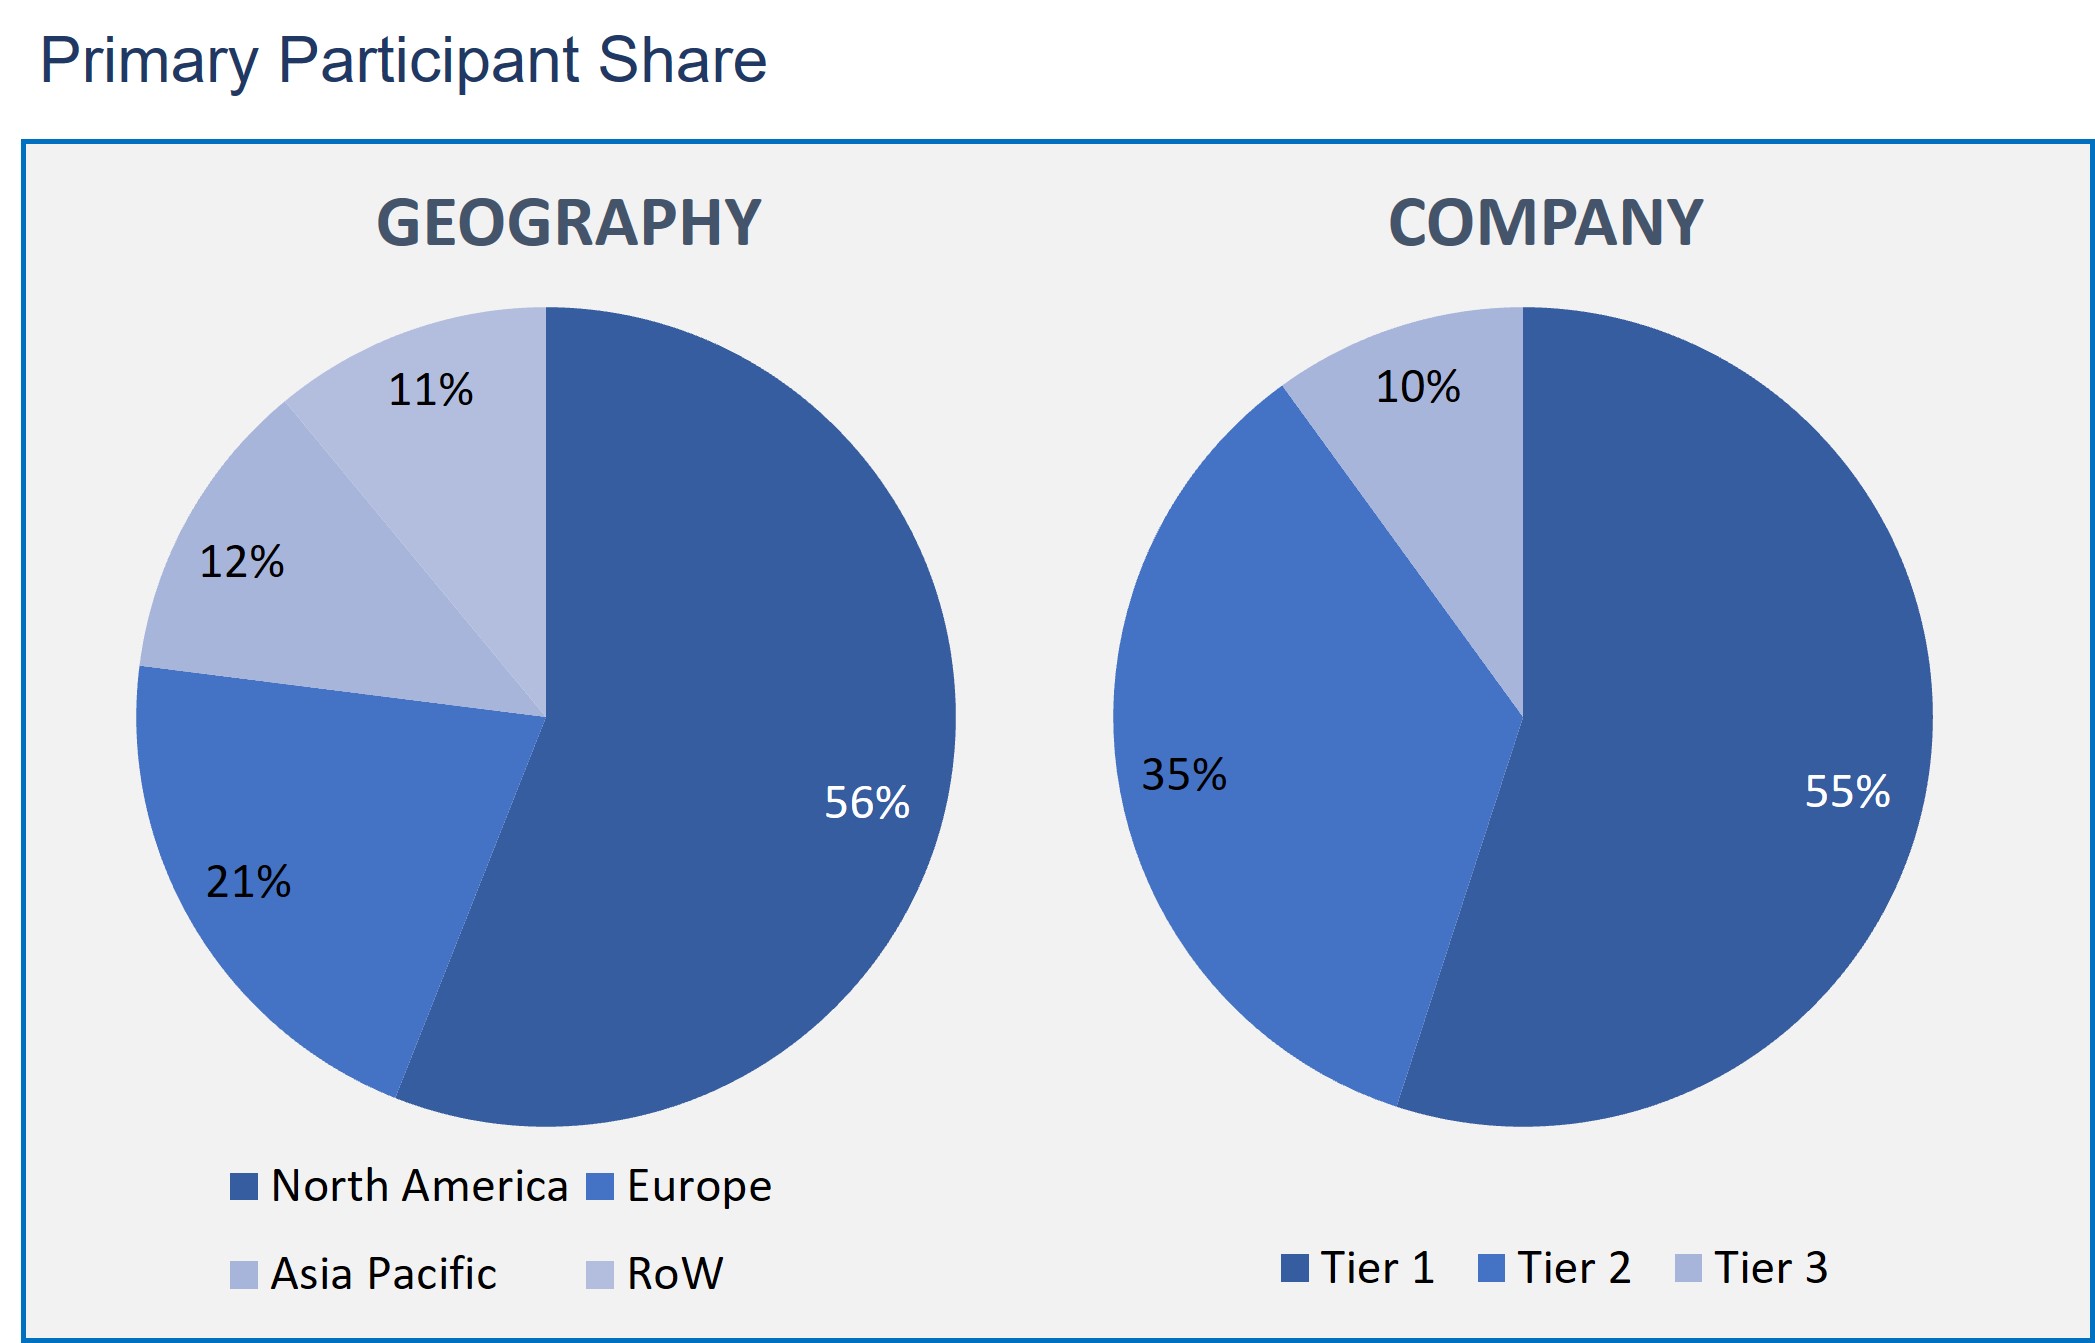
Research Methodology:
The Enterprise Networking market is analyzed by utilizing the optimum combination of secondary sources and in-house methodology and a unique balance of primary insights. The real-time valuation of the market is an integral part of our forecasting and market sizing methodology. Industry experts and our primary participants have helped to compile related aspects with accurate parametric estimations for a complete study. The primary participants share is given below:
The Enterprise Networking Market based on Component
- Product
- Switches
- Network Security
- Service
- Training & Consulting
- Integration & Maintenance
- Managed Service
The Enterprise Networking Market based on Deployment Mode
- On-Premise
- Cloud
The Enterprise Networking Market based on Application
- Banking, Financial Services and Insurance (BFSI)
- Media and Communication
- Healthcare
- Aerospace and Defense
- Transportation and Logistics
- Government and Utilities
- Others
Enterprise Networking Market by Geography
- North America
- Europe
- Asia Pacific
- Rest of the World
In the component market, the services segment is estimated to have a lucrative growth rate. They are owing to the rising requirement of services such as training and consulting, integration and maintenance, and managed services. The integration and maintenance services segment has a huge demand in the market since these services assist service providers and customers of enterprises in upgrading, integrating, and building progressive networks for cloud network function virtualization environments. Since enterprise networks turn out to be complicated, the requirement for system integration services will boost the interoperability in multi-vendor and multi-network environments.
As per the deployment mode, the on-premise deployment mode has a maximum portion of the enterprise networking market share. To efficiently deploy network monitoring and management solutions, most enterprises are deploying the on-premise deployment approach, offering better management over network resources and better security. Enterprises choose to keep their data local to prevent cyber-attacks and theft of data, fueling the adoption of on-premise deployment mode.
The BFSI segment is holding the major share in the enterprise networking market as per the application. This is due to the increasing deployment of digital platforms and a growing number of hyper-connected networks. As this sector has a rapid transformation due to the rising popularity of cloud computing and network virtualization technologies, the demand has surged for network management and monitoring solutions to track data security. BFSI is since trying to execute cyber-security policies, making a proper network security approach to challenge cyber attacks.
North America controls the Enterprise Networking market due to the growing demand for domestic and commercial building alongside high awareness among the people regarding the benefits associated with the usage of Enterprise Networking. The established network supports the sustained earnings.
This report gives the profiles of companies which are leading the Enterprise Networking market: Huawei Technologies Co. Ltd., Cisco Systems, Inc., Palo Alto Networks, Inc., Checkpoint Software Technologies Ltd., McAfee LLC, Riverbed Technology, Inc., Netscout, Symantec Corporation, Trend Micro Inc., Juniper Networks Inc., and Dell Technologies
- This report provides an inclusive analysis of the Enterprise Networking market growth drivers, restraints, opportunities, and other related challenges.
- This report depicts the market developments such as new product launches, mergers and acquisitions, diversification, and joint ventures of the market players.
- This report also describes all potential segments and sub-segments present in the market to help the companies in strategic business planning.
- This report also gives the regional analysis of the Enterprise Networking market in terms of market penetration across the world.
- Executive Summary
- Industry Outlook
- Industry Overview
- Industry Trends
- Market Snapshot
- Market Definition
- Market Outlook
- Porter Five Forces
- Related Markets
- Market characteristics
- Market Overview
- Market Segmentation
- Market Dynamics
- Drivers
- Restraints
- Opportunities
- DRO - Impact Analysis
- Component: Market Size & Analysis
- Overview
- Product
- Switches
- Network Security
- Service
- Training & Consulting
- Integration & Maintenance
- Managed Service
- Deployment Mode: Market Size & Analysis
- Overview
- On-Premise
- Cloud
- Application: Market Size & Analysis
- Overview
- Banking, Financial Services and Insurance (BFSI)
- Media and Communication
- Healthcare
- Aerospace and Defense
- Transportation and Logistics
- Government and Utilities
- Others
- Geography: Market Size & Analysis
- Overview
- North America
- Europe
- Asia Pacific
- Rest of the World
- Competitive Landscape
- Competitor Comparison Analysis
- Market Developments
- Mergers and Acquisitions, Legal, Awards, Partnerships
- Product Launches and execution
- Vendor Profiles
- Huawei Technologies Co. Ltd.
- Overview
- Financial Overview
- Product Offerings
- Developments
- Business Strategy
- Cisco Systems, Inc.
- Overview
- Financial Overview
- Product Offerings
- Developments
- Business Strategy
- Palo Alto Networks, Inc.
- Overview
- Financial Overview
- Product Offerings
- Developments
- Business Strategy
- Checkpoint Software Technologies Ltd.
- Overview
- Financial Overview
- Product Offerings
- Developments
- Business Strategy
- McAfee LLC
- Overview
- Financial Overview
- Product Offerings
- Developments
- Business Strategy
- Riverbed Technology, Inc.
- Overview
- Financial Overview
- Product Offerings
- Developments
- Business Strategy
- Netscout
- Overview
- Financial Overview
- Product Offerings
- Developments
- Business Strategy
- Symantec Corporation
- Overview
- Financial Overview
- Product Offerings
- Developments
- Business Strategy
- Trend Micro Inc.
- Overview
- Financial Overview
- Product Offerings
- Developments
- Business Strategy
- Juniper Networks Inc.
- Overview
- Financial Overview
- Product Offerings
- Developments
- Business Strategy
- Huawei Technologies Co. Ltd.
- Companies to Watch
- Dell Technologies
- Overview
- Products & Services
- Business Strategy
- Dell Technologies
- Analyst Opinion
- Annexure
- Report Scope
- Market Definitions
- Research Methodology
- Data Collation and In-house Estimation
- Market Triangulation
- Forecasting
- Report Assumptions
- Declarations
- Stakeholders
- Abbreviations
TABLE 1. GLOBAL ENTERPRISE NETWORKING MARKET VALUE, BY COMPONENT, 2020-2026 (USD BILLION)
TABLE 2. GLOBAL ENTERPRISE NETWORKING MARKET VALUE FOR PRODUCT, BY GEOGRAPHY, 2020-2026 (USD BILLION)
TABLE 3. GLOBAL ENTERPRISE NETWORKING MARKET VALUE FOR SWITCHES, BY TYPE, 2020-2026 (USD BILLION)
TABLE 4. GLOBAL ENTERPRISE NETWORKING MARKET VALUE FOR NETWORK SECURITY, BY TYPE, 2020-2026 (USD BILLION)
TABLE 5. GLOBAL ENTERPRISE NETWORKING MARKET VALUE FOR SERVICE, BY GEOGRAPHY, 2020-2026 (USD BILLION)
TABLE 6. GLOBAL ENTERPRISE NETWORKING MARKET VALUE FOR TRAINING & CONSULTING, BY TYPE, 2020-2026 (USD BILLION)
TABLE 7. GLOBAL ENTERPRISE NETWORKING MARKET VALUE FOR INTEGRATION & MAINTENANCE, BY TYPE, 2020-2026 (USD BILLION)
TABLE 8. GLOBAL ENTERPRISE NETWORKING MARKET VALUE FOR MANAGED SERVICE, BY TYPE, 2020-2026 (USD BILLION)
TABLE 9. GLOBAL ENTERPRISE NETWORKING MARKET VALUE, BY DEPLOYMENT MODE, 2020-2026 (USD BILLION)
TABLE 10. GLOBAL ENTERPRISE NETWORKING MARKET VALUE FOR ON-PREMISE, BY GEOGRAPHY, 2020-2026 (USD BILLION)
TABLE 11. GLOBAL ENTERPRISE NETWORKING MARKET VALUE FOR CLOUD, BY GEOGRAPHY, 2020-2026 (USD BILLION)
TABLE 12. GLOBAL ENTERPRISE NETWORKING MARKET VALUE, BY APPLICATION, 2020-2026 (USD BILLION)
TABLE 13. GLOBAL ENTERPRISE NETWORKING MARKET VALUE FOR BANKING, FINANCIAL SERVICES AND INSURANCE (BFSI), 2020-2026 (USD BILLION)
TABLE 14. GLOBAL ENTERPRISE NETWORKING MARKET VALUE FOR MEDIA AND COMMUNICATION, BY GEOGRAPHY, 2020-2026 (USD BILLION)
TABLE 15. GLOBAL ENTERPRISE NETWORKING MARKET VALUE FOR HEALTHCARE, BY GEOGRAPHY, 2020-2026 (USD BILLION)
TABLE 16. GLOBAL ENTERPRISE NETWORKING MARKET VALUE FOR AEROSPACE AND DEFENSE, BY GEOGRAPHY, 2020-2026 (USD BILLION)
TABLE 17. GLOBAL ENTERPRISE NETWORKING MARKET VALUE FOR TRANSPORTATION AND LOGISTICS, BY GEOGRAPHY, 2020-2026 (USD BILLION)
TABLE 18. GLOBAL ENTERPRISE NETWORKING MARKET VALUE FOR GOVERNMENT AND UTILITIES, BY GEOGRAPHY, 2020-2026 (USD BILLION)
TABLE 19. GLOBAL ENTERPRISE NETWORKING MARKET VALUE FOR OTHERS, BY GEOGRAPHY, 2020-2026 (USD BILLION)
TABLE 20. NORTH AMERICA ENTERPRISE NETWORKING MARKET VALUE, BY COUNTRY, 2020-2026 (USD BILLION)
TABLE 21. NORTH AMERICA ENTERPRISE NETWORKING MARKET VALUE, BY COMPONENT, 2020-2026 (USD BILLION)
TABLE 22. NORTH AMERICA ENTERPRISE NETWORKING MARKET VALUE, BY DEPLOYMENT MODE, 2020-2026 (USD BILLION)
TABLE 23. NORTH AMERICA ENTERPRISE NETWORKING MARKET VALUE, BY APPLICATION, 2020-2026 (USD BILLION)
TABLE 24. U.S ENTERPRISE NETWORKING MARKET VALUE, BY COMPONENT, 2020-2026 (USD BILLION)
TABLE 25. U.S ENTERPRISE NETWORKING MARKET VALUE, BY DEPLOYMENT MODE, 2020-2026 (USD BILLION)
TABLE 26. U.S ENTERPRISE NETWORKING MARKET VALUE, BY APPLICATION, 2020-2026 (USD BILLION)
TABLE 27. CANADA ENTERPRISE NETWORKING MARKET VALUE, BY COMPONENT, 2020-2026 (USD BILLION)
TABLE 28. CANADA ENTERPRISE NETWORKING MARKET VALUE, BY DEPLOYMENT MODE, 2020-2026 (USD BILLION)
TABLE 29. CANADA ENTERPRISE NETWORKING MARKET VALUE, BY APPLICATION, 2020-2026 (USD BILLION)
TABLE 30. EUROPE ENTERPRISE NETWORKING MARKET VALUE, BY COUNTRY, 2020-2026 (USD BILLION)
TABLE 31. EUROPE ENTERPRISE NETWORKING MARKET VALUE, BY COMPONENT, 2020-2026 (USD BILLION)
TABLE 32. EUROPE ENTERPRISE NETWORKING MARKET VALUE, BY DEPLOYMENT MODE, 2020-2026 (USD BILLION)
TABLE 33. EUROPE ENTERPRISE NETWORKING MARKET VALUE, APPLICATION, 2020-2026 (USD BILLION)
TABLE 34. GERMANY ENTERPRISE NETWORKING MARKET VALUE, BY COMPONENT, 2020-2026 (USD BILLION)
TABLE 35. GERMANY ENTERPRISE NETWORKING MARKET VALUE, BY DEPLOYMENT MODE, 2020-2026 (USD BILLION)
TABLE 36. GERMANY ENTERPRISE NETWORKING MARKET VALUE, BY APPLICATION, 2020-2026 (USD BILLION)
TABLE 37. U.K ENTERPRISE NETWORKING MARKET VALUE, BY COMPONENT, 2020-2026 (USD BILLION)
TABLE 38. U.K ENTERPRISE NETWORKING MARKET VALUE, BY DEPLOYMENT MODE, 2020-2026 (USD BILLION)
TABLE 39. U.K ENTERPRISE NETWORKING MARKET VALUE, BY APPLICATION, 2020-2026 (USD BILLION)
TABLE 40. FRANCE ENTERPRISE NETWORKING MARKET VALUE, BY COMPONENT, 2020-2026 (USD BILLION)
TABLE 41. FRANCE ENTERPRISE NETWORKING MARKET VALUE, BY DEPLOYMENT MODE, 2020-2026 (USD BILLION)
TABLE 42. FRANCE ENTERPRISE NETWORKING MARKET VALUE, BY APPLICATION, 2020-2026 (USD BILLION)
TABLE 43. ITALY ENTERPRISE NETWORKING MARKET VALUE, BY COMPONENT, 2020-2026 (USD BILLION)
TABLE 44. ITALY ENTERPRISE NETWORKING MARKET VALUE, BY DEPLOYMENT MODE, 2020-2026 (USD BILLION)
TABLE 45. ITALY ENTERPRISE NETWORKING MARKET VALUE, BY APPLICATION, 2020-2026 (USD BILLION)
TABLE 46. SPAIN ENTERPRISE NETWORKING MARKET VALUE, BY COMPONENT, 2020-2026 (USD BILLION)
TABLE 47. SPAIN ENTERPRISE NETWORKING MARKET VALUE, BY DEPLOYMENT MODE, 2020-2026 (USD BILLION)
TABLE 48. SPAIN ENTERPRISE NETWORKING MARKET VALUE, BY APPLICATION, 2020-2026 (USD BILLION)
TABLE 49. ROE ENTERPRISE NETWORKING MARKET VALUE, BY COMPONENT, 2020-2026 (USD BILLION)
TABLE 50. ROE ENTERPRISE NETWORKING MARKET VALUE, BY DEPLOYMENT MODE, 2020-2026 (USD BILLION)
TABLE 51. ROE ENTERPRISE NETWORKING MARKET VALUE, BY APPLICATION, 2020-2026 (USD BILLION)
TABLE 52. ASIA PACIFIC ENTERPRISE NETWORKING MARKET VALUE, BY COUNTRY, 2020-2026 (USD BILLION)
TABLE 53. ASIA PACIFIC ENTERPRISE NETWORKING MARKET VALUE, BY COMPONENT, 2020-2026 (USD BILLION)
TABLE 54. ASIA PACIFIC ENTERPRISE NETWORKING MARKET VALUE, BY DEPLOYMENT MODE, 2020-2026 (USD BILLION)
TABLE 55. ASIA PACIFIC ENTERPRISE NETWORKING MARKET VALUE, BY APPLICATION, 2020-2026 (USD BILLION)
TABLE 56. CHINA ENTERPRISE NETWORKING MARKET VALUE, BY COMPONENT, 2020-2026 (USD BILLION)
TABLE 57. CHINA ENTERPRISE NETWORKING MARKET VALUE, BY DEPLOYMENT MODE, 2020-2026 (USD BILLION)
TABLE 58. CHINA ENTERPRISE NETWORKING MARKET VALUE, BY APPLICATION, 2020-2026 (USD BILLION)
TABLE 59. INDIA ENTERPRISE NETWORKING MARKET VALUE, BY COMPONENT, 2020-2026 (USD BILLION)
TABLE 60. INDIA ENTERPRISE NETWORKING MARKET VALUE, BY DEPLOYMENT MODE, 2020-2026 (USD BILLION)
TABLE 61. INDIA ENTERPRISE NETWORKING MARKET VALUE, BY APPLICATION, 2020-2026 (USD BILLION)
TABLE 62. JAPAN ENTERPRISE NETWORKING MARKET VALUE, BY COMPONENT, 2020-2026 (USD BILLION)
TABLE 63. JAPAN ENTERPRISE NETWORKING MARKET VALUE, BY DEPLOYMENT MODE, 2020-2026 (USD BILLION)
TABLE 64. JAPAN ENTERPRISE NETWORKING MARKET VALUE, BY APPLICATION, 2020-2026 (USD BILLION)
TABLE 65. REST OF APAC ENTERPRISE NETWORKING MARKET VALUE, BY COMPONENT, 2020-2026 (USD BILLION)
TABLE 66. REST OF APAC ENTERPRISE NETWORKING MARKET VALUE, BY DEPLOYMENT MODE, 2020-2026 (USD BILLION)
TABLE 67. REST OF APAC ENTERPRISE NETWORKING MARKET VALUE, BY APPLICATION, 2020-2026 (USD BILLION)
TABLE 68. REST OF WORLD ENTERPRISE NETWORKING MARKET VALUE, BY COMPONENT, 2020-2026 (USD BILLION)
TABLE 69. REST OF WORLD ENTERPRISE NETWORKING MARKET VALUE, BY DEPLOYMENT MODE, 2020-2026 (USD BILLION)
TABLE 70. REST OF WORLD ENTERPRISE NETWORKING MARKET VALUE, BY APPLICATION, 2020-2026 (USD BILLION)
TABLE 71. HUAWEI TECHNOLOGIES CO. LTD: FINANCIALS
TABLE 72. HUAWEI TECHNOLOGIES CO. LTD: PRODUCTS & SERVICES
TABLE 73. HUAWEI TECHNOLOGIES CO. LTD: RECENT DEVELOPMENTS
TABLE 74. CISCO SYSTEMS, INC: FINANCIALS
TABLE 75. CISCO SYSTEMS, INC: PRODUCTS & SERVICES
TABLE 76. CISCO SYSTEMS, INC: RECENT DEVELOPMENTS
TABLE 77. PALO ALTO NETWORKS, INC: FINANCIALS
TABLE 78. PALO ALTO NETWORKS, INC: PRODUCTS & SERVICES
TABLE 79. PALO ALTO NETWORKS, INC: RECENT DEVELOPMENTS
TABLE 80. CHECKPOINT SOFTWARE TECHNOLOGIES LTD: FINANCIALS
TABLE 81. CHECKPOINT SOFTWARE TECHNOLOGIES LTD: PRODUCTS & SERVICES
TABLE 82. CHECKPOINT SOFTWARE TECHNOLOGIES LTD: RECENT DEVELOPMENTS
TABLE 83. MCAFEE LLC: FINANCIALS
TABLE 84. MCAFEE LLC: PRODUCTS & SERVICES
TABLE 85. MCAFEE LLC: RECENT DEVELOPMENTS
TABLE 86. RIVERBED TECHNOLOGY, INC: FINANCIALS
TABLE 87. RIVERBED TECHNOLOGY, INC: PRODUCTS & SERVICES
TABLE 88. RIVERBED TECHNOLOGY, INC: RECENT DEVELOPMENTS
TABLE 89. NETSCOUT: FINANCIALS
TABLE 90. NETSCOUT: PRODUCTS & SERVICES
TABLE 91. NETSCOUT: RECENT DEVELOPMENTS
TABLE 92. SYMANTEC CORPORATION: FINANCIALS
TABLE 93. SYMANTEC CORPORATION: PRODUCTS & SERVICES
TABLE 94. SYMANTEC CORPORATION: RECENT DEVELOPMENTS
TABLE 95. TREND MICRO INC: FINANCIALS
TABLE 96. TREND MICRO INC: PRODUCTS & SERVICES
TABLE 97. TREND MICRO INC: RECENT DEVELOPMENTS
TABLE 98. JUNIPER NETWORKS INC.: FINANCIALS
TABLE 99. JUNIPER NETWORKS INC.: PRODUCTS & SERVICES
TABLE 100. JUNIPER NETWORKS INC.: RECENT DEVELOPMENTS
TABLE 101. DELL TECHNOLOGIES: PRODUCTS & SERVICES
Research Framework
Infoholic Research works on a holistic 360° approach in order to deliver high quality, validated and reliable information in our market reports. The Market estimation and forecasting involves following steps:
- Data Collation (Primary & Secondary)
- In-house Estimation (Based on proprietary data bases and Models)
- Market Triangulation
- Forecasting

Market related information is congregated from both primary and secondary sources.
Primary sources
Involved participants from all global stakeholders such as Solution providers, service providers, Industry associations, thought leaders etc. across levels such as CXOs, VPs and managers. Plus, our in-house industry experts having decades of industry experience contribute their consulting and advisory services.
Secondary sources
Include public sources such as regulatory frameworks, government IT spending, government demographic indicators, industry association statistics, and company publications along with paid sources such as Factiva, OneSource, Bloomberg among others.
![]()


