
Endodontic Devices Market By End-Use (Clinics, Research Institutes, Hospitals & Dental Academic), Type (consumables, Instruments), and Geography – Global Drivers, Restraints, Opportunities, Trends, and Forecast up to 2026
- September, 2020
- Domain: Healthcare - Medical Devices
- Get Free 10% Customization in this Report
The global market size of endodontic devices was estimated at USD 1.940 billion in 2026, and is projected to grow at a CAGR of 5.2% over the forecast period. Two of the major driving factors are the high incidence of dental caries, increased spending on dental care, and overall growth in consumer disposable income. Additionally, dental tourism is expanding in countries like India, Mexico, and Brazil due to the availability of low-cost facilities like transportation, lodging, and dental care.
Research Methodology:
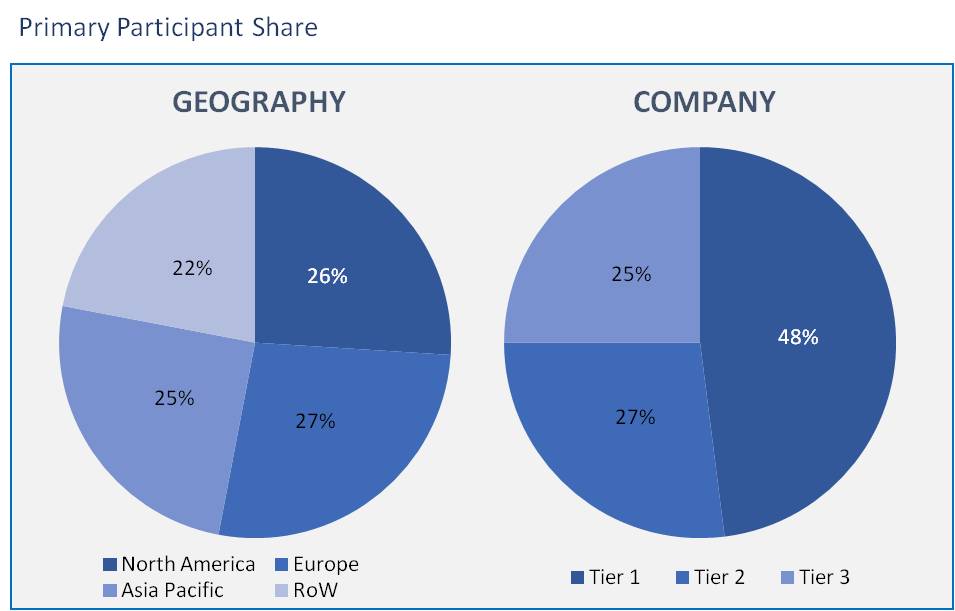
The endodontic devices market has been analyzed by utilizing the optimum combination of secondary sources and in-house methodology, along with an irreplaceable blend of primary insights. The real-time assessment of the market is an integral part of our market sizing and forecasting methodology. Our industry experts and panel of primary participants have helped in compiling relevant aspects with realistic parametric estimations for a comprehensive study. The participation share of different categories of primary participants is given below:
Technological developments and endodontic system modernization have resulted in the production of improved rotary equipment that reduces procedural errors. Besides, the growing use of rotary and reciprocating Nickel-Titanium files over traditional stainless-steel hand file systems has improved the cleaning and forming stages of an endodontic procedure leading to better canal preparation. In low-income groups, the rate of dental health literacy is weak, leading to insufficient preventive care. Yet through government policies over the past few years have changed the nature of dental health services contributing to improved dental health for the public.
The market of endodontic devices has been segregated as:
By Type
- Instruments
- Apex Locators
- Endodontic Motors
- Others (Contra Angles)
- Consumables
- Access & Treatment Preparation
- Burs
- Drills
- Ultrasonic Tips
- Shaping & Cleaning
- Hand Files
- Rotary/ Reciprocating Files
- Irrigants & Lubricants
- Others
- Obturation
- Obturators
- Other Obturation Consumables
- Access & Treatment Preparation
By End-Use
- Dental Academic and Research Institutes
- Dental Clinics
- Dental Hospitals
By Region
- North America
- Europe
- Asia pacific
- Rest of World
MARKET SEGMENTATION INSIGHTS
- The endodontic devices market, based on type, has been segmented into consumables and instruments. The majority of the market share was dominated by endodontic motor instruments, as the hospitals and the other dental care practices prefer safer and quicker ways to perform the root canal. Increasing preference for Nickel-Titanium instruments is further expected to boost the growth of this market as it provides good elasticity, which preserves the original form of the apical foramen. The conventional consumables such as handpieces are available in a variety of applications, manufacturing methods, material, and design. Also, the use of multi-axis grinding machines has provided a stronger cutting capability in recent years. These factors are expected to enable improved market growth in the coming years.
- In 2019, dental hospitals held the majority of market share. The use of endodontic instruments varies widely and relies on the severity of tooth decay. General dentists may perform the procedures in both hospitals and clinics, and they also refer patients to a specialized endodontist. The number of patients suitable for the treatment by trained interns, hospital staff, and dental students admitted by the academic hospitals is limited in number. In these hospitals, experts or consultants handle only patients who fall into those classes of priority.
- In 2019, North America emerged as the largest geographic segment. Technologies like ultrasonic equipment are available in a variety of tips that differ in form, length, and size. Besides, the advent of novel ultrasound sources helps to monitor and control the frequency and vibration amplitude of all types of a tip. As per the Centres for Disease Control and Prevention (CDC), in the United States, more than 18 % of children (5 to 19 years of age) and 31.6% of adults (20 to 44 years of age) suffered from dental caries during period between 2011 and 2014. Nevertheless, the number declined from 2016 in the following year, with the incidence of untreated dental caries being 13%. This decline in dental caries can be primarily attributed to the increasing dental tourism, improving & increasing dental care infrastructure, and focused R&D activities, Asia pacific is expected to experience the fastest growth. The Asian Pacific Endodontic Confederation (APEC) aims to promote and develop high standards of clinical practice and endodontic research.
The major players operating in endodontics market are Ivoclar Vivadent, Mani, Micro-Mega, Septodont HoldingColtene Holding, Danaher Corporation, Dentsply Sirona, Brasseler USA, Diadent Group International, FKG Dentaire, Ultradent Products, and VOCO. Some of the business approaches adopted by these companies to strengthen their market dominance include mergers and acquisitions and partnerships.
This report provided the following insights:-
- This study the forecasts market revenue growth at a regional, country as well as global level.
- This report also provides an overview of the latest industry trends from 2020 to 2026 in each of the sub-segment.
- The major players are profiled, and their approaches are extensively analyzed to consider the global endodontic consumables industry's competitive outlook.
1. Executive Summary
2. Industry Outlook
2.1. Industry Overview
2.2. Industry Trends
3. Market Snapshot
3.1. Market Definition
3.2. Market Outlook
3.3. PEST Analysis
3.4. Porter Five Forces
3.5. Related Markets
4. Market Characterisitics
4.1. Market Evolution
4.2. Market Trends and Impact
4.3. Advantages/Disadvantages of Market
4.4. Regulatory Impact
4.5. Market Offerings
4.6. Market Segmentation
4.7. Market Dynamics
4.7.1. Drivers
4.7.2. Restraints
4.7.3. Opportunities
4.8. DRO - Impact Analysis
5. End User: Market Size & Analysis
5.1. Dental academic and research institutes
5.2. Dental hospitals
5.3. Dental Clinic
6. Type: Market Size & Analysis
6.1. Instruments
6.1.1. Apex Locators
6.1.2. Endodontic Motors
6.1.3. Others (Contra Angles)
6.2. Consumables
6.2.1. Access & Treatment Preparation
6.2.1.1. Burs
6.2.1.2. Drills
6.2.1.3. Ultrasonic Tips
6.2.2. Shaping & Cleaning
6.2.2.1. Hand Files
6.2.2.2. Rotary/ Reciprocating Files
6.2.2.3. Irrigants & Lubricants
6.2.2.4. Others
6.2.3. Obturation
6.2.3.1. Obturators
6.2.3.2. Other Obturation Consumables
7. Geography: Market Size & Analysis
7.1. North America
7.2. Europe
7.3. Asia Pacific
7.4. Rest of the World
8. Competitive Landscape
8.1. Competitor Comparison Analysis
9. Vendor Profiles
9.1. Mani
9.1.1. Overview
9.1.2. Product Offerings
9.1.3. Geographic Revenue
9.1.4. Business Units
9.1.5. Developments
9.1.6. Business Strategy
9.2. Micro-Mega
9.2.1. Overview
9.2.2. Product Offerings
9.2.3. Geographic Revenue
9.2.4. Business Units
9.2.5. Developments
9.2.6. Business Strategy
9.3. Septodont Holding
9.3.1. Overview
9.3.2. Product Offerings
9.3.3. Geographic Revenue
9.3.4. Business Units
9.3.5. Developments
9.3.6. Business Strategy
9.4. Ultradent Products
9.4.1. Overview
9.4.2. Product Offerings
9.4.3. Geographic Revenue
9.4.4. Business Units
9.4.5. Developments
9.4.6. Business Strategy
9.5. VOCO
9.5.1. Overview
9.5.2. Product Offerings
9.5.3. Geographic Revenue
9.5.4. Business Units
9.5.5. Developments
9.5.6. Business Strategy
9.6. Coltene Holding
9.6.1. Overview
9.6.2. Product Offerings
9.6.3. Geographic Revenue
9.6.4. Business Units
9.6.5. Developments
9.6.6. Business Strategy
9.7. Danaher Corporation
9.7.1. Overview
9.7.2. Product Offerings
9.7.3. Geographic Revenue
9.7.4. Business Units
9.7.5. Developments
9.7.6. Business Strategy
9.8. Dentsply Sirona.
9.8.1. Overview
9.8.2. Product Offerings
9.8.3. Geographic Revenue
9.8.4. Business Units
9.8.5. Developments
9.8.6. Business Strategy
9.9. Brasseler USA.
9.9.1. Overview
9.9.2. Product Offerings
9.9.3. Geographic Revenue
9.9.4. Business Units
9.9.5. Developments
9.9.6. Business Strategy
9.10. Diadent Group International
9.10.1. Overview
9.10.2. Product Offerings
9.10.3. Geographic Revenue
9.10.4. Business Units
9.10.5. Developments
9.10.6. Business Strategy
10. Companies to Watch
10.1. FKG Dentaire
10.1.1. Overview
10.1.2. Product Offerings
10.1.3. Geographic Revenue
10.2. Ivoclar Vivadent
-
-
- Overview
-
10.2.2. Product Offerings
10.2.3. Geographic Revenue
11. Analyst Opinion
12. Annexure
12.1. Report Scope
12.2. Market Definitions
12.3. Research Methodology
12.3.1. Data Collation and In-house Estimation
12.3.2. Market Triangulation
12.3.3. Forecasting
12.4. Report Assumptions
12.5. Declarations
12.6. Stakeholders
12.7. Abbreviations
TABLE 1. GLOBAL ENDODONTICS MARKET VALUE, BY END USER, 2020-2026 (USD MILLION)
TABLE 2. GLOBAL ENDODONTICS MARKET VALUE FOR DENTAL ACADEMIC AND RESEARCH INSTITUTION, BY GEOGRAPHY, 2020-2026 (USD MILLION)
TABLE 3. GLOBAL ENDODONTICS MARKET VALUE FOR DENTAL HOSPITALS, BY GEOGRAPHY, 2020-2026 (USD MILLION)
TABLE 4. GLOBAL ENDODONTICS MARKET VALUE FOR DENTAL CLINICS, BY GEOGRAPHY, 2020-2026 (USD MILLION)
TABLE 5. GLOBAL ENDODONTICS MARKET VALUE, BY TYPE, 2020-2026 (USD MILLION)
TABLE 6. GLOBAL ENDODONTICS MARKET VALUE FOR INSTRUMENTS, BY GEOGRAPHY, 2020-2026 (USD MILLION)
TABLE 7. GLOBAL ENDODONTICS MARKET VALUE FOR APEX LOCATORS, BY GEOGRAPHY, 2020-2026 (USD MILLION)
TABLE 8. GLOBAL ENDODONTICS MARKET VALUE FOR ENDODONTIC MOTORS, BY GEOGRAPHY, 2020-2026 (USD MILLION)
TABLE 9. GLOBAL ENDODONTICS MARKET VALUE FOR OTHERS, BY GEOGRAPHY, 2020-2026 (USD MILLION)
TABLE 10. GLOBAL ENDODONTICS MARKET VALUE FOR CONSUMABLES, BY GEOGRAPHY, 2020-2026 (USD MILLION)
TABLE 11. GLOBAL ENDODONTICS MARKET VALUE FOR ACCESS & TREATMENT PREPARATION, BY GEOGRAPHY, 2020-2026 (USD MILLION)
TABLE 12. GLOBAL ENDODONTICS MARKET VALUE FOR BURS, BY GEOGRAPHY, 2020-2026 (USD MILLION)
TABLE 13. GLOBAL ENDODONTICS MARKET VALUE FOR DRILLS, BY GEOGRAPHY, 2020-2026 (USD MILLION)
TABLE 14. GLOBAL ENDODONTICS MARKET VALUE FOR ULTRASONIC TIPS, BY GEOGRAPHY, 2020-2026 (USD MILLION)
TABLE 15. GLOBAL ENDODONTICS MARKET VALUE FOR SHAPING & CLEANING, BY GEOGRAPHY, 2020-2026 (USD MILLION)
TABLE 16. GLOBAL ENDODONTICS MARKET VALUE FOR HAND FILES, BY GEOGRAPHY, 2020-2026 (USD MILLION)
TABLE 17. GLOBAL ENDODONTICS MARKET VALUE FOR ROTARY/ RECIPROCATING FILES, BY GEOGRAPHY, 2020-2026 (USD MILLION)
TABLE 18. GLOBAL ENDODONTICS MARKET VALUE FOR IRRIGANTS & LUBRICANTS, BY GEOGRAPHY, 2020-2026 (USD MILLION)
TABLE 19. GLOBAL ENDODONTICS MARKET VALUE FOR OTHERS, BY GEOGRAPHY, 2020-2026 (USD MILLION)
TABLE 20. GLOBAL ENDODONTICS MARKET VALUE FOR OBTURATION, BY GEOGRAPHY, 2020-2026 (USD MILLION)
TABLE 21. GLOBAL ENDODONTICS MARKET VALUE FOR OBTURATORS, BY GEOGRAPHY, 2020-2026 (USD MILLION)
TABLE 22. GLOBAL ENDODONTICS MARKET VALUE FOR OTHER OBTURATION CONSUMABLES, BY GEOGRAPHY, 2020-2026 (USD MILLION)
TABLE 23. NORTH AMERICA ENDODONTICS MARKET VALUE FOR END USER, BY CLUNTRY, 2020-2026 (USD MILLION)
TABLE 24. NORTH AMERICA ENDODONTICS MARKET VALUE FOR END USER, BY GEOGRAPHY, 2020-2026 (USD MILLION)
TABLE 25. NORTH AMERICA ENDODONTICS MARKET VALUE, BY TYPE, 2020-2026 (USD MILLION)
TABLE 26. U.S ENDODONTICS MARKET VALUE FOR END USER, BY GEOGRAPHY, 2020-2026 (USD MILLION)
TABLE 27. U.S ENDODONTICS MARKET VALUE, BY TYPE, 2020-2026 (USD MILLION)
TABLE 28. CANADA ENDODONTICS MARKET VALUE FOR END USER, BY GEOGRAPHY, 2020-2026 (USD MILLION)
TABLE 29. CANADA ENDODONTICS MARKET VALUE, BY TYPE, 2020-2026 (USD MILLION)
TABLE 30. EUROPE ENDODONTICS MARKET VALUE FOR END USER, BY CLUNTRY, 2020-2026 (USD MILLION)
TABLE 31. EUROPE ENDODONTICS MARKET VALUE FOR END USER, BY GEOGRAPHY, 2020-2026 (USD MILLION)
TABLE 32. EUROPE ENDODONTICS MARKET VALUE, BY TYPE, 2020-2026 (USD MILLION)
TABLE 33. GERMANY ENDODONTICS MARKET VALUE FOR END USER, BY GEOGRAPHY, 2020-2026 (USD MILLION)
TABLE 34. GERMANY ENDODONTICS MARKET VALUE, BY TYPE, 2020-2026 (USD MILLION)
TABLE 35. U.K ENDODONTICS MARKET VALUE FOR END USER, BY GEOGRAPHY, 2020-2026 (USD MILLION)
TABLE 36. U.K ENDODONTICS MARKET VALUE, BY TYPE, 2020-2026 (USD MILLION)
TABLE 37. FRANCE ENDODONTICS MARKET VALUE FOR END USER, BY GEOGRAPHY, 2020-2026 (USD MILLION)
TABLE 38. FRANCE ENDODONTICS MARKET VALUE, BY TYPE, 2020-2026 (USD MILLION)
TABLE 39. ITALY ENDODONTICS MARKET VALUE FOR END USER, BY GEOGRAPHY, 2020-2026 (USD MILLION)
TABLE 40. ITALY ENDODONTICS MARKET VALUE, BY TYPE, 2020-2026 (USD MILLION)
TABLE 41. ROE ENDODONTICS MARKET VALUE FOR END USER, BY GEOGRAPHY, 2020-2026 (USD MILLION)
TABLE 42. ROE ENDODONTICS MARKET VALUE, BY TYPE, 2020-2026 (USD MILLION)
TABLE 43. ASIA PACIFIC ENDODONTICS MARKET VALUE FOR END USER, BY CLUNTRY, 2020-2026 (USD MILLION)
TABLE 44. ASIA PACIFIC ENDODONTICS MARKET VALUE FOR END USER, BY GEOGRAPHY, 2020-2026 (USD MILLION)
TABLE 45. ASIA PACIFIC ENDODONTICS MARKET VALUE, BY TYPE, 2020-2026 (USD MILLION)
TABLE 46. CHINA ENDODONTICS MARKET VALUE FOR END USER, BY GEOGRAPHY, 2020-2026 (USD MILLION)
TABLE 47. CHINA ENDODONTICS MARKET VALUE, BY TYPE, 2020-2026 (USD MILLION)
TABLE 48. INDIA ENDODONTICS MARKET VALUE FOR END USER, BY GEOGRAPHY, 2020-2026 (USD MILLION)
TABLE 49. INDIA ENDODONTICS MARKET VALUE, BY TYPE, 2020-2026 (USD MILLION)
TABLE 50. JAPAN ENDODONTICS MARKET VALUE FOR END USER, BY GEOGRAPHY, 2020-2026 (USD MILLION)
TABLE 51. JAPAN ENDODONTICS MARKET VALUE, BY TYPE, 2020-2026 (USD MILLION)
TABLE 52. ROAPAC ENDODONTICS MARKET VALUE FOR END USER, BY GEOGRAPHY, 2020-2026 (USD MILLION)
TABLE 53. ROAPAC ENDODONTICS MARKET VALUE, BY TYPE, 2020-2026 (USD MILLION)
TABLE 54. REST OF WORLD ENDODONTICS MARKET VALUE FOR END USER, BY GEOGRAPHY, 2020-2026 (USD MILLION)
TABLE 55. REST OF WORLD ENDODONTICS MARKET VALUE, BY TYPE, 2020-2026 (USD MILLION)
TABLE 56. MANI: OVERVIEW
TABLE 57. MANI: STRATEGIC SNAPSHOT
TABLE 58. MANI: BUSINESS FOCUS
TABLE 59. MANI: PRODUCT/SERVICE PORTFOLIO
TABLE 60. MICRO-MEGA: OVERVIEW
TABLE 61. MICRO-MEGA: STRATEGIC SNAPSHOT
TABLE 62. MICRO-MEGA: BUSINESS FOCUS
TABLE 63. MICRO-MEGA: PRODUCT/SERVICE PORTFOLIO
TABLE 64. SEPTODONT HOLDING: OVERVIEW
TABLE 65. SEPTODONT HOLDING: STRATEGIC SNAPSHOT
TABLE 66. SEPTODONT HOLDING: BUSINESS FOCUS
TABLE 67. SEPTODONT HOLDING: PRODUCT/SERVICE PORTFOLIO
TABLE 68. ULTRADENT PRODUCTS: OVERVIEW
TABLE 69. ULTRADENT PRODUCTS: STRATEGIC SNAPSHOT
TABLE 70. ULTRADENT PRODUCTS: BUSINESS FOCUS
TABLE 71. ULTRADENT PRODUCTS: PRODUCT/SERVICE PORTFOLIO
TABLE 72. VOCO: OVERVIEW
TABLE 73. VOCO: STRATEGIC SNAPSHOT
TABLE 74. VOCO: BUSINESS FOCUS
TABLE 75. VOCO: PRODUCT/SERVICE PORTFOLIO
TABLE 76. COLTENE HOLDING: OVERVIEW
TABLE 77. COLTENE HOLDING: STRATEGIC SNAPSHOT
TABLE 78. COLTENE HOLDING: BUSINESS FOCUS
TABLE 79. COLTENE HOLDING: PRODUCT/SERVICE PORTFOLIO
TABLE 80. DANAHER CORPORATION: OVERVIEW
TABLE 81. DANAHER CORPORATION: STRATEGIC SNAPSHOT
TABLE 82. DANAHER CORPORATION: BUSINESS FOCUS
TABLE 83. DANAHER CORPORATION: PRODUCT/SERVICE PORTFOLIO
TABLE 84. DENTSPLY SIRONA: OVERVIEW
TABLE 85. DENTSPLY SIRONA: STRATEGIC SNAPSHOT
TABLE 86. DENTSPLY SIRONA: BUSINESS FOCUS
TABLE 87. DENTSPLY SIRONA: PRODUCT/SERVICE PORTFOLIO
TABLE 88. BRASSELER USA.: OVERVIEW
TABLE 89. BRASSELER USA.: STRATEGIC SNAPSHOT
TABLE 90. BRASSELER USA.: BUSINESS FOCUS
TABLE 91. BRASSELER USA.: PRODUCT/SERVICE PORTFOLIO
TABLE 92. DIADENT GROUP INTERNATIONAL: OVERVIEW
TABLE 93. DIADENT GROUP INTERNATIONAL: STRATEGIC SNAPSHOT
TABLE 94. DIADENT GROUP INTERNATIONAL: BUSINESS FOCUS
TABLE 95. DIADENT GROUP INTERNATIONAL: PRODUCT/SERVICE PORTFOLIO
Research Framework
Infoholic Research works on a holistic 360° approach in order to deliver high quality, validated and reliable information in our market reports. The Market estimation and forecasting involves following steps:
- Data Collation (Primary & Secondary)
- In-house Estimation (Based on proprietary data bases and Models)
- Market Triangulation
- Forecasting

Market related information is congregated from both primary and secondary sources.
Primary sources
Involved participants from all global stakeholders such as Solution providers, service providers, Industry associations, thought leaders etc. across levels such as CXOs, VPs and managers. Plus, our in-house industry experts having decades of industry experience contribute their consulting and advisory services.
Secondary sources
Include public sources such as regulatory frameworks, government IT spending, government demographic indicators, industry association statistics, and company publications along with paid sources such as Factiva, OneSource, Bloomberg among others.
![]()


