
Electronic Polymers Market By Type (Electroactive and Magnetic) By Applications (Electrical & Electronics, Packaging & Labeling, Healthcare Devices and Automotive ) and By Geography – Global Drivers, Restraints, Opportunities, Trends, and Forecast to 2023
- March, 2019
- Domain: Chemicals, Materials & Food - Specialty Chemicals
- Get Free 10% Customization in this Report
[95 Report Pages] The increase in the demand from various applications, such as healthcare devices and packaging & labeling among many others, is fostering the Global Electronic Polymers Market growth. The companies are focusing on investing in R&D activities to improvise and also develop new products for various application areas.
Electronic Polymers Market Research Methodology
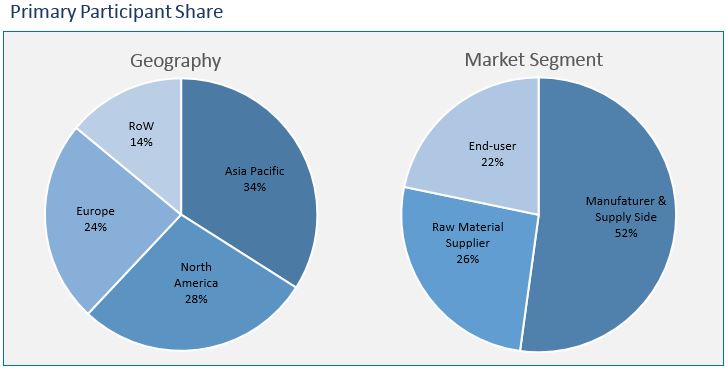
The Electronic Polymers Market has been analyzed by utilizing the optimum combination of secondary sources and in-house methodology along with an irreplaceable blend of primary insights. The real-time assessment of the market is an integral part of our market sizing and forecasting methodology. Our industry experts and panel of primary participants have helped in compiling relevant aspects with realistic parametric estimations for a comprehensive study. The participation share of different categories of primary participants is given below:
Key Market Insights
The increasing demand from electronics, healthcare, automotive, and packaging sectors is leading the Global Electronic Polymers Market toward growth. The increased per capita income owing to the changes in the economy has improved the purchasing ability of customers, encouraging them to spend more on healthcare, packaging, and electronics.
The increased awareness about the importance of healthcare has made a positive impact on the market. Customers are willing to spend, enabling healthcare providers to make use of the latest technologies and thereby helping the overall electronic polymers market to grow.
Asia Pacific is dominant in the Global Electronic Polymers Market owing to factors such as growing population, booming economy, and increasing investments, which are leading to increased consumption. The continuous effort of the manufacturers to innovate and introduce more effective and efficient products is fuelling the R&D efforts. The manufacturer has to keep innovating and upgrading to hold the place in the competitive market. Few of the prominent companies operating in the global electronic polymers market include BASF, DowDuPont, Covestro, AU Optronics Corp., and Merck. Few of the major customers include Jinko Solar, LG Display, Samsung, 3M, and GENERAL ELECTRIC.
Electronic Polymers Market By Types
- Electroactive Polymers
- Magnetic Polymers
- Other Polymers
Electronic Polymers Market By Applications
- Electrical & Electronics
- Packaging & Labeling
- Healthcare Devices
- Automotive
- Others
Electronic Polymers Market By Geography
- Asia Pacific
- North America
- Europe
- Rest of the World
1 Executive Summary
1.1 Asia Pacific has the Highest Dominance in the Electronic Polymers Market
1.2 Electrical & Electronics Dominates the Market
2 Market Positioning
2.1 Industry Snapshot
2.1.1 Industry Overview
2.1.2 Key Trends
2.2 Related Markets
3 Market Outlook
3.1 Introduction
3.2 Value Chain Analysis
3.3 Market Segmentation
4 Market Characteristics
4.1 PESTLE Analysis
4.2 Porter’s Five Force Analysis
4.3 Market Dynamics
4.3.1 Drivers
4.3.1.1 Increasing technological advancement
4.3.1.2 Growing demand for smart electronics
4.3.2 Restraints
4.3.2.1 Fluctuating raw material prices
4.3.2.2 Environmental impact
4.3.3 Opportunities
4.3.3.1 Growing demand from robotics and automation
4.3.3.2 Large untapped market in developing & underdeveloped countries
4.3.4 DRO – Impact Analysis
4.4 Patent Analysis
5 Electronic Polymers Market, By Type
5.1 Overview
5.2 Electroactive Polymers
5.3 Magnetic Polymers
6 Electronic Polymers Market, By Applications
6.1 Overview
6.2 Electrical & Electronics
6.3 Packaging & Labeling
6.4 Healthcare Devices
6.5 Automotive
7 Electronic Polymers Market, By Geography
7.2 Asia Pacific
7.3 North America
7.4 Europe
7.5 Rest of the World
(Market segmentation based on geography, type, and application have been covered for all regions)
8 Competitive Landscape
8.1 Competitive Regional Exposure Analysis
8.2 Market Developments
8.2.1 Award & Recognition
8.2.2 Exhibitions
8.2.3 Product Launches & Innovation
9 Vendors Profile
9.1 BASF
9.2 DowDuPont
9.3 Covestro
9.4 AU Optronics Corp
9.5 Merck KGaA
(Overview, product profile, business units, geographic revenue, recent developments, business focus, business strategies and SWOT analysis have been covered for all the vendors)
10 Customers Profile
10.1 Jinko Solar
10.2 LG Display
10.3 Samsung
10.4 GENERAL ELECTRIC
10.5 3M
(Overview, business units, geographic revenue, business strategies have been covered for all customers)
11 Companies to Watch for
11.1 Perfect Polymers FZ-LLC
11.1.1 Focusing on green technologies
12 Annexure
12.1 Report Scope
12.2 Market Definition
12.3 Research Methodology
12.3.1 Data Collation & In-house Estimation
12.3.2 Market Triangulation
12.3.3 Forecasting
12.4 Study Declarations
12.5 Report Assumptions
12.6 Stakeholders
12.7 Abbreviations
TABLE 1 GLOBAL ELECTRONIC POLYMERS MARKET VALUE, BY TYPE, 2016–2023 ($MILLION)
TABLE 2 GLOBAL ELECTRONIC POLYMERS MARKET VOLUME, BY TYPE, 2016–2023 (KILOTONS)
TABLE 3 GLOBAL ELECTROACTIVE POLYMERS MARKET VALUE, BY GEOGRAPHY, 2016–2023 ($MILLION)
TABLE 4 GLOBAL ELECTROACTIVE POLYMERS MARKET VOLUME, BY GEOGRAPHY, 2016–2023 (KILOTONS)
TABLE 5 GLOBAL MAGNETIC POLYMERS MARKET VALUE, BY GEOGRAPHY, 2016–2023 ($MILLION)
TABLE 6 GLOBAL MAGNETIC POLYMERS MARKET VOLUME, BY GEOGRAPHY, 2016–2023 (KILOTONS)
TABLE 7 GLOBAL ELECTRONIC POLYMERS MARKET VALUE, BY APPLICATIONS, 2016–2023 ($MILLION)
TABLE 8 GLOBAL ELECTRONIC POLYMERS MARKET VOLUME, BY APPLICATIONS, 2016–2023 (KILOTONS)
TABLE 9 GLOBAL ELECTRONIC POLYMERS IN ELECTRICAL & ELECTRONICS MARKET VALUE, BY GEOGRAPHY, 2016–2023 ($MILLION)
TABLE 10 GLOBAL ELECTRONIC POLYMERS IN ELECTRICAL & ELECTRONICS MARKET VOLUME, BY GEOGRAPHY, 2016–2023 (KILOTONS)
TABLE 11 GLOBAL ELECTRONIC POLYMERS MARKET IN PACKAGING & LABELING MARKET VALUE, BY GEOGRAPHY, 2016–2023 ($MILLION)
TABLE 12 GLOBAL ELECTRONIC POLYMERS MARKET IN PACKAGING & LABELING MARKET VOLUME, BY GEOGRAPHY, 2016–2023 (KILOTONS)
TABLE 13 GLOBAL ELECTRONIC POLYMERS IN HEALTHCARE DEVICES MARKET VALUE, BY GEOGRAPHY, 2016–2023 ($MILLION)
TABLE 14 GLOBAL ELECTRONIC POLYMERS IN HEALTHCARE DEVICES MARKET VOLUME, BY GEOGRAPHY, 2016–2023 (KILOTONS)
TABLE 15 GLOBAL ELECTRONIC POLYMERS IN AUTOMOTIVE MARKET VALUE, BY GEOGRAPHY, 2016–2023 ($MILLION)
TABLE 16 GLOBAL ELECTRONIC POLYMERS IN AUTOMOTIVE MARKET VOLUME, BY GEOGRAPHY, 2016–2023 (KILOTONS)
TABLE 17 GLOBAL ELECTRONIC POLYMERS MARKET VALUE, BY GEOGRAPHY, 2016–2023 ($MILLION)
TABLE 18 GLOBAL ELECTRONIC POLYMERS MARKET VOLUME, BY GEOGRAPHY, 2016–2023 (KILOTONS)
TABLE 19 ASIA PACIFIC ELECTRONIC POLYMERS MARKET VALUE, BY GEOGRAPHY, 2016–2023 ($MILLION)
TABLE 20 ASIA PACIFIC ELECTRONIC POLYMERS MARKET VOLUME, BY GEOGRAPHY, 2016–2023 (KILOTONS)
TABLE 21 ASIA PACIFIC ELECTRONIC POLYMERS MARKET VALUE, BY TYPE, 2016–2023 ($MILLION)
TABLE 22 ASIA PACIFIC ELECTRONIC POLYMERS MARKET VOLUME, BY TYPE, 2016–2023 (KILOTONS)
TABLE 23 ASIA PACIFIC ELECTRONIC POLYMERS MARKET VALUE, BY APPLICATIONS, 2016–2023 ($MILLION)
TABLE 24 ASIA PACIFIC ELECTRONIC POLYMERS MARKET VOLUME, BY APPLICATIONS, 2016–2023 (KILOTONS)
TABLE 25 NORTH AMERICA ELECTRONIC POLYMERS MARKET VALUE, BY GEOGRAPHY, 2016–2023 ($MILLION)
TABLE 26 NORTH AMERICA ELECTRONIC POLYMERS MARKET VOLUME, BY GEOGRAPHY, 2016–2023 (KILOTONS)
TABLE 27 NORTH AMERICA ELECTRONIC POLYMERS MARKET VALUE, BY TYPE, 2016–2023 ($MILLION)
TABLE 28 NORTH AMERICA ELECTRONIC POLYMERS MARKET VOLUME, BY TYPE, 2016–2023 (KILOTONS)
TABLE 29 NORTH AMERICA ELECTRONIC POLYMERS MARKET VALUE, BY APPLICATIONS, 2016–2023 ($MILLION)
TABLE 30 NORTH AMERICA ELECTRONIC POLYMERS MARKET VOLUME, BY APPLICATIONS, 2016–2023 (KILOTONS)
TABLE 31 EUROPE ELECTRONIC POLYMERS MARKET VALUE, BY GEOGRAPHY, 2016–2023 ($MILLION)
TABLE 32 EUROPE ELECTRONIC POLYMERS MARKET VOLUME, BY GEOGRAPHY, 2016–2023 (KILOTONS)
TABLE 33 EUROPE ELECTRONIC POLYMERS MARKET VALUE, BY TYPE, 2016–2023 ($MILLION)
TABLE 34 EUROPE ELECTRONIC POLYMERS MARKET VOLUME, BY TYPE, 2016–2023 (KILOTONS)
TABLE 35 EUROPE ELECTRONIC POLYMERS MARKET VALUE, BY APPLICATIONS, 2016–2023 ($MILLION)
TABLE 36 EUROPE ELECTRONIC POLYMERS MARKET VOLUME, BY APPLICATIONS, 2016–2023 (KILOTONS)
TABLE 37 REST OF THE WORLD ELECTRONIC POLYMERS MARKET VALUE, BY GEOGRAPHY, 2016–2023 ($MILLION)
TABLE 38 REST OF THE WORLD ELECTRONIC POLYMERS MARKET VOLUME, BY GEOGRAPHY, 2016–2023 (KILOTONS)
TABLE 39 REST OF THE WORLD ELECTRONIC POLYMERS MARKET VALUE, BY TYPE, 2016–2023 ($MILLION)
TABLE 40 REST OF THE WORLD ELECTRONIC POLYMERS MARKET VOLUME, BY TYPE, 2016–2023 (KILOTONS)
TABLE 41 REST OF THE WORLD ELECTRONIC POLYMERS MARKET VALUE, BY APPLICATIONS, 2016–2023 ($MILLION)
TABLE 42 REST OF THE WORLD ELECTRONIC POLYMERS MARKET VOLUME, BY APPLICATIONS, 2016–2023 (KILOTONS)
TABLE 43 AWARD AND RECOGNITION, 2013–2017
TABLE 44 EXHIBITION & EXPANSIONS, 2013–2017
TABLE 45 PRODUCT LAUNCHES, 2013–2018
TABLE 46 BASF: PRODUCT PROFILE
TABLE 47 BASF: RECENT DEVELOPEMENTS
TABLE 48 DOWDUPONT: PRODUCT PROFILE
TABLE 49 DOWDUPONT: RECENT DEVELOPMENTS
TABLE 50 COVESTRO: PRODUCT PROFILE
TABLE 51 COVESTRO: RECENT DEVELOPMENTS
TABLE 52 AU OPTRONICS CORP: PRODUCT PROFILE
TABLE 53 AU OPTRONICS CORP: RECENT DEVELOPMENTS
TABLE 54 MERCK: PRODUCT PROFILE
TABLE 55 MERCK: RECENT DEVELOPMENTS
TABLE 56 JINKO SOLAR: BUSINESS UNITS
TABLE 57 LG DISPLAY: BUSINESS UNITS
TABLE 58 SAMSUNG: BUSINESS UNITS
TABLE 59 GENERAL ELECTRIC: BUSINESS UNITS
TABLE 60 M: BUSINESS UNITS
Research Framework
Infoholic Research works on a holistic 360° approach in order to deliver high quality, validated and reliable information in our market reports. The Market estimation and forecasting involves following steps:
- Data Collation (Primary & Secondary)
- In-house Estimation (Based on proprietary data bases and Models)
- Market Triangulation
- Forecasting

Market related information is congregated from both primary and secondary sources.
Primary sources
Involved participants from all global stakeholders such as Solution providers, service providers, Industry associations, thought leaders etc. across levels such as CXOs, VPs and managers. Plus, our in-house industry experts having decades of industry experience contribute their consulting and advisory services.
Secondary sources
Include public sources such as regulatory frameworks, government IT spending, government demographic indicators, industry association statistics, and company publications along with paid sources such as Factiva, OneSource, Bloomberg among others.
![]()


