
Elastomeric Sealant Market By Type (Silicone, Polyurethane, Polysulfide), By End-User (Construction, Automotive & Transportation, Electronic) and By Geography – Global Driver, Restraints, Opportunities, Trends, and Forecast to 2023
- April, 2018
- Domain: Chemicals, Materials & Food - Specialty Chemicals,Adhesive & Sealants
- Get Free 10% Customization in this Report
The elastomeric sealant is an elastic and durable sealant designed to provide rubbery texture that dries hard but retains flexibility. The term elastomeric refers to the capability of the material; it is the ability of a material to elongate when stress is applied and return to its original shape and size when the stress is removed. Elastomeric sealants have the advanced properties of universal application to control moisture and water. In the recent years, the popularity of sealants has grown extraordinarily with the global sealants market attracting a significant share.
Research Methodology
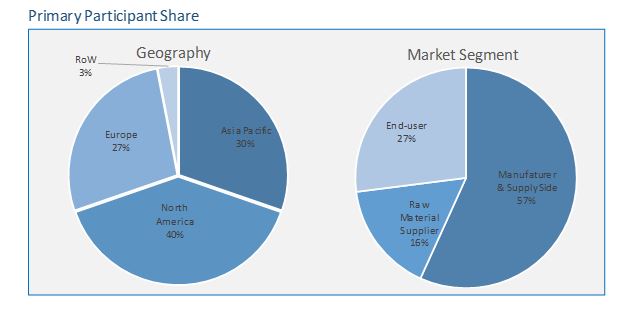
The elastomeric sealants market has been analyzed by utilizing the optimum combination of secondary sources and in-house methodology along with an irreplaceable blend of primary insights. The real-time assessment of the market is an integral part of our market sizing and forecasting methodology. Our industry experts and panel of primary participants helped in compiling relevant aspects with realistic parametric estimations for a comprehensive study. The participation share of different categories of primary participants is given below:
Key Market Insights
Elastomeric sealants have created a niche market in various applications. Several types of elastomeric sealants are present in the market. The types include a variety of materials such as silicones, rubber, polyurethanes, and polysulfide resins. The elastomeric sealants are not the same as latex caulk or ordinary silicone-based sealants. The main difference is that elastomeric sealant is made in such a way that it remains permanently flexible.
The extensive use of these sealants in construction and automotive sectors has given a massive boost to the elastomeric sealant market in the recent years. The rapid growth in economies across the globe and the increasing per capita income among consumers in developing countries are increasing the demand for automobiles. This, in turn, is increasing the demand for elastomeric sealants on automobiles. The construction sector is presently leading the market and is expected to remain the same during the forecast years. Emerging economies such as China, India, and Brazil are looking forward to take advantage of the benefits of acoustic sealants. Further, the industrial and infrastructural market growth is expected to foster the elastomeric sealants market.
Asia Pacific is the largest elastomeric sealants market globally due to the presence of export-oriented manufacturing capacities and intense domestic demand from various end-user industries. The increase in automobile manufacturing and building construction is further driving the market growth in the region. The anticipated economic stability in Europe is expected to boost its manufacturing sector, complementing the growth of the elastomeric sealants market. North America is likely to remain the key region with a significant contribution coming from the US. Few of the prominent companies operating in the acoustic sealants market are BASF SE, 3M, Dow Corning Corporation, General Electric, and Evonik Industries AG.
Types:
- Silicone
- Polyurethane
- Polysulfide
- Others
End-users:
- Construction
- Automotive & Transportation
- Electronic
- Others
Geography:
- Asia Pacific
- North America
- Europe
- Rest of the World
1 Report Outline
1.1 Introduction
1.2 Report Scope
1.3 Market Definition
1.4 Research Methodology
1.4.1 Data Collation & In-house Estimation
1.4.2 Market Triangulation
1.4.3 Forecasting
1.5 Study Declarations
1.6 Report Assumptions
1.7 Stakeholders
2 Executive Summary
2.1 Asia Pacific Has Highest Growth Rate in the Acoustic Sealant Market
2.2 Acoustic sealant in construction is Increasing Its Lead With High Growth Coming From Developing Countries
3 Market Positioning
3.1 Total Addressable Market: acoustic insulation market
3.1.1 Market Overview
3.1.2 Major Trends
3.2 Segmented Addressable Market
3.3 Related Markets
4 Market Outlook
4.1 Overview
4.2 Value Chain Analysis
4.3 PESTLE Analysis
4.4 Porter 5 (Five) Forces
4.5 Patent Analysis
5 Market Characteristics
5.1 Market Segmentation
5.2 Market Dynamics
5.2.1 Drivers
5.2.1.1 Increasing demand of comfort life in big cities
5.2.1.2 Rising health concerns and stringent regulatory environment
5.2.2 Restraints
5.2.2.1 Raw material price fluctuations
5.2.2.2 Low awareness of acoustic sealants in emerging economies
5.2.3 Opportunities
5.2.3.1 Technological development in the products
5.2.3.2 Large untapped market in developing and underdeveloped countries
5.2.4 DRO – Impact Analysis
6 By Type: Market Size and Analysis
6.1 Overview
6.2 Acrylic Acoustic sealant
6.3 Silicone Acoustic Sealant
6.4 Polyurethane Acoustic sealant
6.5 Vendor Profiles
6.5.1 BASF SE
6.5.2 3M
6.5.3 Dow Corning Corporation
6.5.4 General Electric (GE)
6.5.5 Evonik Industries AG
(Overview, business units, geographic revenue, product profile, recent developments, business focus, SWOT analysis, business strategies have been covered for all vendors)
7 End-user: Market Size And Analysis
7.1 Overview
7.2 Construction
7.3 Automotive
7.4 Electronic Equipment
7.5 Customer Profile
7.5.1 Boeing Corporation
7.5.2 Bechtel Corporation
7.5.3 Toyota Motor Corporation
7.5.4 Siemens AG
7.5.5 VINCI
(Overview, business units, geographic revenue, recent developments, business focus, SWOT analysis, business strategies have been covered for all customers)
8 Regions: Market Size and Analysis
8.1 Overview
8.2 Asia Pacific
8.2.1 Asia Pacific Market by Countries
8.2.2 Asia Pacific Market by Type
8.2.3 Asia Pacific Market by End-user
8.3 North America
8.3.1 North America Market by Countries
8.3.2 North America Market by type
8.3.3 North America Market by End-user
8.4 Europe
8.4.1 Europe Market by Country
8.4.2 Europe Market by type
8.4.3 Europe Market by End-user
8.5 Rest of the World
8.5.1 Rest of the World Market by Regions
8.5.2 Rest of the World Market by Type
8.5.3 Rest of the World Market by End-user
9 Companies to watch for
9.1 BOSTIK Technologies Corp.,
9.1.1 Overview
9.2 H.B. Fuller’s passed the American Architectural Manufacturers Association (AAMA)
10 Competitive Landscape
10.1 Competitor Comparison Analysis
10.2 Market Landscape
10.2.1 Mergers, Acquisitions, & Joint Ventures
10.2.2 Awards & Recognizing
10.2.3 Exhibition & Product Launch
10.2.4 Divestment & divestiture
11 Expert’s Views
12 Annexure
Abbreviations
TABLE 1 GLOBAL ACOUSTIC SEALANT MARKET REVENUE BY TYPE, 2016-2023 ($MILLION) 31
TABLE 2 GLOBAL ACOUSTIC SEALANT MARKET VOLUME BY TYPE, 2016-2023 (KILOTONS) 32
TABLE 3 GLOBAL ACRYLIC ACOUSTIC SEALANT MARKET REVENUE, BY GEOGRAPHY, 2016-2023 ($MILLION) 33
TABLE 4 GLOBAL ACRYLIC ACOUSTIC SEALANT MARKET VOLUME, BY GEOGRAPHY, 2016-2023 (KILOTONS) 33
TABLE 5 GLOBAL SILICONE ACOUSTIC SEALANT MARKET REVENUE, BY GEOGRAPHY, 2016-2023 ($MILLION) 34
TABLE 6 GLOBAL SILICONE ACOUSTIC SEALANT MARKET VOLUME, BY GEOGRAPHY, 2016-2023 (KILOTONS) 35
TABLE 7 GLOBAL POLYURTHANE ACOUSTIC SEALANT MARKET REVENUE, BY GEOGRAPHY, 2016-2023 ($MILLION) 36
TABLE 8 GLOBAL POLYURETHANE ACOUSTIC SEALANT MARKET VOLUME, BY GEOGRAPHY, 2016-2023 (KILOTONS) 36
TABLE 9 BASF SE: PRODUCT PROFILE 41
TABLE 10 BASF SE: RECENT DEVELOPMENTS 41
TABLE 11 3M: PRODUCT PROFILE 46
TABLE 12 3M: RECENT DEVELOPMENTS 46
TABLE 13 DOW CORNING CORPORATION: PRODUCT PROFILE 49
TABLE 14 DOW CORNING CORPORATION: RECENT DEVELOPMENTS 50
TABLE 15 GENERAL ELECTRIC: PRODUCT PROFILE 55
TABLE 16 GENERAL ELECTRIC: BUSINESS ACTIVITIES 55
TABLE 17 GE: RECENT DEVELOPMENTS 56
TABLE 18 EVONIK: PRODUCT PROFILE 61
TABLE 19 EVONIK: RECENT DEVELOPMENTS 61
TABLE 20 GLOBAL ACOUSTIC SEALANT MARKET REVENUE BY END-USER, 2016-2023 ($MILLION) 63
TABLE 21 GLOBAL ACOUSTIC SEALANT MARKET VOLUME BY END USERS, 2016-2023 (KILOTONS) 64
TABLE 22 GLOBAL ACOUSTIC SEALANT IN CONSTRUCTION MARKET REVENUE, BY GEOGRAPHY, 2016-2023 ($MILLION) 65
TABLE 23 GLOBAL ACOUSTIC SEALANT IN CONSTRUCTION MARKET VOLUME, BY GEOGRAPHY, 2016-2023 (KILOTONS) 65
TABLE 24 GLOBAL ACOUSTIC SEALANT IN AUTOMOTIVE MARKET REVENUE, BY GEOGRAPHY, 2016-2023 ($MILLION) 66
TABLE 25 GLOBAL ACOUSTIC SEALANT IN AUTOMOTIVE MARKET VOLUME, BY GEOGRAPHY, 2016-2023 (KILOTONS) 67
TABLE 26 GLOBAL ACOUSTIC SEALANT IN ELECTRONIC EQUIPMENT MARKET REVENUE, BY GEOGRAPHY, 2016-2023 ($MILLION) 68
TABLE 27 GLOBAL ACOUSTIC SEALANT IN ELECTRONIC EQUIPMENT MARKET VOLUME, BY GEOGRAPHY, 2016-2023 (KILOTONS) 68
TABLE 28 BOEING CORPORATION: RECENT DEVELOPMENTS 72
TABLE 29 BETCHEL CORPORATION: PRODUCT PROFILE 75
TABLE 30 TOYOTA: PRODUCT PROFILE 80
TABLE 31 TOYOTA: RECENT DEVELOPMENTS 81
TABLE 32 SIEMENS AG: RECENT DEVELOPMENTS 87
TABLE 33 GLOBAL ACOUSTIC SEALANT MARKET VALUE, BY GEOGRAPHY, 2016−2023 ($MILLION) 93
TABLE 34 GLOBAL ACOUSTIC SEALANT MARKET VOLUME, BY GEOGRAPHY, 2016−2023 (KILOTONS) 94
TABLE 35 ASIA PACIFIC ACOUSTIC SEALANT VALUE, BY COUNTRY, 2016−2023 ($MILLION) 95
TABLE 36 ASIA PACIFIC ACOUSTIC SEALANT MARKET VOLUME, BY COUNTRY, 2016−2023 (KILOTONS) 95
TABLE 37 ASIA PACIFIC ACOUSTIC SEALANT MARKET VALUE, BY TYPE, 2016−2023 ($MILLION) 96
TABLE 38 ASIA PACIFIC ACOUSTIC SEALANT MARKET VOLUME, BY TYPE, 2016−2023 (KILOTONS) 97
TABLE 39 ASIA PACIFIC ACOUSTIC SEALANT MARKET VALUE, BY END-USER, 2016−2023 ($MILLION) 98
TABLE 40 ASIA PACIFIC ACOUSTIC SEALANT MARKET VOLUME, BY END-USER, 2016−2023 (KILOTONS) 98
TABLE 41 NORTH AMERICA ACOUSTIC SEALANT MARKET VALUE, BY COUNTRY, 2016−2023 ($MILLION) 100
TABLE 42 NORTH AMERICA ACOUSTIC SEALANT MARKET VOLUME, BY COUNTRY, 2016−2023 (KILOTONS) 100
TABLE 43 NORTH AMERICA ACOUSTIC SEALANT MARKET VALUE, BY TYPE, 2016−2023 ($MILLION) 101
TABLE 44 NORTH AMERICA ACOUSTIC SEALANT MARKET VOLUME, BY TYPE, 2016−2023 (KILOTONS) 101
TABLE 45 NORTH AMERICA ACOUSTIC SEALANT MARKET VALUE, BY END-USER, 2016−2023 ($MILLION) 103
TABLE 46 NORTH AMERICA ACOUSTIC SEALANT MARKET VOLUME, BY END-USER, 2016−2023 (KILOTONS) 103
TABLE 47 EUROPE ACOUSTIC SEALANT MARKET VALUE, BY COUNTRY, 2016−2023 ($MILLION) 104
TABLE 48 EUROPE ACOUSTIC SEALANT MARKET VOLUME, BY COUNTRY, 2016−2023 105
TABLE 49 EUROPE ACOUSTIC SEALANT MARKET VALUE, BY TYPE, 2016−2023 ($MILLION) 106
TABLE 50 EUROPE ACOUSTIC SEALANT MARKET VOLUME, BY TYPE, 2016−2023 (KILOTONS) 106
TABLE 51 EUROPE ACOUSTIC SEALANT MARKET VALUE, BY END-USER, 2016−2023 ($MILLION) 107
TABLE 52 EUROPE ACOUSTIC SEALANT MARKET VOLUME, BY END USER, 2016−2023 (KILOTONS) 108
TABLE 53 REST OF THE WORLD ACOUSTIC SEALANT MARKET VALUE, BY GEOGRAPHY, 2016−2023 ($MILLION) 109
TABLE 54 REST OF THE WORLD ACOUSTIC SEALANT MARKET VOLUME, BY GEOGRAPHY, 2016−2023 (KILOTONS) 109
TABLE 55 REST OF THE WORLD ACOUSTIC SEALANT MARKET VALUE, BY TYPE, 2016−2023 ($MILLION) 110
TABLE 56 REST OF THE WORLD ACOUSTIC SEALANT MARKET VOLUME, BY TYPE, 2016−2023 (KILOTONS) 111
TABLE 57 REST OF THE WORLD ACOUSTIC SEALANT MARKET VALUE, BY END-USER, 2016−2023 ($MILLION) 112
TABLE 58 REST OF THE WORLD ACOUSTIC SEALANT MARKET VOLUME, BY END-USER, 2016−2023 (KILOTONS) 112
TABLE 59 MERGERS, ACQUISITIONS, & JOINT VENTURES 116
TABLE 60 AWARD & RECOGNIZING 117
TABLE 61 EXHIBITION & PRODUCT LAUNCH 118
TABLE 62 DIVESTMENT & DIVESTITURE
Research Framework
Infoholic Research works on a holistic 360° approach in order to deliver high quality, validated and reliable information in our market reports. The Market estimation and forecasting involves following steps:
- Data Collation (Primary & Secondary)
- In-house Estimation (Based on proprietary data bases and Models)
- Market Triangulation
- Forecasting

Market related information is congregated from both primary and secondary sources.
Primary sources
Involved participants from all global stakeholders such as Solution providers, service providers, Industry associations, thought leaders etc. across levels such as CXOs, VPs and managers. Plus, our in-house industry experts having decades of industry experience contribute their consulting and advisory services.
Secondary sources
Include public sources such as regulatory frameworks, government IT spending, government demographic indicators, industry association statistics, and company publications along with paid sources such as Factiva, OneSource, Bloomberg among others.
![]()


