
Edge Computing Market by Component (Hardware, Platform, Services), Application (Smart Cities, IIoT, Content Delivery, Remote Monitoring, AR, VR), Organization Size, Vertical, and Geography – Global Drivers, Restraints, Opportunities, Trends, and Forecast up to 2026
- August, 2020
- Domain: ICT - Telecommunications
- Get Free 10% Customization in this Report
Edge computing is a comprehensive process to enhance cloud computing systems. It specifically refers to the technologies that allow computation to perform at the edge of the network. These services are conducted on downstream data in the place of cloud services and upstream data in place of IoT services. Edge computing also helps in aligning data acquisition and handle functions, storage of high bandwidth content, and applications closer to the end-user. Edge computing also assists in effective data management as data processing, and data filtering can be carryout at the edge of the network, depicting cleaner data sets for cloud-based data analytics. Edge computing market growth is credited to the factors such as drastic usage of internet of things in industries, high demand for low-latency in a computer process, and self-executing decision-making solutions.
The scope of the Edge Computing Market is defined in the market analysis as follows:
- Based on components
- Hardware
- Platform
- Services
- Based on Applications
- Smart Cities
- Location Services
- Analytics
- Environemental Monitoring
- Optimized Local Content
- Data Caching
- Augmented Reality
- Others
- Based on Organization sizes
- Small and Medium-sized Enterprises (SMEs)
- Large Enterprises
- Based on Verticals
- Vertical
- Manufaturing
- Healthcare
- Transportation
- Government
- Media and Entertainment
- Energy and Utilities
- Telecom & IT
- Retail
- Others
- Based on Geography:
- North America
- Europe
- Asia Pacific
- Rest of the World
The market by component includes hardware, platform, and services. The hardware component is assumed to take up the major market size in the forecast period, for the reason that the large-scale acquisition of hardware components for decentralizing storage and computing operations, enabling inclusive edge infrastructure deployment, and decreasing network traffic. Organizations provide upgraded edge computing hardware that either work as an initial point of data source or a facilitator of the total network or performs as storage and local processing unit in the overall edge computing procedure. Further, in the edge computing market by application, the smart cities application possesses major share as it augments the security of the buildings in the cities, automatic facilities in the home and enhances the management of the traffic in the smart city to tackle with the heavy traffic in the metro cities.
The acquisition of edge computing solutions in large enterprises is extreme since the growing trend of data, which is accredited to the widely spread geographical existence and regular customers. Moreover, the rising demand of employees to ingress computing solutions and applications everywhere while secure and proper data storage propelling the demand of edge computing solutions in large enterprises. For example, large manufacturing companies required to correspond with ample data from sensors or actuators connected to their physical assets, such as machines, turbines, and lifts with historical information. Therefore, this helps them to identify or estimate failures in a short time to ignore pause time and loss in production.
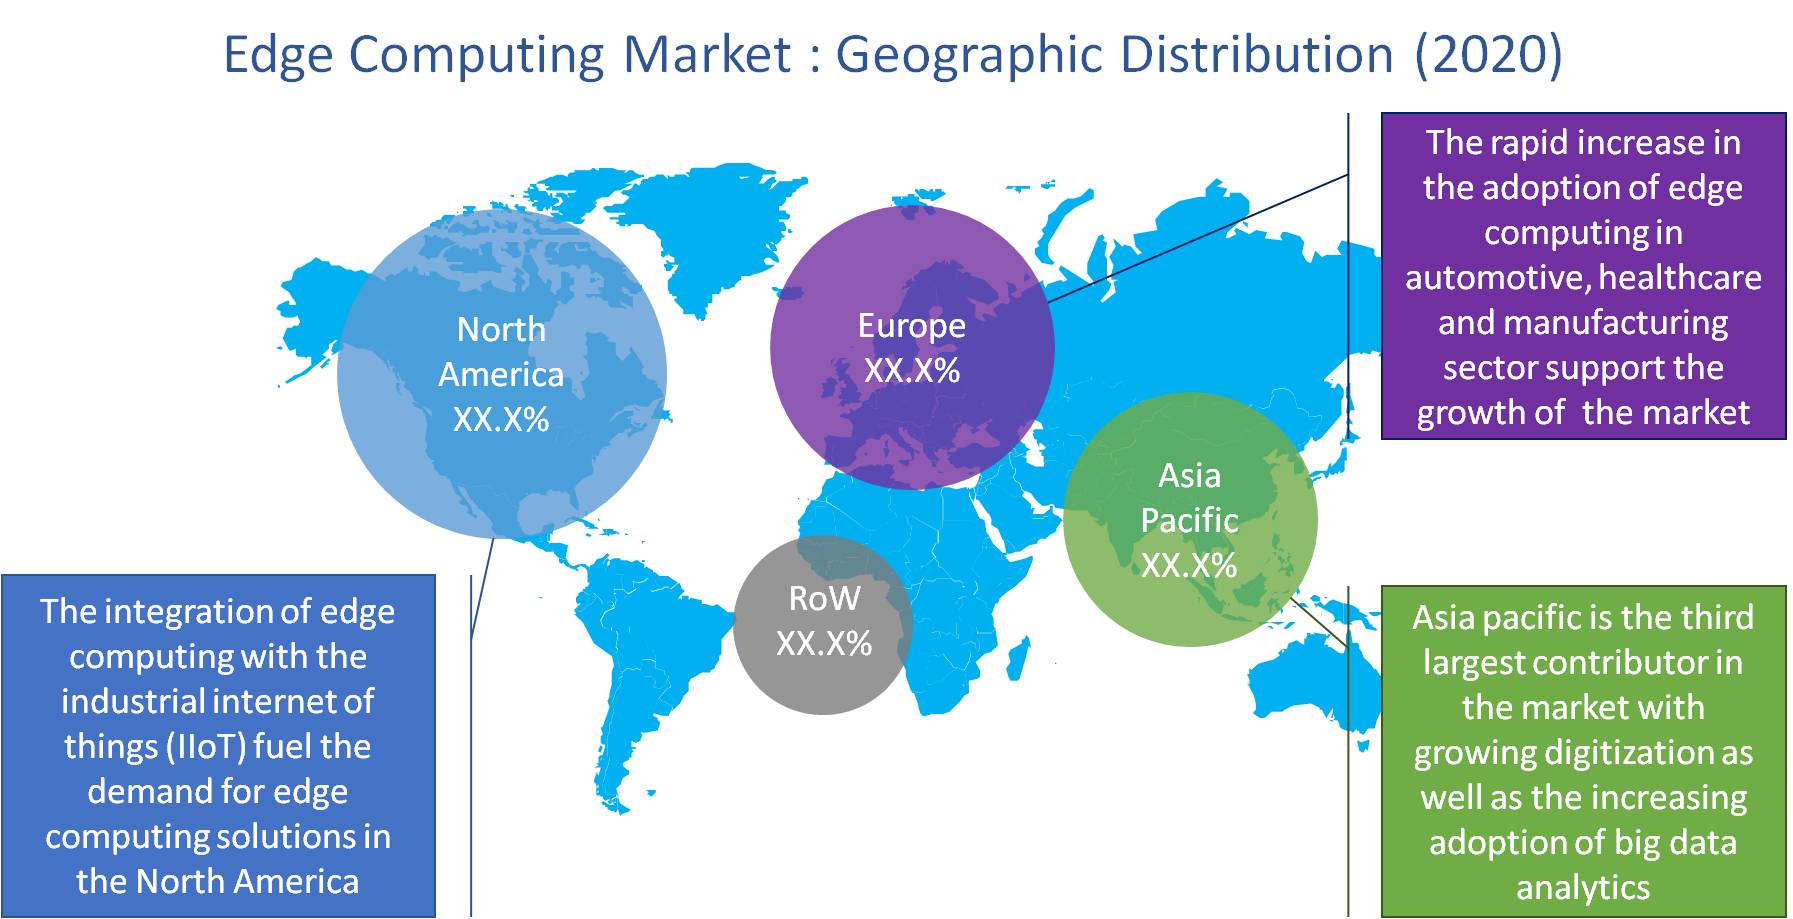
North America is considered as the largest revenue-generating region in this market. The integration of edge computing with the industrial internet of things (IIoT) has intensified manufacturers in the U.S to move towards connected factories. Additionally, the arrival of various start-ups providing opportunities to develop an edge-enabled solution is pushing the industry growth in this region.
Globally, the Edge Computing Market will grow at a CAGR of 37.5% during the forecast period, with a base value of $4.04 billion in 2020, to $26.62 billion in 2026. The factors pushing this market growth are the increasing usage of ‘internet of things’ in all sectors for the easy flow of work without human-to-human interaction, increasing demand for automatic decision-making solutions, and overcoming the drastic increase in data.
The report also includes the analysis of major players in the Edge Computing market. Some of the major players consist of Cisco, HPE, Huawei, Unit4, Dell Technologies, Microsoft Corporation, NOKIA, IBM, Foghorn Systems, and Machineshop.
Hence, the arrival of automated vehicles and connected car technology enhances the effectiveness of edge computing. This study will assist the major competitors in knowing the significant market tendency, market fluctuations, and potential needs of the end-users.
- This report provides a complete analysis of present factors driving the market, market opportunities, conflicts, and challenges faced by the players.
- Edge computing market's overall analysis based on different segments is presented in this research.
- Edge computing market is analyzed quantitatively which enables the users to understand the market evolution in all four geographical regions
1. Executive Summary
2. Industry Outlook
2.1. Industry Overview
2.2. Industry Trends
3. Market Snapshot
3.1. Total Addressable Market
3.2. Segment Addressable Market
3.2.1. PEST Analysis
3.2.2. Porter Five Forces
3.3. Related Markets
3.4. Ecosystem
4. Market Outlook
4.1. Overview
4.1.1. Market Evolution
4.2. Market Trends and Impact
4.3. Pricing Analysis
4.4. Market Segmentation
4.5. Market Dynamics
4.5.1. Drivers
4.5.2. Restraints
4.5.3. Opportunities
4.6. DRO - Impact Analysis
5. Component: Market Size & Analysis
5.1. Overview
5.2. Hardware
5.3. Platform
5.4. Services
6. Vertical: Market Size & Analysis
6.1. Overview
6.2. Vertical
6.3. Manufaturing
6.4. Healthcare
6.5. Transportation
6.6. Government
6.7. Media and Entertainment
6.8. Energy and Utilities
6.9. Telecom & IT
6.10. Retail
6.11. Others
7. Application: Market Size & Analysis
7.1. Overview
7.2. Smart Cities
7.3. Location Services
7.4. Analytics
7.5. Environemental Monitoring
7.6. Optimized Local Content
7.7. Data Caching
7.8. Augmented Reality
7.9. Others
8. Organization Sizes: Market Size & Analysis
8.1. Overview
8.2. Small and Medium-sized Enterprises
8.3. Large Enterprises
9. Geography: Market Size & Analysis
9.1. Overview
9.2. North America
9.3. Europe
9.4. Asia Pacific
9.5. Rest of the World
10. Competitive Landscape
10.1. Competitor Comparison Analysis
10.2. Market Developments
10.3. Mergers and Acquisitions, Legal, Awards, Partnerships
10.4. Product Launches and execution
11. Vendor Profiles
11.1. Cisco
11.1.1. Overview
11.1.2. Business Units
11.1.3. Geographic Revenue
11.1.4. Product Offerings
11.1.5. Developments
11.1.6. Business Strategy
11.2. HPE
11.2.1. Overview
11.2.2. Business Units
11.2.3. Geographic Revenue
11.2.4. Product Offerings
11.2.5. Developments
11.2.6. Business Strategy
11.3. Huawei
11.3.1. Overview
11.3.2. Business Units
11.3.3. Geographic Revenue
11.3.4. Product Offerings
11.3.5. Developments
11.3.6. Business Strategy
11.4. Unit4
11.4.1. Overview
11.4.2. Business Units
11.4.3. Geographic Revenue
11.4.4. Product Offerings
11.4.5. Developments
11.4.6. Business Strategy
11.5. Dell Technologies
11.5.1. Overview
11.5.2. Business Units
11.5.3. Geographic Revenue
11.5.4. Product Offerings
11.5.5. Developments
11.5.6. Business Strategy
11.6. NOKIA
11.6.1. Overview
11.6.2. Business Units
11.6.3. Geographic Revenue
11.6.4. Product Offerings
11.6.5. Developments
11.6.6. Business Strategy
11.7. Microsoft Corporation
11.7.1. Overview
11.7.2. Business Units
11.7.3. Geographic Revenue
11.7.4. Product Offerings
11.7.5. Developments
11.7.6. Business Strategy
11.8. IBM
11.8.1. Overview
11.8.2. Business Units
11.8.3. Geographic Revenue
11.8.4. Product Offerings
11.8.5. Developments
11.8.6. Business Strategy
11.9. Foghorn Systems
11.9.1. Overview
11.9.2. Business Units
11.9.3. Geographic Revenue
11.9.4. Product Offerings
11.9.5. Developments
11.9.6. Business Strategy
11.10. Machineshop
11.10.1. Overview
11.10.2. Business Units
11.10.3. Geographic Revenue
11.10.4. Product Offerings
11.10.5. Developments
11.10.6. Business Strategy
12. Companies to Watch
12.1. Saguna Networks
12.1.1. Overview
12.1.2. Market
12.1.3. Business Strategy
12.2. Litmus Automation
12.2.1. Overview
12.2.2. Market
12.2.3. Business Strategy
12.3. Sixsq
12.3.1. Overview
12.3.2. Market
12.3.3. Business Strategy
12.4. Azion Technologies
12.4.1. Overview
12.4.2. Market
12.4.3. Business Strategy
12.5. Vapor Io
12.5.1. Overview
12.5.2. Market
12.5.3. Business Strategy
12.6. Adlink
12.6.1. Overview
12.6.2. Market
12.6.3. Business Strategy
12.7. Altran
12.7.1. Overview
12.7.2. Market
12.7.3. Business Strategy
12.8. Axellio
12.8.1. Overview
12.8.2. Market
12.8.3. Business Strategy
13. Analyst Opinion
14. Annexure
14.1. Report Scope
14.2. Market Definitions
14.3. Research Methodology
14.3.1. Data Collation and In-house Estimation
14.3.2. Market Triangulation
14.3.3. Forecasting
14.4. Report Assumptions
14.5. Declarations
14.6. Stakeholders
14.7. Abbreviations
TABLE 1. GLOBAL EDGE COMPUTING MARKET VALUE, BY COMPONENT, 2020-2026 (USD MILLION)
TABLE 2. GLOBAL EDGE COMPUTING MARKET VALUE FOR HARDWARE, BY GEOGRAPHY, 2020-2026 (USD MILLION)
TABLE 3. GLOBAL EDGE COMPUTING MARKET VALUE FOR PLATFORM, BY GEOGRAPHY, 2020-2026 (USD MILLION)
TABLE 4. GLOBAL EDGE COMPUTING MARKET VALUE FOR SERVICES, BY GEOGRAPHY, 2020-2026 (USD MILLION)
TABLE 5. GLOBAL EDGE COMPUTING MARKET VALUE, BY VERTICAL, 2020-2026 (USD MILLION)
TABLE 6. GLOBAL EDGE COMPUTING MARKET VALUE FOR MANUFACTURING, BY GEOGRAPHY, 2020-2026 (USD MILLION)
TABLE 7. GLOBAL EDGE COMPUTING MARKET VALUE FOR HEALTHCARE, BY GEOGRAPHY, 2020-2026 (USD MILLION)
TABLE 8. GLOBAL EDGE COMPUTING MARKET VALUE FOR TRANSPORTATION, BY GEOGRAPHY, 2020-2026 (USD MILLION)
TABLE 9. GLOBAL EDGE COMPUTING MARKET VALUE FOR GOVERNMENT, BY GEOGRAPHY, 2020-2026 (USD MILLION)
TABLE 10. GLOBAL EDGE COMPUTING MARKET VALUE FOR MEDIA AND ENTERTAINMENT, BY GEOGRAPHY, 2020-2026 (USD MILLION)
TABLE 11. GLOBAL EDGE COMPUTING MARKET VALUE FOR ENERGY AND UTILITIES, BY GEOGRAPHY, 2020-2026 (USD MILLION)
TABLE 12. GLOBAL EDGE COMPUTING MARKET VALUE FOR TELECOM & IT, BY GEOGRAPHY, 2020-2026 (USD MILLION)
TABLE 13. GLOBAL EDGE COMPUTING MARKET VALUE FOR RETAIL, BY GEOGRAPHY, 2020-2026 (USD MILLION)
TABLE 14. GLOBAL EDGE COMPUTING MARKET VALUE FOR OTHER, BY GEOGRAPHY, 2020-2026 (USD MILLION)
TABLE 15.
TABLE 16. GLOBAL EDGE COMPUTING MARKET VALUE FOR APPLICATION, BY GEOGRAPHY, 2020-2026 (USD MILLION)
TABLE 17. GLOBAL EDGE COMPUTING MARKET VALUE FOR SMART CITIES, BY GEOGRAPHY, 2020-2026 (USD MILLION)
TABLE 18. GLOBAL EDGE COMPUTING MARKET VALUE FOR LOCATION SERVICES, BY GEOGRAPHY, 2020-2026 (USD MILLION)
TABLE 19. GLOBAL EDGE COMPUTING MARKET VALUE FOR ANALYTICS, BY GEOGRAPHY, 2020-2026 (USD MILLION)
TABLE 20. GLOBAL EDGE COMPUTING MARKET VALUE FOR ENVIRONEMENTAL MONITORING, BY GEOGRAPHY, 2020-2026 (USD MILLION)
TABLE 21. GLOBAL EDGE COMPUTING MARKET VALUE FOR OPTIMIZED LOCAL CONTENT, BY GEOGRAPHY, 2020-2026 (USD MILLION)
TABLE 22. GLOBAL EDGE COMPUTING MARKET VALUE FOR DATA CACHING, BY GEOGRAPHY, 2020-2026 (USD MILLION)
TABLE 23. GLOBAL EDGE COMPUTING MARKET VALUE FOR AUGMENTED REALITY, BY GEOGRAPHY, 2020-2026 (USD MILLION)
TABLE 24. GLOBAL EDGE COMPUTING MARKET VALUE FOR OTHERS, BY GEOGRAPHY, 2020-2026 (USD MILLION)
TABLE 25. NORTH AMERICA EDGE COMPUTING MARKET VALUE, BY COMPONENT, 2020-2026 (USD MILLION)
TABLE 26. NORTH AMERICA EDGE COMPUTING MARKET VALUE, BY VERTICAL, 2020-2026 (USD MILLION)
TABLE 27. NORTH AMERICA EDGE COMPUTING MARKET VALUE, BY APPLICATION, 2020-2026 (USD MILLION)
TABLE 28. NORTH AMERICA EDGE COMPUTING MARKET VALUE, BY ORGANIZATION SIZES, 2020-2026 (USD MILLION).
TABLE 29. EUROPE EDGE COMPUTING MARKET VALUE, BY COMPONENT, 2020-2026 (USD MILLION)
TABLE 30. EUROPE EDGE COMPUTING MARKET VALUE, BY VERTICAL, 2020-2026 (USD MILLION)
TABLE 31. EUROPE EDGE COMPUTING MARKET VALUE, BY APPLICATION, 2020-2026 (USD MILLION)
TABLE 32. EUROPE EDGE COMPUTING MARKET VALUE, BY ORGANIZATION SIZES, 2020-2026 (USD MILLION)
TABLE 33. ASIA PACIFIC EDGE COMPUTING MARKET VALUE, BY COMPONENT, 2020-2026 (USD MILLION)
TABLE 34. ASIA PACIFIC EDGE COMPUTING MARKET VALUE, BY VERTICAL, 2020-2026 (USD MILLION)
TABLE 35. ASIA PACIFIC EDGE COMPUTING MARKET VALUE, BY APPLICATION, 2020-2026 (USD MILLION)
TABLE 36. ASIA PACIFIC EDGE COMPUTING MARKET VALUE, BY ORGANIZATION SIZES, 2020-2026 (USD MILLION)
TABLE 37. LATIN AMERICA EDGE COMPUTING MARKET VALUE, BY COMPONENT, 2020-2026 (USD MILLION)
TABLE 38. LATIN AMERICA EDGE COMPUTING MARKET VALUE, BY VERTICAL, 2020-2026 (USD MILLION)
TABLE 39. LATIN AMERICA EDGE COMPUTING MARKET VALUE, BY APPLICATION, 2020-2026 (USD MILLION)
TABLE 40. LATIN AMERICA EDGE COMPUTING MARKET VALUE, BY ORGANIZATION SIZES, 2020-2026 (USD MILLION)
TABLE 41. MIDDLE EAST & AFRICA EDGE COMPUTING MARKET VALUE, BY COMPONENT, 2020-2026 (USD MILLION)
TABLE 42. MIDDLE EAST & AFRICA EDGE COMPUTING MARKET VALUE, BY VERTICAL, 2020-2026 (USD MILLION)
TABLE 43. MIDDLE EAST & AFRICA EDGE COMPUTING MARKET VALUE, BY APPLICATION, 2020-2026 (USD MILLION)
TABLE 44. MIDDLE EAST & AFRICA EDGE COMPUTING MARKET VALUE, BY ORGANIZATION SIZES, 2020-2026 (USD MILLION)
TABLE 45. CISCO.: OVERVIEW
TABLE 46. CISCO.: STRATEGIC SNAPSHOT
TABLE 47. CISCO.: BUSINESS OPPORTUNITIES AND OUTLOOK
TABLE 48. CISCO.: PRODUCT/SERVICE PORTFOLIO
TABLE 49. HPE: OVERVIEW
TABLE 50. HPE: STRATEGIC SNAPSHOT
TABLE 51. HPE: BUSINESS OPPORTUNITIES AND OUTLOOK
TABLE 52. HPE: PRODUCT/SERVICE PORTFOLIO
TABLE 53. HUAWEI: OVERVIEW
TABLE 54. HUAWEI: STRATEGIC SNAPSHOT
TABLE 55. HUAWEI: BUSINESS OPPORTUNITIES AND OUTLOOK
TABLE 56. HUAWEI: PRODUCT/SERVICE PORTFOLIO
TABLE 57. UNIT4.: OVERVIEW
TABLE 58. UNIT4.: STRATEGIC SNAPSHOT
TABLE 59. UNIT4.: BUSINESS OPPORTUNITIES AND OUTLOOK
TABLE 60. UNIT4.: PRODUCT/SERVICE PORTFOLIO
TABLE 61. DELL TECHNOLOGIES: OVERVIEW
TABLE 62. DELL TECHNOLOGIES: STRATEGIC SNAPSHOT
TABLE 63. DELL TECHNOLOGIES: BUSINESS OPPORTUNITIES AND OUTLOOK
TABLE 64. DELL TECHNOLOGIES: PRODUCT/SERVICE PORTFOLIO
TABLE 65. NOKIA.: OVERVIEW
TABLE 66. NOKIA.: STRATEGIC SNAPSHOT
TABLE 67. NOKIA.: BUSINESS OPPORTUNITIES AND OUTLOOK
TABLE 68. NOKIA.: PRODUCT/SERVICE PORTFOLIO
TABLE 69. MICROSOFT CORPORATION: OVERVIEW
TABLE 70. MICROSOFT CORPORATION: STRATEGIC SNAPSHOT
TABLE 71. MICROSOFT CORPORATION: BUSINESS OPPORTUNITIES AND OUTLOOK
TABLE 72. MICROSOFT CORPORATION: PRODUCT/SERVICE PORTFOLIO
TABLE 73. IBM.: OVERVIEW
TABLE 74. IBM.: STRATEGIC SNAPSHOT
TABLE 75. IBM.: BUSINESS OPPORTUNITIES AND OUTLOOK
TABLE 76. IBM.: PRODUCT/SERVICE PORTFOLIO
TABLE 77. FOGHORN SYSTEMS: OVERVIEW
TABLE 78. FOGHORN SYSTEMS: STRATEGIC SNAPSHOT
TABLE 79. FOGHORN SYSTEMS: BUSINESS OPPORTUNITIES AND OUTLOOK
TABLE 80. FOGHORN SYSTEMS: PRODUCT/SERVICE PORTFOLIO
TABLE 81. MACHINESHOP.: OVERVIEW
TABLE 82. MACHINESHOP.: STRATEGIC SNAPSHOT
TABLE 83. MACHINESHOP.: BUSINESS OPPORTUNITIES AND OUTLO
TABLE 84. MACHINESHOP.: PRODUCT/SERVICE PORTFOLIO
Research Framework
Infoholic Research works on a holistic 360° approach in order to deliver high quality, validated and reliable information in our market reports. The Market estimation and forecasting involves following steps:
- Data Collation (Primary & Secondary)
- In-house Estimation (Based on proprietary data bases and Models)
- Market Triangulation
- Forecasting

Market related information is congregated from both primary and secondary sources.
Primary sources
Involved participants from all global stakeholders such as Solution providers, service providers, Industry associations, thought leaders etc. across levels such as CXOs, VPs and managers. Plus, our in-house industry experts having decades of industry experience contribute their consulting and advisory services.
Secondary sources
Include public sources such as regulatory frameworks, government IT spending, government demographic indicators, industry association statistics, and company publications along with paid sources such as Factiva, OneSource, Bloomberg among others.
![]()


