
Digital Signage Market By Components (Hardware, Software, and Services), By Product (Kiosks, Billboards, Menu Boards, Signboards, Others), By Application (Commercial, Infrastructural, Institutional, Others) and Geography – Global Drivers, Restraints, Opportunities, Trends, and Forecast up to 2026
- September, 2020
- Domain: ICT - digital technologies
- Get Free 10% Customization in this Report
Digital signage, also known as dynamic signage, is a form of electronic display that displays visual information using technologies such as LCD, LED, and plasma displays to display content. They are used for advertisements, communicating important information to the masses, etc. It targets a very niche audience, and these displays can be commonly found in retail stores, banks, hotels, corporate offices, etc. Digital Signage plays an integral role in the business as they are very effective for the marketing of products and services and also expanding the customer base through advertising. The digital signage market is expected to be worth around $37.40 Billion by 2026 and grow at a CAGR of around 7.3% during the forecast period.
Research Methodology:
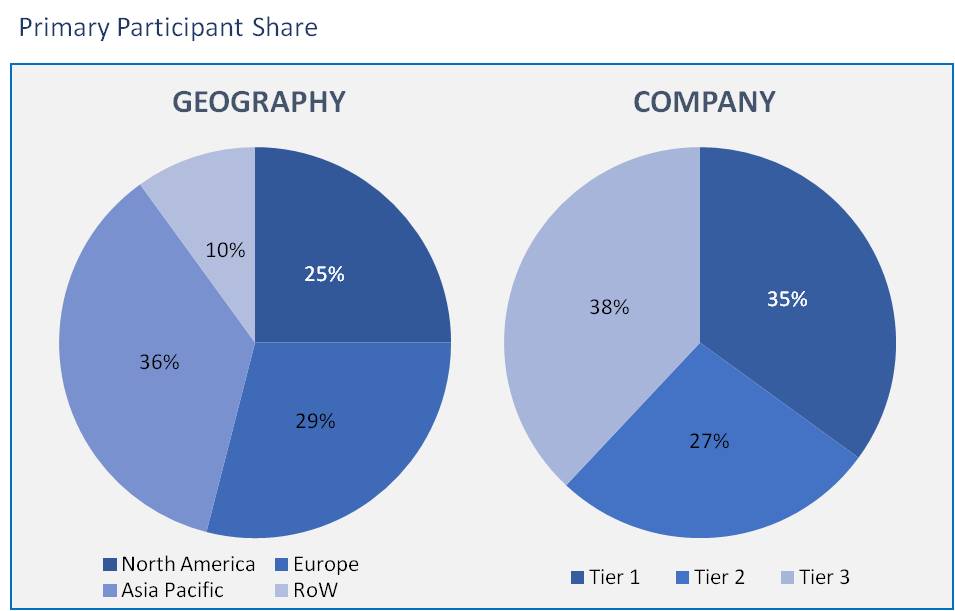
The digital signage market has been analyzed by utilizing the optimum combination of secondary sources and in-house methodology, along with an irreplaceable blend of primary insights. The real-time assessment of the market is an integral part of our market sizing and forecasting methodology. Our industry experts and panel of primary participants have helped in compiling relevant aspects with realistic parametric estimations for a comprehensive study. The participation share of different categories of primary participants is given below:
The world is witnessing rapid digitalization, and there are emerging display technologies that are very likely to boost this market by bringing new opportunities. Moreover, there is an increasing demand for digital advertising, which will favor market growth. The scope of the Digital Signage Market is defined in the market analysis as follows:
Based on Components
-
- Hardware
- Software
- Services
The hardware segment within the digital signage market is estimated to have the largest share in the digital signage market in the forecast period due to tremendous growth in commercial and retail segments and also due to the rapid infrastructural projects coming up in different parts of the world. Also, the advancement in technology is improving the digital experience day by day, which increases the demand for hardware. The software technology segment is expected to grow more in the forecast period due to the content management needs of the enterprises.
Based on Product
-
- Kiosks
- Billboards
- Menu Boards
- Signboards
- Others
The kiosks segment has been holding the largest share in the market and is expected to continue this trend in the forecast period. Kiosks are commonly seen in shopping malls, airports, etc. They are very important in providing information advertising products.
Based on Application
-
- Commercial
- Infrastructural
- Institutional
- Others
The commercial segment is expected to have the largest share of the overall digital signage market. This market growth is attributed to its vast usage in spaces like stadiums, airports, railway stations, hotels, corporate offices, healthcare centers, etc.
Based on Geography
-
- North America
- Europe
- Asia Pacific
- Rest of the World
North America is the region predicted to lead the largest share of the global digital signage market in 2020, accompanied by Europe, Asia Pacific, Latin America, and the Middle East and Africa. However, the Asia-Pacific region is anticipated to witness high growth during the forecast period on account of technological advancements.
However, this industry faces some of the challenges in terms of high investment, huge installation and maintenance costs. Also, in many regions, especially the developing countries, there are issues related to network and connectivity, which slows the growth of this market. Also, the COVID-19 pandemic has had some negative effects on this industry, especially in the manufacturing operations, as these have come to a halt. Furthermore, this year the marketing and advertising budget of companies can go down due to fewer profits, which are expected to impede the growth of this market.
The report also includes an analysis of the major players in the Global Digital Signage market. Some of the key players in the digital signage market are: Samsung Electronics, Omnivex Corporation, Sharp Corporation, Leyard Optoelectronic, E Ink Holdings, NEC Corp, Sony Corporation, BARCO, Panasonic, Exceptional3D and AU Optronics, and LG Electronics.
This report is helpful to understand the key market dynamics.
- The analysis of competitive edge is provided in this report that would help the users to understand the product development, coherent strategies, and framework of the vital players in the market.
- This report also gives an in-depth analysis of market segmentation, market current trends, opportunities, and driving factors of the market.
- Quantitative and Qualitative analysis of the market enables us to understand the complete scenario of the market.
- Executive Summary
- Industry Outlook
- Industry Overview
- Industry Trends
- Market Snapshot
4. Market Snapshot
4.1. Total Addressable Market
4.2. Segment Addressable Market
4.2.1. PEST Analysis
4.2.2. Porter Five Forces
4.3. Related Markets
4.4. Ecosystem
5. Market Outlook
5.1. Overview
5.1.1. Market Evolution
5.2. Market Trends and Impact
5.3. Pricing Analysis
5.4. Market Segmentation
5.5. Market Dynamics
5.5.1. Drivers
5.5.2. Restraints
5.5.3. Opportunities
5.6. DRO - Impact Analysis
6. Components: Market Size & Analysis
6.1. Overview
6.2. Hardware
6.3. Software
6.4. Services
7. Product: Market Size & Analysis
7.1. Overview
7.2. Kiosks
7.3. Billboards
7.4. Menu Boards
7.5. Signboards
7.6. Others
8. Application: Market Size & Analysis
8.1. Overview
8.2. Commercial
8.3. Infrastructural
8.4. Institutional
8.5. Others
9. Geography: Market Size & Analysis
9.1. Overview
9.2. North America
9.3. Europe
9.4. Asia Pacific
9.5. Rest of the World
10. Competitive Landscape
10.1. Competitor Comparison Analysis
10.2. Market Developments
10.2.1. Mergers and Acquisitions, Legal, Awards, Partnerships
10.2.2. Product Launches and execution
11. Vendor Profiles
11.1. Samsung Electronics
11.1.1. Overview
11.1.2. Business Units
11.1.3. Geographic Revenue
11.1.4. Product Offerings
11.1.5. Developments
11.1.6. Business Strategy
11.2. LG Electronics
11.2.1. Overview
11.2.2. Business Units
11.2.3. Geographic Revenue
11.2.4. Product Offerings
11.2.5. Developments
11.2.6. Business Strategy
11.3. Sharp
11.3.1. Overview
11.3.2. Business Units
11.3.3. Geographic Revenue
11.3.4. Product Offerings
11.3.5. Developments
11.3.6. Business Strategy
11.4. Leyard Optoelectronic
11.4.1. Overview
11.4.2. Business Units
11.4.3. Geographic Revenue
11.4.4. Product Offerings
11.4.5. Developments
11.4.6. Business Strategy
11.5. NEC Corp
11.5.1. Overview
11.5.2. Business Units
11.5.3. Geographic Revenue
11.5.4. Product Offerings
11.5.5. Developments
11.5.6. Business Strategy
11.6. Sony
11.6.1. Overview
11.6.2. Business Units
11.6.3. Geographic Revenue
11.6.4. Product Offerings
11.6.5. Developments
11.6.6. Business Strategy
11.7. BARCO
11.7.1. Overview
11.7.2. Business Units
11.7.3. Geographic Revenue
11.7.4. Product Offerings
11.7.5. Developments
11.7.6. Business Strategy
11.8. Panasonic
11.8.1. Overview
11.8.2. Business Units
11.8.3. Geographic Revenue
11.8.4. Product Offerings
11.8.5. Developments
11.8.6. Business Strategy
11.9. Shanghai Goodview Electronics.
11.9.1. Overview
11.9.2. Business Units
11.9.3. Geographic Revenue
11.9.4. Product Offerings
11.9.5. Developments
11.9.6. Business Strategy
11.10. AU Optronics
11.10.1. Overview
11.10.2. Business Units
11.10.3. Geographic Revenue
11.10.4. Product Offerings
11.10.5. Developments
11.10.6. Business Strategy
12. Companies to Watch
12.1. Scala
12.1.1. Overview
12.1.2. Market
12.1.3. Business Strategy
12.2. E Ink Holdings
12.2.1. Overview
12.2.2. Market
12.2.3. Business Strategy
12.3. BenQ Group
12.3.1. Overview
12.3.2. Market
12.3.3. Business Strategy
12.4. Intuiface
12.4.1. Overview
12.4.2. Market
12.4.3. Business Strategy
12.5. DaKTronics
12.5.1. Overview
12.5.2. Market
12.5.3. Business Strategy
12.6. CHRISTIE DIGITAL SYSTEMS
12.6.1. Overview
12.6.2. Market
12.6.3. Business Strategy
12.7. Omnivex Corporation
12.7.1. Overview
12.7.2. Market
12.7.3. Business Strategy
12.8. Deepsky Corporation
12.8.1. Overview
12.8.2. Market
12.8.3. Business Strategy
12.9. Delta Electronics
12.9.1. Overview
12.9.2. Market
12.9.3. Business Strategy
12.10. EXCEPTIONAL 3D
12.10.1. Overview
12.10.2. Market
12.10.3. Business Strategy
13. Analyst Opinion
14. Annexure
14.1. Report Scope
14.2. Market Definitions
14.3. Research Methodology
14.3.1. Data Collation and In-house Estimation
14.3.2. Market Triangulation
14.3.3. Forecasting
15. Report Assumptions
16. Declarations
17. Stakeholders
18. Abbreviations
TABLE 1. GLOBAL DIGITAL SIGNAGEMARKET VALUE, BY COMPONENTS, 2020-2026 (USD MILLION)
TABLE 2. GLOBAL DIGITAL SIGNAGEMARKET VALUE FOR HARDWARE, BY GEOGRAPHY, 2020-2026 (USD MILLION)
TABLE 3. GLOBAL DIGITAL SIGNAGEMARKET VALUE FOR SOFTWARE, BY GEOGRAPHY, 2020-2026 (USD MILLION)
TABLE 4. GLOBAL DIGITAL SIGNAGEMARKET VALUE FOR SERVICES, BY GEOGRAPHY, 2020-2026 (USD MILLION)
TABLE 5. GLOBAL DIGITAL SIGNAGEMARKET VALUE, BY PRODUCT, 2020-2026 (USD MILLION)
TABLE 6. GLOBAL DIGITAL SIGNAGEMARKET VALUE FOR KIOSKS, BY GEOGRAPHY, 2020-2026 (USD MILLION)
TABLE 7. GLOBAL DIGITAL SIGNAGEMARKET VALUE FOR BILLBOARDS, BY GEOGRAPHY, 2020-2026 (USD MILLION)
TABLE 8. GLOBAL DIGITAL SIGNAGEMARKET VALUE FOR MENU BOARDS, BY GEOGRAPHY, 2020-2026 (USD MILLION)
TABLE 9. GLOBAL DIGITAL SIGNAGEMARKET VALUE FOR SIGNBOARDS, BY GEOGRAPHY, 2020-2026 (USD MILLION)
TABLE 10. GLOBAL DIGITAL SIGNAGEMARKET VALUE FOR OTHERS, BY GEOGRAPHY, 2020-2026 (USD MILLION)
TABLE 11. GLOBAL DIGITAL SIGNAGEMARKET VALUE FOR APPLICATION, BY GEOGRAPHY, 2020-2026 (USD MILLION)
TABLE 12. GLOBAL DIGITAL SIGNAGEMARKET VALUE FOR COMMERCIAL, BY GEOGRAPHY, 2020-2026 (USD MILLION)
TABLE 13. GLOBAL DIGITAL SIGNAGEMARKET VALUE FOR INFRASTRUCTURAL, BY GEOGRAPHY, 2020-2026 (USD MILLION)
TABLE 14. GLOBAL DIGITAL SIGNAGEMARKET VALUE FOR INSTITUTIONAL, BY GEOGRAPHY, 2020-2026 (USD MILLION)
TABLE 15. GLOBAL DIGITAL SIGNAGEMARKET VALUE FOR OTHERS, BY GEOGRAPHY, 2020-2026 (USD MILLION)
TABLE 16. GLOBAL DIGITAL SIGNAGE MARKET VALUE, BY REGION, 2020-2026 (USD MILLION)
TABLE 17. NORTH AMERICA DIGITAL SIGNAGE MARKET VALUE, BY COUNTRY, 2020-2026 (USD MILLION)
TABLE 18. NORTH AMERICA DIGITAL SIGNAGE MARKET VALUE, BY COMPONENTS, 2020-2026 (USD MILLION)
TABLE 19. NORTH AMERICA DIGITAL SIGNAGE MARKET VALUE, BY PRODUCT, 2020-2026 (USD MILLION)
TABLE 20. NORTH AMERICA DIGITAL SIGNAGE MARKET VALUE, BY APPLICATION, 2020-2026 (USD MILLION)
TABLE 21. US DIGITAL SIGNAGE MARKET VALUE, BY COMPONENTS, 2020-2026 (USD MILLION)
TABLE 22. US DIGITAL SIGNAGE MARKET VALUE, BY PRODUCTS, 2020-2026 (USD MILLION)
TABLE 23. US DIGITAL SIGNAGE MARKET VALUE, BY APPLICATION, 2020-2026 (USD MILLION)
TABLE 24. CANADA DIGITAL SIGNAGE MARKET VALUE, BY COMPONENTS, 2020-2026 (USD MILLION)
TABLE 25. CANADA DIGITAL SIGNAGE MARKET VALUE, BY PRODUCT, 2020-2026 (USD MILLION)
TABLE 26. CANADA DIGITAL SIGNAGE MARKET VALUE, BY APPLICATION, 2020-2026 (USD MILLION)
TABLE 27. EUROPE DIGITAL SIGNAGE MARKET VALUE, BY COUNTRY, 2020-2026 (USD MILLION)
TABLE 28. EUROPE DIGITAL SIGNAGE MARKET VALUE, BY COMPONENTS, 2020-2026 (USD MILLION)
TABLE 29. EUROPE DIGITAL SIGNAGE MARKET VALUE, BY PRODUCTS, 2020-2026 (USD MILLION)
TABLE 30. EUROPE DIGITAL SIGNAGE MARKET VALUE, BY APPLICATION, 2020-2026 (USD MILLION)
TABLE 31. GERMANY DIGITAL SIGNAGE MARKET VALUE, BY COMPONENTS, 2020-2026 (USD MILLION)
TABLE 32. GERMANY DIGITAL SIGNAGE MARKET VALUE, BY PRODUCT, 2020-2026 (USD MILLION)
TABLE 33. GERMANY DIGITAL SIGNAGE MARKET VALUE, BY APPLICATION, 2020-2026 (USD MILLION)
TABLE 34. UK DIGITAL SIGNAGE MARKET VALUE, BY COMPONETS, 2020-2026 (USD MILLION)
TABLE 35. UK DIGITAL SIGNAGE MARKET VALUE, BY PRODUCT, 2020-2026 (USD MILLION)
TABLE 36. UK DIGITAL SIGNAGE MARKET VALUE, BY APPLICATION, 2020-2026 (USD MILLION)
TABLE 37. FRANCE DIGITAL SIGNAGE MARKET VALUE, BY COMPONETS, 2020-2026 (USD MILLION)
TABLE 38. FRANCE DIGITAL SIGNAGE MARKET VALUE, BY PRODUCT, 2020-2026 (USD MILLION)
TABLE 39. FRANCE DIGITAL SIGNAGE MARKET VALUE, BY APPLICATION, 2020-2026 (USD MILLION)
TABLE 40. ITALY DIGITAL SIGNAGE MARKET VALUE, BY COMPONETS, 2020-2026 (USD MILLION)
TABLE 41. ITALY DIGITAL SIGNAGE MARKET VALUE, BY PRODUCT, 2020-2026 (USD MILLION)
TABLE 42. ITALY DIGITAL SIGNAGE MARKET VALUE, BY APPLICATION, 2020-2026 (USD MILLION)
TABLE 43. ROE DIGITAL SIGNAGE MARKET VALUE, BY COMPONETS, 2020-2026 (USD MILLION)
TABLE 44. ROE DIGITAL SIGNAGE MARKET VALUE, BY PRODUCT, 2020-2026 (USD MILLION)
TABLE 45. ROE DIGITAL SIGNAGE MARKET VALUE, BY APPLICATION, 2020-2026 (USD MILLION)
TABLE 46. ASIA PACIFIC DIGITAL SIGNAGE MARKET VALUE, BY COUNTRY, 2020-2026 (USD MILLION)
TABLE 47. ASIA PACIFIC DIGITAL SIGNAGE MARKET VALUE, BY COMPONETS, 2020-2026 (USD MILLION)
TABLE 48. ASIA PACIFIC DIGITAL SIGNAGE MARKET VALUE, BY PRODUCT, 2020-2026 (USD MILLION)
TABLE 49. ASIA PACIFIC DIGITAL SIGNAGE MARKET VALUE, BY APPLICATION, 2020-2026 (USD MILLION)
TABLE 50. CHINA DIGITAL SIGNAGE MARKET VALUE, BY COMPONETS, 2020-2026 (USD MILLION)
TABLE 51. CHINA PACIFIC DIGITAL SIGNAGE MARKET VALUE, BY PRODUCT, 2020-2026 (USD MILLION)
TABLE 52. CHINA DIGITAL SIGNAGE MARKET VALUE, BY APPLICATION, 2020-2026 (USD MILLION)
TABLE 53. INDIA PACIFIC DIGITAL SIGNAGE MARKET VALUE, BY COMPONETS, 2020-2026 (USD MILLION)
TABLE 54. INDIA PACIFIC DIGITAL SIGNAGE MARKET VALUE, BY PRODUCT, 2020-2026 (USD MILLION)
TABLE 55. INDIA PACIFIC DIGITAL SIGNAGE MARKET VALUE, BY APPLICATION, 2020-2026 (USD MILLION)
TABLE 56. JAPAN PACIFIC DIGITAL SIGNAGE MARKET VALUE, BY COMPONETS, 2020-2026 (USD MILLION)
TABLE 57. JAPAN PACIFIC DIGITAL SIGNAGE MARKET VALUE, BY PRODUCT, 2020-2026 (USD MILLION)
TABLE 58. JAPAN PACIFIC DIGITAL SIGNAGE MARKET VALUE, BY APPLICATION, 2020-2026 (USD MILLION)
TABLE 59. AUSTRALIA PACIFIC DIGITAL SIGNAGE MARKET VALUE, BY COMPONETS, 2020-2026 (USD MILLION)
TABLE 60. AUSTRALIA DIGITAL SIGNAGE MARKET VALUE, BY PRODUCT, 2020-2026 (USD MILLION)
TABLE 61. AUSTRALIA PACIFIC DIGITAL SIGNAGE MARKET VALUE, BY APPLICATION, 2020-2026 (USD MILLION)
TABLE 62. ROW DIGITAL SIGNAGE MARKET VALUE, BY COMPONETS, 2020-2026 (USD MILLION)
TABLE 63. ROW DIGITAL SIGNAGE MARKET VALUE, BY PRODUCT, 2020-2026 (USD MILLION)
TABLE 64. ROW DIGITAL SIGNAGE MARKET VALUE, BY APPLICATION, 2020-2026 (USD MILLION)
TABLE 65. YELLOW MESSENGER.: OVERVIEW
TABLE 66. YELLOW MESSENGER.: STRATEGIC SNAPSHOT
TABLE 67. YELLOW MESSENGER.: BUSINESS OPPORTUNITIES AND OUTLOOK
TABLE 68. YELLOW MESSENGER.: PRODUCT/SERVICE PORTFOLIO
TABLE 69. COGNICOR TECHNOLOGIES: OVERVIEW
TABLE 70. COGNICOR TECHNOLOGIES: STRATEGIC SNAPSHOT
TABLE 71. COGNICOR TECHNOLOGIES: BUSINESS OPPORTUNITIES AND OUTLOOK
TABLE 72. COGNICOR TECHNOLOGIES: PRODUCT/SERVICE PORTFOLIO
TABLE 73. CONVERSICA: OVERVIEW
TABLE 74. CONVERSICA: STRATEGIC SNAPSHOT
TABLE 75. CONVERSICA: BUSINESS OPPORTUNITIES AND OUTLOOK
TABLE 76. CONVERSICA: PRODUCT/SERVICE PORTFOLIO
TABLE 77. GUPSHUP.: OVERVIEW
TABLE 78. GUPSHUP.: STRATEGIC SNAPSHOT
TABLE 79. GUPSHUP.: BUSINESS OPPORTUNITIES AND OUTLOOK
TABLE 80. GUPSHUP.: PRODUCT/SERVICE PORTFOLIO
TABLE 81. KEVIT: OVERVIEW
TABLE 82. KEVIT: STRATEGIC SNAPSHOT
TABLE 83. KEVIT: BUSINESS OPPORTUNITIES AND OUTLOOK
TABLE 84. KEVIT: PRODUCT/SERVICE PORTFOLIO
TABLE 85. YEKALIVA.: OVERVIEW
TABLE 86. YEKALIVA.: STRATEGIC SNAPSHOT
TABLE 87. YEKALIVA.: BUSINESS OPPORTUNITIES AND OUTLOOK
TABLE 88. YEKALIVA.: PRODUCT/SERVICE PORTFOLIO
TABLE 89. CONTUS: OVERVIEW
TABLE 90. CONTUS: STRATEGIC SNAPSHOT
TABLE 91. CONTUS: BUSINESS OPPORTUNITIES AND OUTLOOK
TABLE 92. CONTUS: PRODUCT/SERVICE PORTFOLIO
TABLE 93. SMARTBOTS.AI.: OVERVIEW
TABLE 94. SMARTBOTS.AI.: STRATEGIC SNAPSHOT
TABLE 95. SMARTBOTS.AI.: BUSINESS OPPORTUNITIES AND OUTLOOK
TABLE 96. SMARTBOTS.AI.: PRODUCT/SERVICE PORTFOLIO
TABLE 97. KORE.AI: OVERVIEW
TABLE 98. KORE.AI: STRATEGIC SNAPSHOT
TABLE 99. KORE.AI: BUSINESS OPPORTUNITIES AND OUTLOOK
TABLE 100. KORE.AI: PRODUCT/SERVICE PORTFOLIO
TABLE 101. MACHINESHOP.: OVERVIEW
TABLE 102. MACHINESHOP.: STRATEGIC SNAPSHOT
TABLE 103. MACHINESHOP.: BUSINESS OPPORTUNITIES AND OUTLO
TABLE 104. MACHINESHOP.: PRODUCT/SERVICE PORTFOLIO
Research Framework
Infoholic Research works on a holistic 360° approach in order to deliver high quality, validated and reliable information in our market reports. The Market estimation and forecasting involves following steps:
- Data Collation (Primary & Secondary)
- In-house Estimation (Based on proprietary data bases and Models)
- Market Triangulation
- Forecasting

Market related information is congregated from both primary and secondary sources.
Primary sources
Involved participants from all global stakeholders such as Solution providers, service providers, Industry associations, thought leaders etc. across levels such as CXOs, VPs and managers. Plus, our in-house industry experts having decades of industry experience contribute their consulting and advisory services.
Secondary sources
Include public sources such as regulatory frameworks, government IT spending, government demographic indicators, industry association statistics, and company publications along with paid sources such as Factiva, OneSource, Bloomberg among others.
![]()


