
Digital Printing Packaging Market based on Technology (Inkjet Technology and Electrophotography), Package Type (Labels, Corrugated Packaging, Folding Packaging, and Flexible Packaging), End-User (Food & Beverage, Electronics, Healthcare, Personal Care and Others), and Geography – Global Forecast up to 2026
- April, 2021
- Domain: Chemicals, Materials & Food - Paints & Coatings/Inks & Pigments
- Get Free 10% Customization in this Report
The packaging industry will witness a revolt due to the growing applications of digital printing. Digital printing for packaging is introduced to attract consumers as this method contains the printing of digital images or text on product packaging. The Digital printing packaging market is mainly determined by the growing demand from the food & beverages and personal care industries. Digital printing is more time and cost-efficient than other techniques of printing. Digital printing supports cover entire information while providing better quality prints than other techniques. These factors raise the popularity of digital printing packaging, which ultimately fuels the development of this market. But fluctuations in raw material prices may hamper the growth of the digital printing packaging market. The Digital Printing Packaging Market is expected to grow at the rate of 14.73% CAGR by 2026.
Research Methodology:
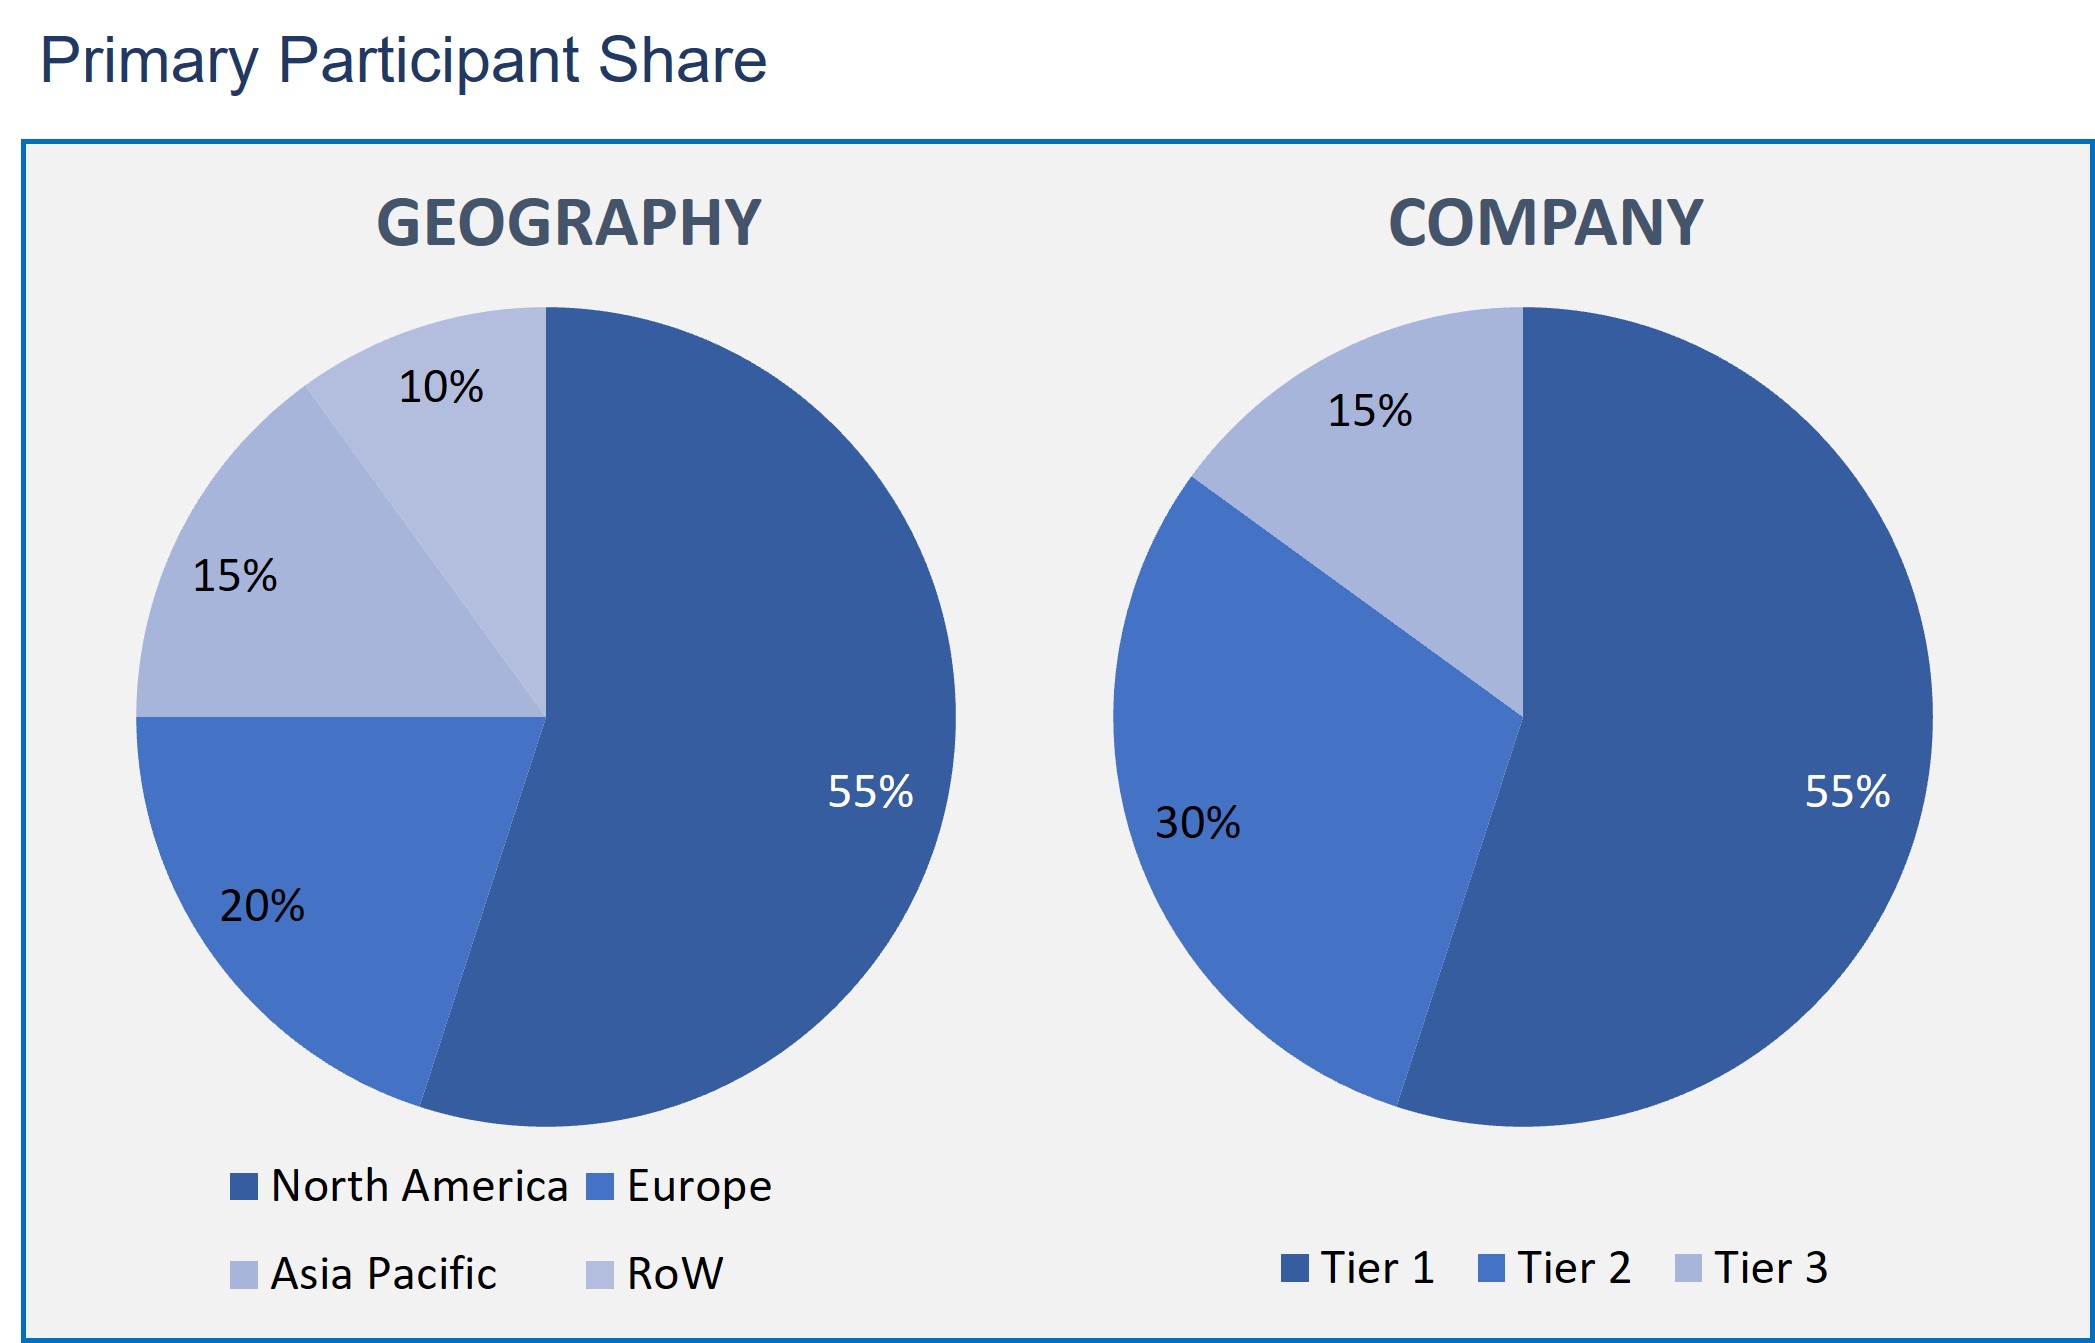
The Digital Printing Packaging Market has been analyzed by utilizing the optimum combination of secondary sources and in-house methodology and a unique balance of primary insights. The real-time valuation of the market is an integral part of our forecasting and market sizing methodology. Industry experts and our primary participants have helped to compile related aspects with accurate parametric estimations for a complete study. The primary participants share is given below:
Digital Printing Packaging Market By Technology
- Inkjet Technology
- Electrophotography
Digital Printing Packaging Market By Package Type
- Labels
- Corrugated Packaging
- Folding Packaging
- Flexible Packaging
Digital Printing Packaging Market By End-User
- Food & Beverage
- Electronics
- Healthcare
- Personal Care
- Others
Digital Printing Packaging Market By Geography
- North America
- Europe
- Asia Pacific
- Rest of the World
Based on packaging type, Labels accounted for the largest market share and are expected to grow at a significant rate during the forecasted year. This development is owing to its application in several packaging variable types. Labels are mostly used packaging type as they display brand identification symbols, product information, and transportation details during shipping.
In terms of End-users, the food & beverage sector is expected to rise at a higher rate owing to the high demand for food packaging and the increasing trend of variable data printing on food packages to communicate the composition, shelf-life, and nutritional value of the product. The high degree of customization required in the food & beverage industry is suitably supported by the features offered by digital printing techniques, allowing unique sync among two creating big market segments.
The printing technology is accounted for the largest market share and is expected to grow at a moderate CAGR during the forecasted period. This development can be attributed to its capacity to print images that are superior in quality and withstand various climatic conditions. In 2015, the format segment's variable data printing sector constituted a larger share in the digital printing packaging market. This is expected to rise at a higher rate during the forecast period due to its ability to produce customized printing without decelerating down the process, thus significantly saving printing and labor costs.
The Asia-Pacific region accounted for a higher share in the total digital printing packaging market, in terms of value, due to manufacturers’ focus on emerging low-cost packaging printing options. But as the digital printing packaging market in established countries is getting matured, India and China's markets are expected to rise at higher rates from 2016 to 2021. The region is also expected to register the highest development during the estimated period due to the region experiencing growing e-retail sales and growing convenience packaging in the food industry.
This report includes the profiles of companies that are leading the Digital Printing Packaging market: HP Inc, Xerox Corporation, Kodak Co., Quad/Graphics Inc., Mondi plc, ie. Du Pont De Nemours and Company, and
- This report offers an overall analysis of the Digital Printing Packaging Market growth drivers, restraints, opportunities, and other related challenges.
- This report depicts the market developments such as new product launches, mergers and acquisitions, diversification, and joint ventures of the market players.
- This report also describes all potential segments and sub-segments present in the market to help the companies in strategic business planning.
- This report also gives the regional analysis of the Digital Printing Packaging market in terms of market penetration across the world.
- Executive Summary
- Industry Outlook
- Industry Overview
- Industry Trends
- Market Snapshot
- Market Definition
- Market Outlook
- PESTLE Analysis
- Porter Five Forces
- Related Markets
- Market characteristics
- Market Overview
- Market Segmentation
- Market Dynamics
- Drivers
- Restraints
- Opportunities
- DRO - Impact Analysis
- Packaging Type: Market Size & Analysis
- Overview
- Flexible packaging
- Labels
- Corrugated
- Folding cartons
- Others
- End-User: Market Size & Analysis
- Overview
- Food & Beverage
- Electronics
- Healthcare
- Personal Care
- Others
- Printing Technology: Market Size & Analysis
- Overview
- Inkjet printing
- Electrophotography
- Others
- Geography: Market Size & Analysis
- Overview
- North America
- Europe
- Asia Pacific
- Rest of the World
- Competitive Landscape
- Competitor Comparison Analysis
- Market Developments
- Mergers and Acquisitions, Legal, Awards, Partnerships
- Product Launches and execution
- Vendor Profiles
- HP Inc.
- Overview
- Financial Overview
- Product Offerings
- Developments
- Business Strategy
- Xerox Corporation
- Overview
- Financial Overview
- Product Offerings
- Developments
- Business Strategy
- Mondi PLC
- Overview
- Financial Overview
- Product Offerings
- Developments
- Business Strategy
- E.I. Du Pont Nemours and Company
- Overview
- Financial Overview
- Product Offerings
- Developments
- Business Strategy
- Quad/Graphics, Inc.
- Overview
- Financial Overview
- Product Offerings
- Developments
- Business Strategy
- Eastman Kodak Co.
- Overview
- Financial Overview
- Product Offerings
- Developments
- Business Strategy
- Xeikon N.V.
- Overview
- Financial Overview
- Product Offerings
- Developments
- Business Strategy
- Quantum Print and Packaging Ltd.
- Overview
- Financial Overview
- Product Offerings
- Developments
- Business Strategy
- WS Packaging Group, Inc.
- Overview
- Financial Overview
- Product Offerings
- Developments
- Business Strategy
- Traco Manufacturing, Inc.
- Overview
- Financial Overview
- Product Offerings
- Developments
- Business Strategy
- HP Inc.
- Companies to Watch
- Labels in Motion
- Overview
- Market
- Business Strategy
- Reel Appeal
- Overview
- Market
- Business Strategy
- Labels in Motion
- Analyst Opinion
- Annexure
- Report Scope
- Market Definitions
- Research Methodology
- Data Collation and In-house Estimation
- Market Triangulation
- Forecasting
- Report Assumptions
- Declarations
- Stakeholders
- Abbreviations
TABLE 1. GLOBAL DIGITAL PRINTING PACKAGING MARKET VALUE, BY PACKAGING TYPE, 2020-2026 (USD BILLION)
TABLE 2. GLOBAL DIGITAL PRINTING PACKAGING MARKET VALUE FOR FLEXIBLE PACKAGING, BY GEOGRAPHY, 2020-2026 (USD BILLION)
TABLE 3. GLOBAL DIGITAL PRINTING PACKAGING MARKET VALUE FOR LABELS, BY GEOGRAPHY, 2020-2026 (USD BILLION)
TABLE 4. GLOBAL DIGITAL PRINTING PACKAGING MARKET VALUE FOR CORRUGATED, BY GEOGRAPHY, 2020-2026 (USD BILLION)
TABLE 5. GLOBAL DIGITAL PRINTING PACKAGING MARKET VALUE FOR FOLDING CARTONS, BY GEOGRAPHY, 2020-2026 (USD BILLION)
TABLE 6. GLOBAL DIGITAL PRINTING PACKAGING MARKET VALUE FOR OTHERS, BY GEOGRAPHY, 2020-2026 (USD BILLION)
TABLE 7. GLOBAL DIGITAL PRINTING PACKAGING MARKET VALUE, BY END USER, 2020-2026 (USD BILLION)
TABLE 8. GLOBAL DIGITAL PRINTING PACKAGING MARKET VALUE FOR FOOD & BEVERAGE, BY GEOGRAPHY, 2020-2026 (USD BILLION)
TABLE 9. GLOBAL DIGITAL PRINTING PACKAGING MARKET VALUE FOR ELECTRONICS, BY GEOGRAPHY, 2020-2026 (USD BILLION)
TABLE 10. GLOBAL DIGITAL PRINTING PACKAGING MARKET VALUE FOR HEALTHCARE, BY GEOGRAPHY, 2020-2026 (USD BILLION)
TABLE 11. GLOBAL DIGITAL PRINTING PACKAGING MARKET VALUE FOR PERSONAL CARE, BY GEOGRAPHY, 2020-2026 (USD BILLION)
TABLE 12. GLOBAL DIGITAL PRINTING PACKAGING MARKET VALUE, BY PRINTING TECHNOLOGY, 2020-2026 (USD BILLION)
TABLE 13. GLOBAL DIGITAL PRINTING PACKAGING MARKET VALUE FOR INKJET PRINTING, BY GEOGRAPHY, 2020-2026 (USD BILLION)
TABLE 14. GLOBAL CONTINUOUS MANUFACTURING MARKET VALUE FOR ELECTROPHOTOGRAPHY, BY GEOGRAPHY, 2020-2026 (USD BILLION)
TABLE 15. NORTH AMERICA DIGITAL PRINTING PACKAGING MARKET VALUE, BY COUNTRY, 2020-2026 (USD BILLION)
TABLE 16. NORTH AMERICA DIGITAL PRINTING PACKAGING MARKET VALUE, BY PACKAGING TYPE, 2020-2026 (USD BILLION)
TABLE 17. NORTH AMERICA DIGITAL PRINTING PACKAGING MARKET VALUE, BY END-USER, 2020-2026 (USD BILLION)
TABLE 18. NORTH AMERICA DIGITAL PRINTING PACKAGING MARKET VALUE, BY PRINTING TECHNOLOGY, 2020-2026 (USD BILLION)
TABLE 19. U.S DIGITAL PRINTING PACKAGING MARKET VALUE, BY PACKAGING TYPE, 2020-2026 (USD BILLION)
TABLE 20. U.S DIGITAL PRINTING PACKAGING MARKET VALUE, BY END-USER, 2020-2026 (USD BILLION)
TABLE 21. U.S DIGITAL PRINTING PACKAGING MARKET VALUE, BY PRINTING TECHNOLOGY, 2020-2026 (USD BILLION)
TABLE 22. CANADA DIGITAL PRINTING PACKAGING MARKET VALUE, BY PACKAGING TYPE, 2020-2026 (USD BILLION)
TABLE 23. CANADA DIGITAL PRINTING PACKAGING MARKET VALUE, BY END-USER, 2020-2026 (USD BILLION)
TABLE 24. CANADA DIGITAL PRINTING PACKAGING MARKET VALUE, BY PRINTING TECHNOLOGY, 2020-2026 (USD BILLION)
TABLE 25. EUROPE DIGITAL PRINTING PACKAGING MARKET VALUE, BY COUNTRY, 2020-2026 (USD BILLION)
TABLE 26. EUROPE DIGITAL PRINTING PACKAGING MARKET VALUE, BY PACKAGING TYPE, 2020-2026 (USD BILLION)
TABLE 27. EUROPE DIGITAL PRINTING PACKAGING MARKET VALUE, END-USER, 2020-2026 (USD BILLION)
TABLE 28. EUROPE DIGITAL PRINTING PACKAGING MARKET VALUE, BY PRINTING TECHNOLOGY, 2020-2026 (USD BILLION)
TABLE 29. GERMANY DIGITAL PRINTING PACKAGING MARKET VALUE, BY PACKAGING TYPE, 2020-2026 (USD BILLION)
TABLE 30. GERMANY DIGITAL PRINTING PACKAGING MARKET VALUE, BY END-USER, 2020-2026 (USD BILLION)
TABLE 31. GERMANY DIGITAL PRINTING PACKAGING MARKET VALUE, BY PRINTING TECHNOLOGY, 2020-2026 (USD BILLION)
TABLE 32. U.K DIGITAL PRINTING PACKAGING MARKET VALUE, BY PACKAGING TYPE, 2020-2026 (USD BILLION)
TABLE 33. U.K DIGITAL PRINTING PACKAGING MARKET VALUE, BY END-USER, 2020-2026 (USD BILLION)
TABLE 34. U.K DIGITAL PRINTING PACKAGING MARKET VALUE, BY PRINTING TECHNOLOGY, 2020-2026 (USD BILLION)
TABLE 35. FRANCE DIGITAL PRINTING PACKAGING MARKET VALUE, BY PACKAGING TYPE, 2020-2026 (USD BILLION)
TABLE 36. FRANCE DIGITAL PRINTING PACKAGING MARKET VALUE, BY END-USER, 2020-2026 (USD BILLION)
TABLE 37. FRANCE DIGITAL PRINTING PACKAGING MARKET VALUE, BY PRINTING TECHNOLOGY, 2020-2026 (USD BILLION)
TABLE 38. ITALY DIGITAL PRINTING PACKAGING MARKET VALUE, BY PACKAGING TYPE, 2020-2026 (USD BILLION)
TABLE 39. ITALY DIGITAL PRINTING PACKAGING MARKET VALUE, BY END-USER, 2020-2026 (USD BILLION)
TABLE 40. ITALY DIGITAL PRINTING PACKAGING MARKET VALUE, BY PRINTING TECHNOLOGY, 2020-2026 (USD BILLION)
TABLE 41. SPAIN DIGITAL PRINTING PACKAGING MARKET VALUE, BY PACKAGING TYPE, 2020-2026 (USD BILLION)
TABLE 42. SPAIN DIGITAL PRINTING PACKAGING MARKET VALUE, BY END-USER, 2020-2026 (USD BILLION)
TABLE 43. SPAIN DIGITAL PRINTING PACKAGING MARKET VALUE, BY PRINTING TECHNOLOGY, 2020-2026 (USD BILLION)
TABLE 44. ROE DIGITAL PRINTING PACKAGING MARKET VALUE, BY PACKAGING TYPE, 2020-2026 (USD BILLION)
TABLE 45. ROE DIGITAL PRINTING PACKAGING MARKET VALUE, BY END-USER, 2020-2026 (USD BILLION)
TABLE 46. ROE DIGITAL PRINTING PACKAGING MARKET VALUE, BY PRINTING TECHNOLOGY, 2020-2026 (USD BILLION)
TABLE 47. ASIA PACIFIC DIGITAL PRINTING PACKAGING MARKET VALUE, BY COUNTRY, 2020-2026 (USD BILLION)
TABLE 48. ASIA PACIFIC DIGITAL PRINTING PACKAGING MARKET VALUE, BY PACKAGING TYPE, 2020-2026 (USD BILLION)
TABLE 49. ASIA PACIFIC DIGITAL PRINTING PACKAGING MARKET VALUE, BY END-USER, 2020-2026 (USD BILLION)
TABLE 50. ASIA PACIFIC DIGITAL PRINTING PACKAGING MARKET VALUE, BY PRINTING TECHNOLOGY, 2020-2026 (USD BILLION)
TABLE 51. CHINA DIGITAL PRINTING PACKAGING MARKET VALUE, BY PACKAGING TYPE, 2020-2026 (USD BILLION)
TABLE 52. CHINA DIGITAL PRINTING PACKAGING MARKET VALUE, BY END-USER, 2020-2026 (USD BILLION)
TABLE 53. CHINA DIGITAL PRINTING PACKAGING MARKET VALUE, BY PRINTING TECHNOLOGY, 2020-2026 (USD BILLION)
TABLE 54. INDIA DIGITAL PRINTING PACKAGING MARKET VALUE, BY PACKAGING TYPE, 2020-2026 (USD BILLION)
TABLE 55. INDIA DIGITAL PRINTING PACKAGING MARKET VALUE, BY END-USER, 2020-2026 (USD BILLION)
TABLE 56. INDIA DIGITAL PRINTING PACKAGING MARKET VALUE, BY PRINTING TECHNOLOGY, 2020-2026 (USD BILLION)
TABLE 57. JAPAN DIGITAL PRINTING PACKAGING MARKET VALUE, BY PACKAGING TYPE, 2020-2026 (USD BILLION)
TABLE 58. JAPAN DIGITAL PRINTING PACKAGING MARKET VALUE, BY END-USER, 2020-2026 (USD BILLION)
TABLE 59. JAPAN DIGITAL PRINTING PACKAGING MARKET VALUE, BY PRINTING TECHNOLOGY, 2020-2026 (USD BILLION)
TABLE 60. REST OF APAC DIGITAL PRINTING PACKAGING MARKET VALUE, BY PACKAGING TYPE, 2020-2026 (USD BILLION)
TABLE 61. REST OF APAC DIGITAL PRINTING PACKAGING MARKET VALUE, BY END-USER, 2020-2026 (USD BILLION)
TABLE 62. REST OF ASIA PACIFIC DIGITAL PRINTING PACKAGING MARKET VALUE, BY PRINTING TECHNOLOGY, 2020-2026 (USD BILLION)
TABLE 63. REST OF WORLD DIGITAL PRINTING PACKAGING MARKET VALUE, BY PACKAGING TYPE, 2020-2026 (USD BILLION)
TABLE 64. REST OF WORLD DIGITAL PRINTING PACKAGING MARKET VALUE, BY END-USER, 2020-2026 (USD BILLION)
TABLE 65. REST OF WORLD DIGITAL PRINTING PACKAGING MARKET VALUE, BY PRINTING TECHNOLOGY, 2020-2026 (USD BILLION)
TABLE 66. HP INC.: FINANCIALS
TABLE 67. HP INC.: PRODUCTS & SERVICES
TABLE 68. HP INC.: RECENT DEVELOPMENTS
TABLE 69. E.I. DU PONT NEMOURS AND COMPANY: FINANCIALS
TABLE 70. E.I. DU PONT NEMOURS AND COMPANY: PRODUCTS & SERVICES
TABLE 71. E.I. DU PONT NEMOURS AND COMPANY: RECENT DEVELOPMENTS
TABLE 72. XEROX CORPORATION: FINANCIALS
TABLE 73. XEROX CORPORATION: PRODUCTS & SERVICES
TABLE 74. XEROX CORPORATION: RECENT DEVELOPMENTS
TABLE 75. MONDI PLC: FINANCIALS
TABLE 76. MONDI PLC: PRODUCTS & SERVICES
TABLE 77. MONDI PLC: RECENT DEVELOPMENTS
TABLE 78. QUAD/GRAPHICS, INC.: FINANCIALS
TABLE 79. QUAD/GRAPHICS, INC.: PRODUCTS & SERVICES
TABLE 80. QUAD/GRAPHICS, INC.: RECENT DEVELOPMENTS
TABLE 81. EASTMAN KODAK CO.: FINANCIALS
TABLE 82. EASTMAN KODAK CO.: PRODUCTS & SERVICES
TABLE 83. EASTMAN KODAK CO.: RECENT DEVELOPMENTS
TABLE 84. XEIKON N.V.: FINANCIALS
TABLE 85. XEIKON N.V.: PRODUCTS & SERVICES
TABLE 86. XEIKON N.V.: RECENT DEVELOPMENTS
TABLE 87. QUANTUM PRINT AND PACKAGING LTD.: FINANCIALS
TABLE 88. QUANTUM PRINT AND PACKAGING LTD.: PRODUCTS & SERVICES
TABLE 89. QUANTUM PRINT AND PACKAGING LTD.: RECENT DEVELOPMENTS
TABLE 90. WS PACKAGING GROUP, INC.: FINANCIALS
TABLE 91. WS PACKAGING GROUP, INC.: PRODUCTS & SERVICES
TABLE 92. WS PACKAGING GROUP, INC.: RECENT DEVELOPMENTS
TABLE 93. TRACO MANUFACTURING, INC.: FINANCIALS
TABLE 94. TRACO MANUFACTURING, INC.: PRODUCTS & SERVICES
TABLE 95. TRACO MANUFACTURING, INC.: RECENT DEVELOPMENTS
TABLE 96. LABELS IN MOTION: PRODUCTS & SERVICES
TABLE 97. REEL APPEAL: PRODUCTS & SERVICES
Research Framework
Infoholic Research works on a holistic 360° approach in order to deliver high quality, validated and reliable information in our market reports. The Market estimation and forecasting involves following steps:
- Data Collation (Primary & Secondary)
- In-house Estimation (Based on proprietary data bases and Models)
- Market Triangulation
- Forecasting

Market related information is congregated from both primary and secondary sources.
Primary sources
Involved participants from all global stakeholders such as Solution providers, service providers, Industry associations, thought leaders etc. across levels such as CXOs, VPs and managers. Plus, our in-house industry experts having decades of industry experience contribute their consulting and advisory services.
Secondary sources
Include public sources such as regulatory frameworks, government IT spending, government demographic indicators, industry association statistics, and company publications along with paid sources such as Factiva, OneSource, Bloomberg among others.
![]()


