
Dietary Fibers Market by Product (Soluble Dietary Fibers and Insoluble Dietary Fibers), Source (Cereals & grains, Fruits & vegetables and Others (Nuts & seeds, Legumes)), Application (Functional Food and Beverages, Pharmaceuticals, Feed, and Other applications) and Geography – Global Forecast up to 2026
- March, 2021
- Domain: Chemicals, Materials & Food - Agro, Pharma, Food & Personal Care
- Get Free 10% Customization in this Report
Dietary fiber or roughage is that part of plant-based food that human digestive enzymes cannot fully break down. It has majorly two components of dietary fiber, including non-starch polysaccharides and other plant components, which include resistant starch, cellulose, beta-glucans, resistant dextrins, lignins, chitins, pectins, inulin, and oligosaccharides. The market of dietary fibers is driven by the factors such as increasing demand for dietary fiber supplement products, which is attributed to the increasing consciousness about healthy diet consumption leading to a healthy lifestyle. Also, the growing incidence of cancer and diabetes has resulted in increasing demand for dietary fiber products. But somehow, the negative effects of dietary fiber over intake as well as the various pharmaceutical regulations are limiting the growth in the market. The market for Dietary Fibers is expected to grow at the rate of 12.6% CAGR by 2026.
Research Methodology:
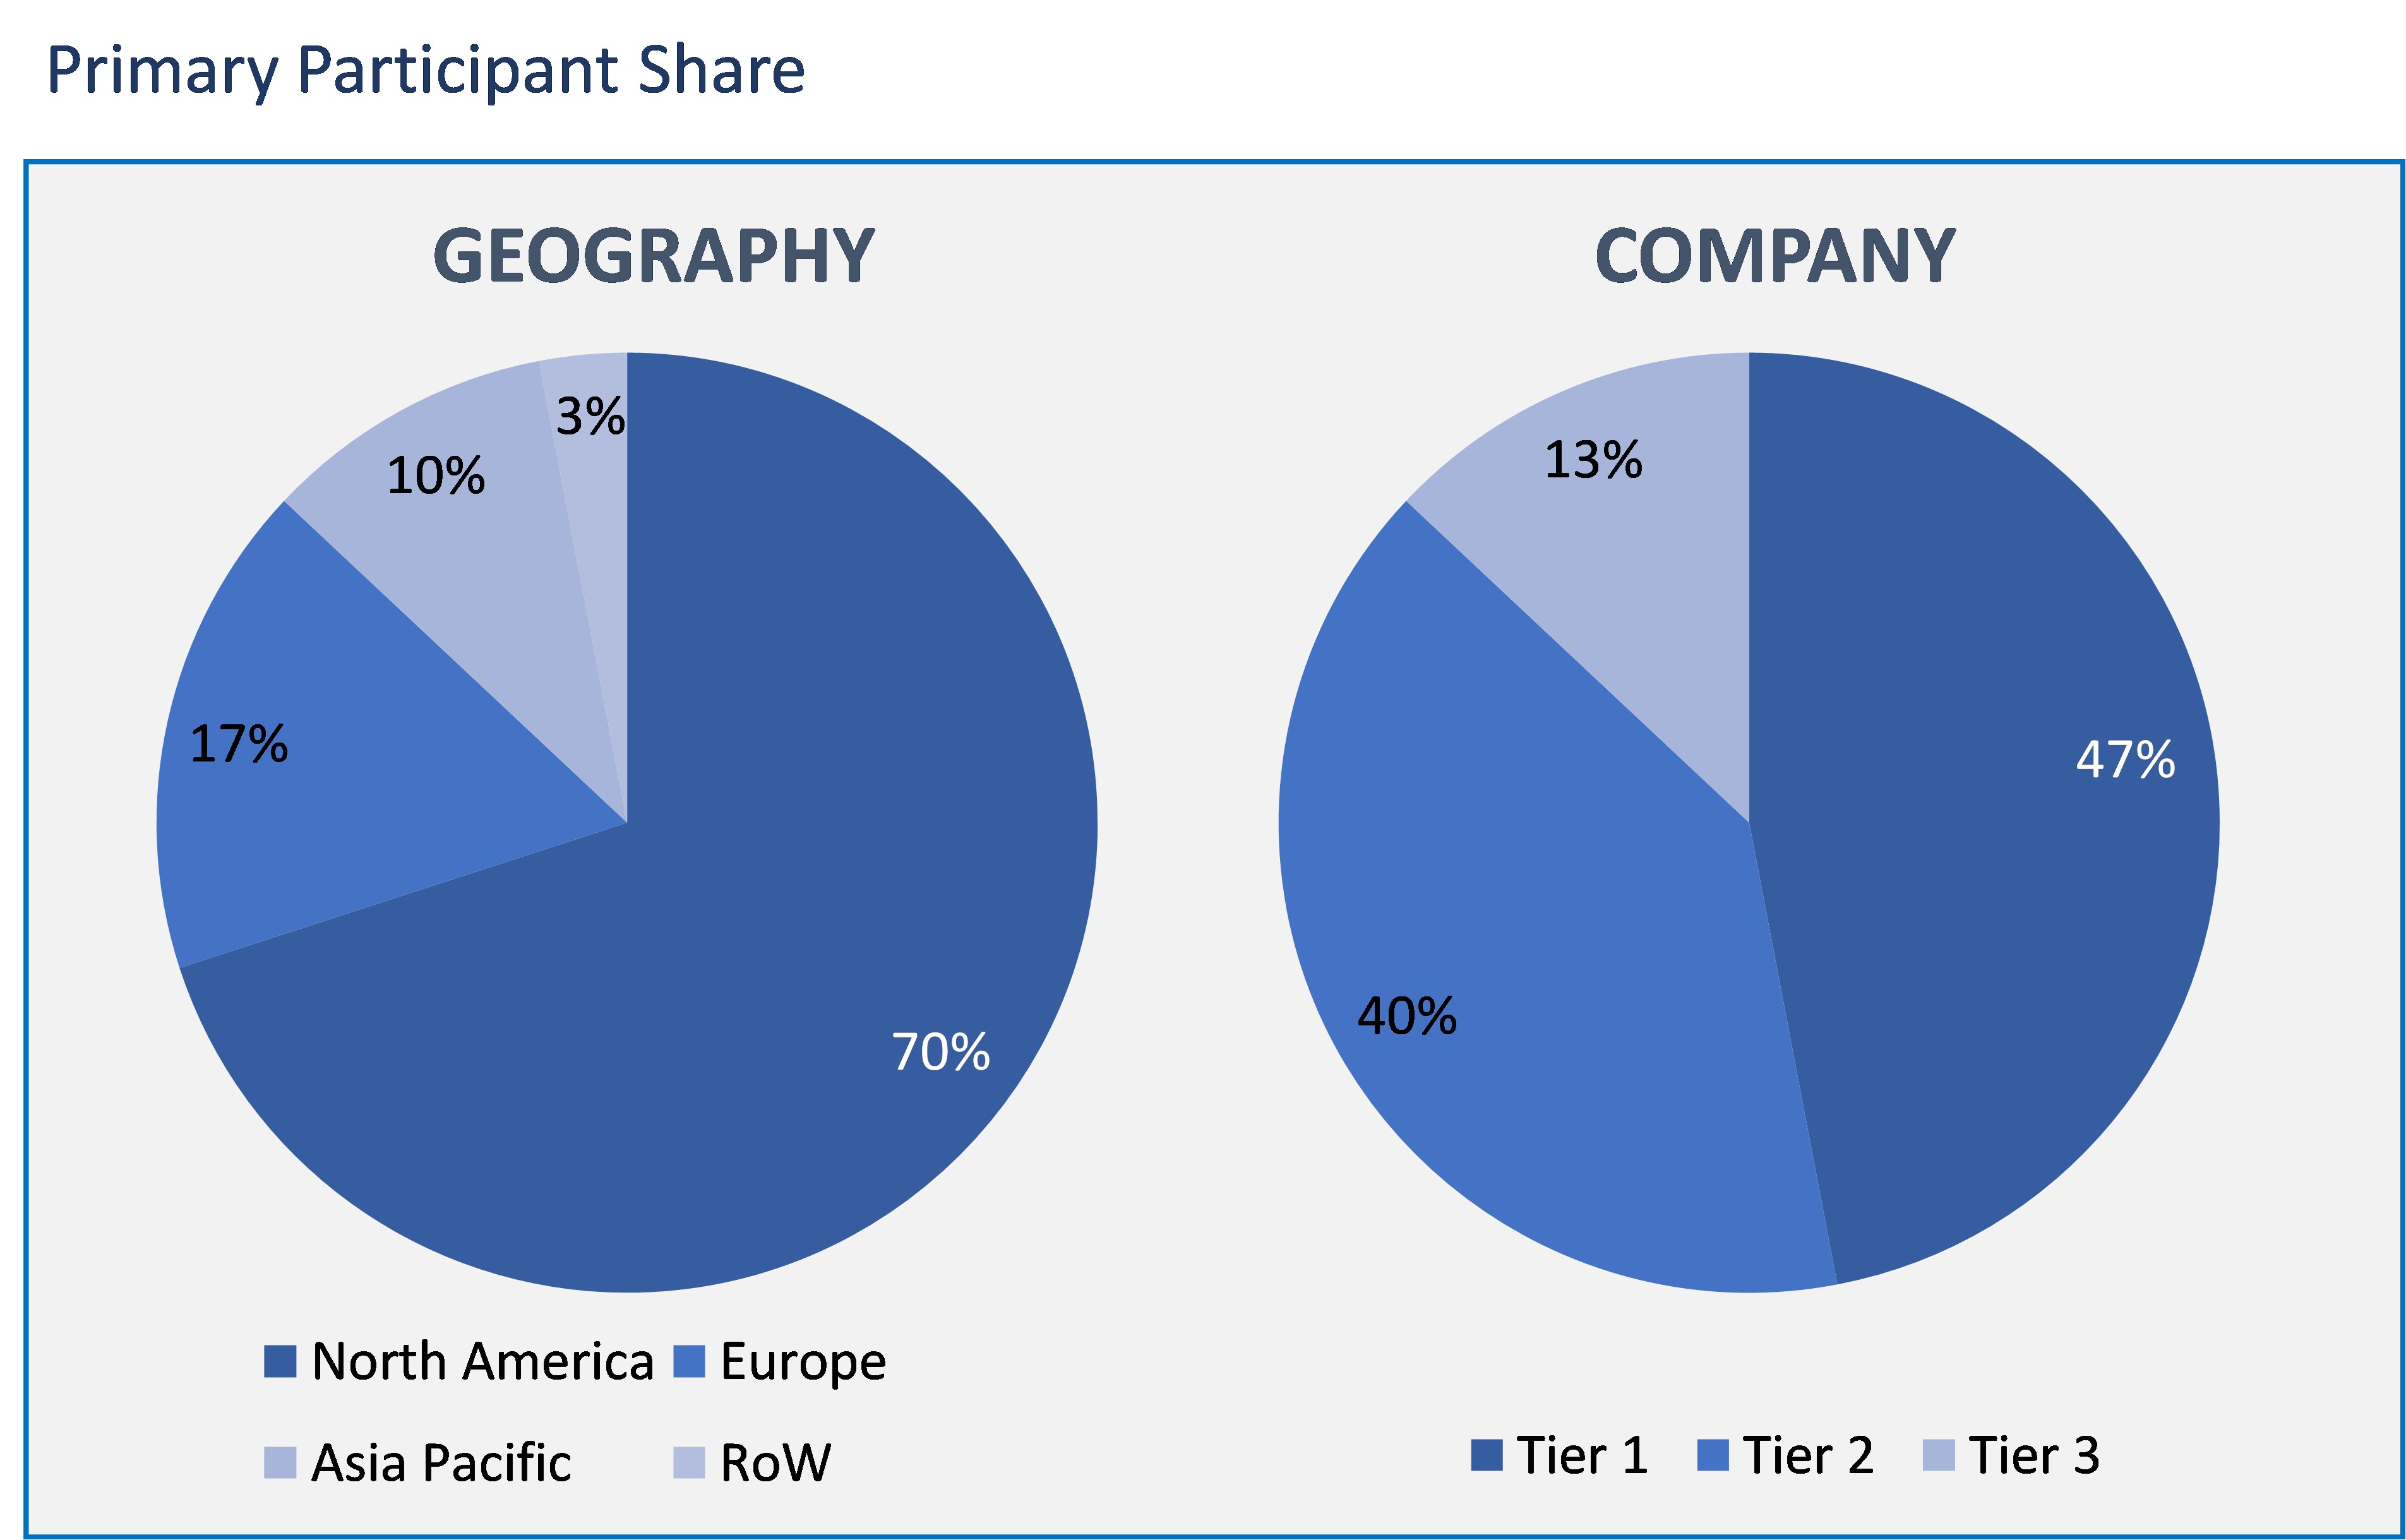
The dietary fiber market has been analyzed by utilizing the optimum combination of secondary sources and in-house methodology and an irreplaceable blend of primary insights. The real-time assessment of the market is an integral part of our market sizing and forecasting methodology. Our industry experts and panel of primary participants have helped in compiling relevant aspects with realistic parametric estimations for a comprehensive study. The participation share of different categories of primary participants is given below:
By Product
- Soluble Dietary Fibers
- Inulin
- Pectin
- Polydextrose
- Beta-Glucan
- Fructooligosaccharides (FOS)
- Galactooligosaccharides (GOS)
- Corn Fiber
- Others (Dextrin, gum fibers)
- Insoluble Dietary Fibers
- Cellulose
- Hemicellulose
- Chitin & Chitosan
- Lignin
- Fiber/bran
- Resistant starch
- Others
By Source
- Cereals & grains
- Fruits & vegetables
- Others (Nuts & seeds, Legumes)
By Application
- Functional Food and Beverages
- Pharmaceuticals
- Feed
- Other applications
By Geography
- North America
- Europe
- Asia Pacific
- Rest of the World
In the market by product, the soluble segment is holding the maximum market share. Soluble dietary fibers are mostly used in the food and beverages in the flours, cookies, bread, supplements, smoothies, and other beverages. There is also increasing demand for food with dietary benefits. Soluble dietary fibers benefit from several industrial applications due to their water retention and the minimum reactivity to gastrointestinal enzymes.
As per the source, the cereals and grains segment is leading the dietary fibers market. Consumption of dietary fibers minimizes the possibility of cardiovascular diseases, which include stroke and coronary heart disease. Moreover, fibers present in beans, flaxseeds, oats, and oat bran help minimize the low-density lipoprotein and control the total blood cholesterol levels, which are fueling the dietary demand fibers.
In terms of application, dietary fibers are most commonly used in functional food and beverages. Since consumers are more dependent on the health benefits of dietary fibers through food and drinks, this could be the key factor to boost the application of dietary fibers in food and beverages.
In the regional market of dietary fibers, North America is considered to acquire the major share. This is due to the increasing advancements in technology that have resulted in the high availability of dietary fiber products in this region's wide range of applications. Additionally, global liberalization is another factor contributing to the major share of this segment.
Globally, increasing awareness in consumers regarding consumption of a healthy diet is a key factor influencing the global dietary fibers market, leading to an immense demand for dietary fiber-based products. Consumers have understood the benefits of minimizing the diseases such as hypertension, cardiovascular diseases, disorders, and obesity. Additionally, the arrival of functional food in dietary patterns because of inadequacy in organic fruits and vegetables will positively impact the global industry demand.
This report depicts the list of key players of the dietary fibers market-The Green Labs LLC, RETTENMAIER & SÖHNE GmbH, Roquette Frères, Ingredion Incorporated, Beneo, ADM, DuPont, Lonza, Kerry Group plc, Cargill, Emsland, Nexira, Tate & Lyle, NutriPea Ltd, Farbest Brands, R & S Blumos and PURIS.
As a result, the increasing diseases in the present scenario have given a wider scope for dietary food. Due to the increasing diseases, there is an inclination towards the dietary fibers owing to increasing health-consciousness to avoid the incidence of health issues beforehand and the wider benefits of the dietary fibers products
- This report gives analysis based on quantitative of the present trends, evaluations, segmentation, and dynamics of the dietary fibers market, which is also projected to help in identifying the forthcoming market opportunities.
- This report depicts the key countries in each region, which are mapped as per the individual market revenue, and also key market players are listed.
- This report gives a comprehensive analysis of region- and country-wise market conditions.
- This report estimates the competitive outlook and the value chain analysis to understand the competition across geographies.
- Executive Summary
- Industry Outlook
- Industry Overview
- Industry Trends
- Market Snapshot
- Market Definition
- Market Outlook
- Porter Five Forces
- Related Markets
- Market characteristics
- Market Overview
- Market Segmentation
- Market Dynamics
- Drivers
- Restraints
- Opportunities
- DRO - Impact Analysis
- Product: Market Size & Analysis
- Soluble Dietary Fibers
- Inulin
- Pectin
- Polydextrose
- Beta-Glucan
- Fructooligosaccharides (FOS)
- Galactooligosaccharides (GOS)
- Corn Fiber
- Others (Dextrin, gum fibers)
- Insoluble Dietary Fibers
- Cellulose
- Hemicellulose
- Chitin & Chitosan
- Lignin
- Fiber/bran
- Resistant starch
- Others
- Soluble Dietary Fibers
- Source: Market Size & Analysis
- Overview
- Cereals & grains
- Fruits & vegetables
- Others (Nuts & seeds, Legumes)
- Application: Market Size & Analysis
- Overview
- Functional Food and Beverages
- Pharmaceuticals
- Feed
- Other applications
- Geography: Market Size & Analysis
- Overview
- North America
- Europe
- Asia Pacific
- Rest of the World
- Competitive Landscape
- Competitor Comparison Analysis
- Market Developments
- Mergers and Acquisitions, Legal, Awards, Partnerships
- Product Launches and execution
- Vendor Profiles
- The Green Labs LLC
- Overview
- Financial Overview
- Product Offerings
- Developments
- Business Strategy
- RETTENMAIER & SÖHNE GmbH
- Overview
- Financial Overview
- Product Offerings
- Developments
- Business Strategy
- Roquette Frères
- Overview
- Financial Overview
- Product Offerings
- Developments
- Business Strategy
- Ingredion Incorporated
- Overview
- Financial Overview
- Product Offerings
- Developments
- Business Strategy
- Beneo
- Overview
- Financial Overview
- Product Offerings
- Developments
- Business Strategy
- ADM
- Overview
- Financial Overview
- Product Offerings
- Developments
- Business Strategy
- DuPont
- Overview
- Financial Overview
- Product Offerings
- Developments
- Business Strategy
- Lonza
- Overview
- Financial Overview
- Product Offerings
- Developments
- Business Strategy
- Kerry Group plc
- Overview
- Financial Overview
- Product Offerings
- Developments
- Business Strategy
- Cargill
- Overview
- Financial Overview
- Product Offerings
- Developments
- Business Strategy
- The Green Labs LLC
- Companies to Watch
- Emsland
- Overview
- Products & Services
- Business Strategy
- Nexira
- Overview
- Products & Services
- Business Strategy
- Tate & Lyle
- Overview
- Products & Services
- Business Strategy
- NutriPea Ltd
- Overview
- Products & Services
- Business Strategy
- Farbest Brands
- Overview
- Products & Services
- Business Strategy
- R & S Blumos
- Overview
- Products & Services
- Business Strategy
- PURIS
- Overview
- Products & Services
- Business Strategy
- Emsland
- Analyst Opinion
- Annexure
- Report Scope
- Market Definitions
- Research Methodology
- Data Collation and In-house Estimation
- Market Triangulation
- Forecasting
- Report Assumptions
- Declarations
- Stakeholders
- Abbreviations
TABLE 1. GLOBAL DIETARY FIBERS MARKET VALUE, BY PRODUCT, 2020-2026 (USD BILLION)
TABLE 2. GLOBAL DIETARY FIBERS MARKET VALUE FOR SOLUBLE DIETARY FIBERS, BY GEOGRAPHY, 2020-2026 (USD BILLION)
TABLE 3. GLOBAL DIETARY FIBERS MARKET VALUE FOR INULIN, BY TYPE, 2020-2026 (USD BILLION)
TABLE 4. GLOBAL DIETARY FIBERS MARKET VALUE FOR PECTIN, BY TYPE, 2020-2026 (USD BILLION)
TABLE 5. GLOBAL DIETARY FIBERS MARKET VALUE FOR POLYDEXTROSE, BY TYPE, 2020-2026 (USD BILLION)
TABLE 6. GLOBAL DIETARY FIBERS MARKET VALUE FOR BETA-GLUCAN, BY TYPE, 2020-2026 (USD BILLION)
TABLE 7. GLOBAL DIETARY FIBERS MARKET VALUE FOR FRUCTOOLIGOSACCHARIDES (FOS), BY TYPE, 2020-2026 (USD BILLION)
TABLE 8. GLOBAL DIETARY FIBERS MARKET VALUE FOR GALACTOOLIGOSACCHARIDES (GOS), BY TYPE, 2020-2026 (USD BILLION)
TABLE 9. GLOBAL DIETARY FIBERS MARKET VALUE FOR CORN FIBER, BY TYPE, 2020-2026 (USD BILLION)
TABLE 10. GLOBAL DIETARY FIBERS MARKET VALUE FOR OTHERS (DEXTRIN, GUM FIBERS), BY TYPE, 2020-2026 (USD BILLION)
TABLE 11. GLOBAL DIETARY FIBERS MARKET VALUE FOR INSOLUBLE DIETARY FIBERS, BY GEOGRAPHY, 2020-2026 (USD BILLION)
TABLE 12. GLOBAL DIETARY FIBERS MARKET VALUE FOR CELLULOSE, BY TYPE, 2020-2026 (USD BILLION)
TABLE 13. GLOBAL DIETARY FIBERS MARKET VALUE FOR HEMICELLULOSE, BY TYPE, 2020-2026 (USD BILLION)
TABLE 14. GLOBAL DIETARY FIBERS MARKET VALUE FOR CHITIN & CHITOSAN, BY TYPE, 2020-2026 (USD BILLION)
TABLE 15. GLOBAL DIETARY FIBERS MARKET VALUE FOR LIGNIN, BY TYPE, 2020-2026 (USD BILLION)
TABLE 16. GLOBAL DIETARY FIBERS MARKET VALUE FOR FIBER/BRAN, BY TYPE, 2020-2026 (USD BILLION)
TABLE 17. GLOBAL DIETARY FIBERS MARKET VALUE FOR RESISTANT STARCH, BY TYPE, 2020-2026 (USD BILLION)
TABLE 18. GLOBAL DIETARY FIBERS MARKET VALUE FOR OTHERS, BY TYPE, 2020-2026 (USD BILLION)
TABLE 19. GLOBAL DIETARY FIBERS MARKET VALUE, BY SOURCE, 2020-2026 (USD BILLION)
TABLE 20. GLOBAL DIETARY FIBERS MARKET VALUE FOR CEREALS & GRAINS, BY GEOGRAPHY, 2020-2026 (USD BILLION)
TABLE 21. GLOBAL DIETARY FIBERS MARKET VALUE FOR FRUITS & VEGETABLES, BY GEOGRAPHY, 2020-2026 (USD BILLION)
TABLE 22. GLOBAL DIETARY FIBERS MARKET VALUE FOR OTHERS (NUTS & SEEDS, LEGUMES), BY GEOGRAPHY, 2020-2026 (USD BILLION)
TABLE 23. GLOBAL DIETARY FIBERS MARKET VALUE, BY APPLICATION, 2020-2026 (USD BILLION)
TABLE 24. GLOBAL DIETARY FIBERS MARKET VALUE FOR FUNCTIONAL FOOD AND BEVERAGES, 2020-2026 (USD BILLION)
TABLE 25. GLOBAL DIETARY FIBERS MARKET VALUE FOR PHARMACEUTICALS, BY GEOGRAPHY, 2020-2026 (USD BILLION)
TABLE 26. GLOBAL DIETARY FIBERS MARKET VALUE FOR FEED, BY GEOGRAPHY, 2020-2026 (USD BILLION)
TABLE 27. GLOBAL DIETARY FIBERS MARKET VALUE FOR OTHER APPLICATIONS, BY GEOGRAPHY, 2020-2026 (USD BILLION)
TABLE 28. NORTH AMERICA DIETARY FIBERS MARKET VALUE, BY COUNTRY, 2020-2026 (USD BILLION)
TABLE 29. NORTH AMERICA DIETARY FIBERS MARKET VALUE, BY PRODUCT, 2020-2026 (USD BILLION)
TABLE 30. NORTH AMERICA DIETARY FIBERS MARKET VALUE, BY SOURCE, 2020-2026 (USD BILLION)
TABLE 31. NORTH AMERICA DIETARY FIBERS MARKET VALUE, BY APPLICATION, 2020-2026 (USD BILLION)
TABLE 32. U.S DIETARY FIBERS MARKET VALUE, BY PRODUCT, 2020-2026 (USD BILLION)
TABLE 33. U.S DIETARY FIBERS MARKET VALUE, BY SOURCE, 2020-2026 (USD BILLION)
TABLE 34. U.S DIETARY FIBERS MARKET VALUE, BY APPLICATION, 2020-2026 (USD BILLION)
TABLE 35. CANADA DIETARY FIBERS MARKET VALUE, BY PRODUCT, 2020-2026 (USD BILLION)
TABLE 36. CANADA DIETARY FIBERS MARKET VALUE, BY SOURCE, 2020-2026 (USD BILLION)
TABLE 37. CANADA DIETARY FIBERS MARKET VALUE, BY APPLICATION, 2020-2026 (USD BILLION)
TABLE 38. EUROPE DIETARY FIBERS MARKET VALUE, BY COUNTRY, 2020-2026 (USD BILLION)
TABLE 39. EUROPE DIETARY FIBERS MARKET VALUE, BY PRODUCT, 2020-2026 (USD BILLION)
TABLE 40. EUROPE DIETARY FIBERS MARKET VALUE, BY SOURCE, 2020-2026 (USD BILLION)
TABLE 41. EUROPE DIETARY FIBERS MARKET VALUE, APPLICATION, 2020-2026 (USD BILLION)
TABLE 42. GERMANY DIETARY FIBERS MARKET VALUE, BY PRODUCT, 2020-2026 (USD BILLION)
TABLE 43. GERMANY DIETARY FIBERS MARKET VALUE, BY SOURCE, 2020-2026 (USD BILLION)
TABLE 44. GERMANY DIETARY FIBERS MARKET VALUE, BY APPLICATION, 2020-2026 (USD BILLION)
TABLE 45. U.K DIETARY FIBERS MARKET VALUE, BY PRODUCT, 2020-2026 (USD BILLION)
TABLE 46. U.K DIETARY FIBERS MARKET VALUE, BY SOURCE, 2020-2026 (USD BILLION)
TABLE 47. U.K DIETARY FIBERS MARKET VALUE, BY APPLICATION, 2020-2026 (USD BILLION)
TABLE 48. FRANCE DIETARY FIBERS MARKET VALUE, BY PRODUCT, 2020-2026 (USD BILLION)
TABLE 49. FRANCE DIETARY FIBERS MARKET VALUE, BY SOURCE, 2020-2026 (USD BILLION)
TABLE 50. FRANCE DIETARY FIBERS MARKET VALUE, BY APPLICATION, 2020-2026 (USD BILLION)
TABLE 51. ITALY DIETARY FIBERS MARKET VALUE, BY PRODUCT, 2020-2026 (USD BILLION)
TABLE 52. ITALY DIETARY FIBERS MARKET VALUE, BY SOURCE, 2020-2026 (USD BILLION)
TABLE 53. ITALY DIETARY FIBERS MARKET VALUE, BY APPLICATION, 2020-2026 (USD BILLION)
TABLE 54. SPAIN DIETARY FIBERS MARKET VALUE, BY PRODUCT, 2020-2026 (USD BILLION)
TABLE 55. SPAIN DIETARY FIBERS MARKET VALUE, BY SOURCE, 2020-2026 (USD BILLION)
TABLE 56. SPAIN DIETARY FIBERS MARKET VALUE, BY APPLICATION, 2020-2026 (USD BILLION)
TABLE 57. ROE DIETARY FIBERS MARKET VALUE, BY PRODUCT, 2020-2026 (USD BILLION)
TABLE 58. ROE DIETARY FIBERS MARKET VALUE, BY SOURCE, 2020-2026 (USD BILLION)
TABLE 59. ROE DIETARY FIBERS MARKET VALUE, BY APPLICATION, 2020-2026 (USD BILLION)
TABLE 60. ASIA PACIFIC DIETARY FIBERS MARKET VALUE, BY COUNTRY, 2020-2026 (USD BILLION)
TABLE 61. ASIA PACIFIC DIETARY FIBERS MARKET VALUE, BY PRODUCT, 2020-2026 (USD BILLION)
TABLE 62. ASIA PACIFIC DIETARY FIBERS MARKET VALUE, BY SOURCE, 2020-2026 (USD BILLION)
TABLE 63. ASIA PACIFIC DIETARY FIBERS MARKET VALUE, BY APPLICATION, 2020-2026 (USD BILLION)
TABLE 64. CHINA DIETARY FIBERS MARKET VALUE, BY PRODUCT, 2020-2026 (USD BILLION)
TABLE 65. CHINA DIETARY FIBERS MARKET VALUE, BY SOURCE, 2020-2026 (USD BILLION)
TABLE 66. CHINA DIETARY FIBERS MARKET VALUE, BY APPLICATION, 2020-2026 (USD BILLION)
TABLE 67. INDIA DIETARY FIBERS MARKET VALUE, BY PRODUCT, 2020-2026 (USD BILLION)
TABLE 68. INDIA DIETARY FIBERS MARKET VALUE, BY SOURCE, 2020-2026 (USD BILLION)
TABLE 69. INDIA DIETARY FIBERS MARKET VALUE, BY APPLICATION, 2020-2026 (USD BILLION)
TABLE 70. JAPAN DIETARY FIBERS MARKET VALUE, BY PRODUCT, 2020-2026 (USD BILLION)
TABLE 71. JAPAN DIETARY FIBERS MARKET VALUE, BY SOURCE, 2020-2026 (USD BILLION)
TABLE 72. JAPAN DIETARY FIBERS MARKET VALUE, BY APPLICATION, 2020-2026 (USD BILLION)
TABLE 73. REST OF APAC DIETARY FIBERS MARKET VALUE, BY PRODUCT, 2020-2026 (USD BILLION)
TABLE 74. REST OF APAC DIETARY FIBERS MARKET VALUE, BY SOURCE, 2020-2026 (USD BILLION)
TABLE 75. REST OF APAC DIETARY FIBERS MARKET VALUE, BY APPLICATION, 2020-2026 (USD BILLION)
TABLE 76. REST OF WORLD DIETARY FIBERS MARKET VALUE, BY PRODUCT, 2020-2026 (USD BILLION)
TABLE 77. REST OF WORLD DIETARY FIBERS MARKET VALUE, BY SOURCE, 2020-2026 (USD BILLION)
TABLE 78. REST OF WORLD DIETARY FIBERS MARKET VALUE, BY APPLICATION, 2020-2026 (USD BILLION)
TABLE 79. THE GREEN LABS LLC: FINANCIALS
TABLE 80. THE GREEN LABS LLC: PRODUCTS & SERVICES
TABLE 81. THE GREEN LABS LLC: RECENT DEVELOPMENTS
TABLE 82. RETTENMAIER & SÖHNE GMBH: FINANCIALS
TABLE 83. RETTENMAIER & SÖHNE GMBH: PRODUCTS & SERVICES
TABLE 84. RETTENMAIER & SÖHNE GMBH: RECENT DEVELOPMENTS
TABLE 85. ROQUETTE FRÈRES: FINANCIALS
TABLE 86. ROQUETTE FRÈRES: PRODUCTS & SERVICES
TABLE 87. ROQUETTE FRÈRES: RECENT DEVELOPMENTS
TABLE 88. INGREDION INCORPORATED: FINANCIALS
TABLE 89. INGREDION INCORPORATED: PRODUCTS & SERVICES
TABLE 90. INGREDION INCORPORATED: RECENT DEVELOPMENTS
TABLE 91. BENEO: FINANCIALS
TABLE 92. BENEO: PRODUCTS & SERVICES
TABLE 93. BENEO: RECENT DEVELOPMENTS
TABLE 94. ADM: FINANCIALS
TABLE 95. ADM: PRODUCTS & SERVICES
TABLE 96. ADM: RECENT DEVELOPMENTS
TABLE 97. DUPONT: FINANCIALS
TABLE 98. DUPONT: PRODUCTS & SERVICES
TABLE 99. DUPONT: RECENT DEVELOPMENTS
TABLE 100. LONZA: FINANCIALS
TABLE 101. LONZA: PRODUCTS & SERVICES
TABLE 102. LONZA: RECENT DEVELOPMENTS
TABLE 103. KERRY GROUP PLC: FINANCIALS
TABLE 104. KERRY GROUP PLC: PRODUCTS & SERVICES
TABLE 105. KERRY GROUP PLC: RECENT DEVELOPMENTS
TABLE 106. CARGILL: FINANCIALS
TABLE 107. CARGILL: PRODUCTS & SERVICES
TABLE 108. CARGILL: RECENT DEVELOPMENTS
TABLE 109. EMSLAND: PRODUCTS & SERVICES
TABLE 110. NEXIRA: PRODUCTS & SERVICES
TABLE 111. TATE & LYLE: PRODUCTS & SERVICES
TABLE 112. NUTRIPEA LTD: PRODUCTS & SERVICES
TABLE 113. FARBEST BRANDS: PRODUCTS & SERVICES
TABLE 114. R & S BLUMOS: PRODUCTS & SERVICES
TABLE 115. PURIS: PRODUCTS & SERVICES
Research Framework
Infoholic Research works on a holistic 360° approach in order to deliver high quality, validated and reliable information in our market reports. The Market estimation and forecasting involves following steps:
- Data Collation (Primary & Secondary)
- In-house Estimation (Based on proprietary data bases and Models)
- Market Triangulation
- Forecasting

Market related information is congregated from both primary and secondary sources.
Primary sources
Involved participants from all global stakeholders such as Solution providers, service providers, Industry associations, thought leaders etc. across levels such as CXOs, VPs and managers. Plus, our in-house industry experts having decades of industry experience contribute their consulting and advisory services.
Secondary sources
Include public sources such as regulatory frameworks, government IT spending, government demographic indicators, industry association statistics, and company publications along with paid sources such as Factiva, OneSource, Bloomberg among others.
![]()


